
 Login Sign Up


| |||||
 |  | ||||

| 12Stocks.com Market Intelligence |
Best Canada Stocks
|
|
| Quick Read: Top Canada Stocks By Performances & Trends: Daily, Weekly, Year-to-Date, Market Cap (Size) & Technical Trends | |||
| Best Canada Views: Quick Browse View, Summary & Slide Show | |||
| 12Stocks.com Canada Stocks Performances & Trends Daily | |||||||||
|
|  The overall market intelligence score is 100 (0-bearish to 100-bullish) which puts Canada index in short term bullish trend. The market intelligence score from previous trading session is 78 and hence an improvement of trend.
| ||||||||
Here are the market intelligence trend scores of the most requested Canada stocks at 12Stocks.com (click stock name for detailed review):
| |||||||||||||||||
| Scroll down this page for most comprehensive review of Canada stocks by performance, trends, technical analysis, charts, fund plays & more | |||||||||||||||||


| 12Stocks.com: Top Performing Canada Index Stocks | ||||||||||||||||||||||||||||||||||||||||||||||||
 The top performing Canada Index stocks year to date are
Now, more recently, over last week, the top performing Canada Index stocks on the move are


|
||||||||||||||||||||||||||||||||||||||||||||||||
| 12Stocks.com: Investing in Canada Index with Stocks | |
|
The following table helps investors and traders sort through current performance and trends (as measured by market intelligence score) of various
stocks in the Canada Index. Quick View: Move mouse or cursor over stock symbol (ticker) to view short-term technical chart and over stock name to view long term chart. Click on  to add stock symbol to your watchlist and to add stock symbol to your watchlist and  to view watchlist. Click on any ticker or stock name for detailed market intelligence report for that stock. to view watchlist. Click on any ticker or stock name for detailed market intelligence report for that stock. |
12Stocks.com Performance of Stocks in Canada Index
| Ticker | Stock Name | Watchlist | Category | Recent Price | Market Intelligence Score | Change % | YTD Change% |
| AGI | Alamos Gold |   | Materials | 15.25 | 83 | 1.46 | 13.21% |
| KFS | Kingsway Financial | | Financials | 9.25 | 100 | 1.43 | 10.12% |
| ERF | Enerplus | | Energy | 19.84 | 76 | 1.43 | 29.34% |
| SSRM | SSR Mining | | Materials | 5.42 | 90 | 1.40 | -49.67% |
| SLF | Sun Life | | Financials | 53.21 | 82 | 1.39 | 2.60% |
| EMX | EMX Royalty | | Materials | 1.88 | 68 | 1.29 | 15.99% |
| NFGC | New Found | | Materials | 3.59 | 61 | 1.27 | 1.99% |
| TECK | Teck Resources | | Materials | 49.90 | 90 | 1.24 | 18.05% |
| NTR | Nutrien | | Materials | 53.57 | 95 | 1.21 | -4.90% |
| PHYS | Sprott Physical | | Financials | 18.02 | 58 | 1.21 | 13.09% |
| BNS | Bank of Nova | | Financials | 47.41 | 64 | 1.20 | -2.63% |
| ENB | Enbridge | | Energy | 36.76 | 100 | 1.16 | 2.05% |
| CM | Canadian Imperial | | Financials | 48.41 | 85 | 1.12 | 0.57% |
| MOGO | Mogo | | Financials | 1.85 | 27 | 1.09 | 0.00% |
| IMAX | IMAX | | Services & Goods | 16.89 | 42 | 1.05 | 12.42% |
| ACB | Aurora Cannabis | | Health Care | 6.81 | 58 | 1.04 | NA |
| WRN | Western Copper | | Materials | 1.50 | 66 | 1.01 | 12.41% |
| CVE | Cenovus Energy | | Energy | 20.70 | 76 | 1.00 | 24.29% |
| AUPH | Aurinia | | Health Care | 5.15 | 49 | 0.98 | -42.71% |
| TU | TEL | | Technology | 16.53 | 74 | 0.92 | -7.08% |
| RPTX | Repare | | Health Care | 3.49 | 64 | 0.87 | -52.19% |
| GOOS | Canada Goose | | Consumer Staples | 11.46 | 67 | 0.84 | -3.33% |
| RCI | | Technology | 38.72 | 57 | 0.75 | -17.28% | |
| EPIX | ESSA Pharma | | Health Care | 6.92 | 57 | 0.65 | 5.89% |
| OR | Osisko Gold | | Materials | 15.54 | 58 | 0.65 | 8.82% |
| To view more stocks, click on Next / Previous arrows or select different range: 0 - 25 , 25 - 50 , 50 - 75 , 75 - 100 , 100 - 125 , 125 - 150 | ||
 | Click To Change The Sort Order: By Market Cap or Company Size Performance: Year-to-date, Week and Day |  |
| Detailed Overview Of Canada Stocks |
| Canada Technical Overview, Leaders & Laggards, Top Canada ETF Funds & Detailed Canada Stocks List, Charts, Trends & More |
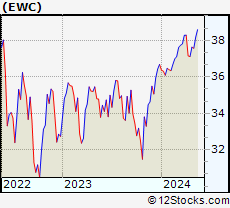
| Canada: Technical Analysis, Trends & YTD Performance | |
 EWC Weekly Chart |
|
| Long Term Trend: Very Good | |
| Medium Term Trend: Very Good | |
 EWC Daily Chart |
|
| Short Term Trend: Very Good | |
| Overall Trend Score: 100 | |
| YTD Performance: 3.88% | |
| **Trend Scores & Views Are Only For Educational Purposes And Not For Investing | |
| 12Stocks.com: Investing in Canada Index using Exchange Traded Funds | |
|
The following table shows list of key exchange traded funds (ETF) that
help investors play Canada stock market. For detailed view, check out our ETF Funds section of our website. Quick View: Move mouse or cursor over ETF symbol (ticker) to view short-term technical chart and over ETF name to view long term chart. Click on ticker or stock name for detailed view. Click on to add stock symbol to your watchlist and to view watchlist. |
12Stocks.com List of ETFs that track Canada Index
| Ticker | ETF Name | Watchlist | Recent Price | Market Intelligence Score | Change % | Week % | Year-to-date % |
| EWC | Canada | | 38.10 | 100 | 1.42 | 1.42 | 3.88% |
| 12Stocks.com: Charts, Trends, Fundamental Data and Performances of Canada Stocks | |
|
We now take in-depth look at all Canada stocks including charts, multi-period performances and overall trends (as measured by market intelligence score). One can sort Canada stocks (click link to choose) by Daily, Weekly and by Year-to-Date performances. Also, one can sort by size of the company or by market capitalization. |
| Select Your Default Chart Type: | |||||
| |||||
| Click on stock symbol or name for detailed view. Click on to add stock symbol to your watchlist and to view watchlist. Quick View: Move mouse or cursor over "Daily" to quickly view daily technical stock chart and over "Weekly" to view weekly technical stock chart. | |||||

 | AGI Alamos Gold Inc. |
| Sector: Materials | |
| SubSector: Gold | |
| MarketCap: 1740.39 Millions | |
| Recent Price: 15.25 Market Intelligence Score: 83 | |
| Day Percent Change: 1.46% Day Change: 0.22 | |
| Week Change: 1.46% Year-to-date Change: 13.2% | |
| AGI Links: Profile News Message Board | |
| Charts:- Daily , Weekly | |
| Add AGI to Watchlist: View: Get Complete AGI Trend Analysis ➞ | |
 | KFS Kingsway Financial Services Inc. |
| Sector: Financials | |
| SubSector: Property & Casualty Insurance | |
| MarketCap: 47.5812 Millions | |
| Recent Price: 9.25 Market Intelligence Score: 100 | |
| Day Percent Change: 1.43% Day Change: 0.13 | |
| Week Change: 1.43% Year-to-date Change: 10.1% | |
| KFS Links: Profile News Message Board | |
| Charts:- Daily , Weekly | |
| Add KFS to Watchlist: View: Get Complete KFS Trend Analysis ➞ | |
 | ERF Enerplus Corporation |
| Sector: Energy | |
| SubSector: Oil & Gas Drilling & Exploration | |
| MarketCap: 372.639 Millions | |
| Recent Price: 19.84 Market Intelligence Score: 76 | |
| Day Percent Change: 1.43% Day Change: 0.28 | |
| Week Change: 1.43% Year-to-date Change: 29.3% | |
| ERF Links: Profile News Message Board | |
| Charts:- Daily , Weekly | |
| Add ERF to Watchlist: View: Get Complete ERF Trend Analysis ➞ | |
 | SSRM SSR Mining Inc. |
| Sector: Materials | |
| SubSector: Gold | |
| MarketCap: 1546.09 Millions | |
| Recent Price: 5.42 Market Intelligence Score: 90 | |
| Day Percent Change: 1.40% Day Change: 0.08 | |
| Week Change: 1.4% Year-to-date Change: -49.7% | |
| SSRM Links: Profile News Message Board | |
| Charts:- Daily , Weekly | |
| Add SSRM to Watchlist: View: Get Complete SSRM Trend Analysis ➞ | |
 | SLF Sun Life Financial Inc. |
| Sector: Financials | |
| SubSector: Property & Casualty Insurance | |
| MarketCap: 17722 Millions | |
| Recent Price: 53.21 Market Intelligence Score: 82 | |
| Day Percent Change: 1.39% Day Change: 0.73 | |
| Week Change: 1.39% Year-to-date Change: 2.6% | |
| SLF Links: Profile News Message Board | |
| Charts:- Daily , Weekly | |
| Add SLF to Watchlist: View: Get Complete SLF Trend Analysis ➞ | |
 | EMX EMX Royalty Corporation |
| Sector: Materials | |
| SubSector: Industrial Metals & Minerals | |
| MarketCap: 103.91 Millions | |
| Recent Price: 1.88 Market Intelligence Score: 68 | |
| Day Percent Change: 1.29% Day Change: 0.02 | |
| Week Change: 1.29% Year-to-date Change: 16.0% | |
| EMX Links: Profile News Message Board | |
| Charts:- Daily , Weekly | |
| Add EMX to Watchlist: View: Get Complete EMX Trend Analysis ➞ | |
 | NFGC New Found Gold Corp. |
| Sector: Materials | |
| SubSector: Gold | |
| MarketCap: 868 Millions | |
| Recent Price: 3.59 Market Intelligence Score: 61 | |
| Day Percent Change: 1.27% Day Change: 0.04 | |
| Week Change: 1.27% Year-to-date Change: 2.0% | |
| NFGC Links: Profile News Message Board | |
| Charts:- Daily , Weekly | |
| Add NFGC to Watchlist: View: Get Complete NFGC Trend Analysis ➞ | |
 | TECK Teck Resources Limited |
| Sector: Materials | |
| SubSector: Industrial Metals & Minerals | |
| MarketCap: 4347.4 Millions | |
| Recent Price: 49.90 Market Intelligence Score: 90 | |
| Day Percent Change: 1.24% Day Change: 0.61 | |
| Week Change: 1.24% Year-to-date Change: 18.1% | |
| TECK Links: Profile News Message Board | |
| Charts:- Daily , Weekly | |
| Add TECK to Watchlist: View: Get Complete TECK Trend Analysis ➞ | |
 | NTR Nutrien Ltd. |
| Sector: Materials | |
| SubSector: Agricultural Chemicals | |
| MarketCap: 15897.9 Millions | |
| Recent Price: 53.57 Market Intelligence Score: 95 | |
| Day Percent Change: 1.21% Day Change: 0.64 | |
| Week Change: 1.21% Year-to-date Change: -4.9% | |
| NTR Links: Profile News Message Board | |
| Charts:- Daily , Weekly | |
| Add NTR to Watchlist: View: Get Complete NTR Trend Analysis ➞ | |
 | PHYS Sprott Physical Gold Trust |
| Sector: Financials | |
| SubSector: Exchange Traded Fund | |
| MarketCap: 2365.21 Millions | |
| Recent Price: 18.02 Market Intelligence Score: 58 | |
| Day Percent Change: 1.21% Day Change: 0.21 | |
| Week Change: 1.21% Year-to-date Change: 13.1% | |
| PHYS Links: Profile News Message Board | |
| Charts:- Daily , Weekly | |
| Add PHYS to Watchlist: View: Get Complete PHYS Trend Analysis ➞ | |
 | BNS The Bank of Nova Scotia |
| Sector: Financials | |
| SubSector: Money Center Banks | |
| MarketCap: 48742.1 Millions | |
| Recent Price: 47.41 Market Intelligence Score: 64 | |
| Day Percent Change: 1.20% Day Change: 0.56 | |
| Week Change: 1.2% Year-to-date Change: -2.6% | |
| BNS Links: Profile News Message Board | |
| Charts:- Daily , Weekly | |
| Add BNS to Watchlist: View: Get Complete BNS Trend Analysis ➞ | |
 | ENB Enbridge Inc. |
| Sector: Energy | |
| SubSector: Oil & Gas Pipelines | |
| MarketCap: 62578.4 Millions | |
| Recent Price: 36.76 Market Intelligence Score: 100 | |
| Day Percent Change: 1.16% Day Change: 0.42 | |
| Week Change: 1.16% Year-to-date Change: 2.1% | |
| ENB Links: Profile News Message Board | |
| Charts:- Daily , Weekly | |
| Add ENB to Watchlist: View: Get Complete ENB Trend Analysis ➞ | |
 | CM Canadian Imperial Bank of Commerce |
| Sector: Financials | |
| SubSector: Money Center Banks | |
| MarketCap: 27150.5 Millions | |
| Recent Price: 48.41 Market Intelligence Score: 85 | |
| Day Percent Change: 1.12% Day Change: 0.53 | |
| Week Change: 1.12% Year-to-date Change: 0.6% | |
| CM Links: Profile News Message Board | |
| Charts:- Daily , Weekly | |
| Add CM to Watchlist: View: Get Complete CM Trend Analysis ➞ | |
 | MOGO Mogo Inc. |
| Sector: Financials | |
| SubSector: Credit Services | |
| MarketCap: 21.9208 Millions | |
| Recent Price: 1.85 Market Intelligence Score: 27 | |
| Day Percent Change: 1.09% Day Change: 0.02 | |
| Week Change: 1.09% Year-to-date Change: 0.0% | |
| MOGO Links: Profile News Message Board | |
| Charts:- Daily , Weekly | |
| Add MOGO to Watchlist: View: Get Complete MOGO Trend Analysis ➞ | |
 | IMAX IMAX Corporation |
| Sector: Services & Goods | |
| SubSector: Entertainment - Diversified | |
| MarketCap: 874.237 Millions | |
| Recent Price: 16.89 Market Intelligence Score: 42 | |
| Day Percent Change: 1.05% Day Change: 0.18 | |
| Week Change: 1.05% Year-to-date Change: 12.4% | |
| IMAX Links: Profile News Message Board | |
| Charts:- Daily , Weekly | |
| Add IMAX to Watchlist: View: Get Complete IMAX Trend Analysis ➞ | |
 | ACB Aurora Cannabis Inc. |
| Sector: Health Care | |
| SubSector: Drug Manufacturers - Other | |
| MarketCap: 853.333 Millions | |
| Recent Price: 6.81 Market Intelligence Score: 58 | |
| Day Percent Change: 1.04% Day Change: 0.07 | |
| Week Change: 1.04% Year-to-date Change: 1,330.1% | |
| ACB Links: Profile News Message Board | |
| Charts:- Daily , Weekly | |
| Add ACB to Watchlist: View: Get Complete ACB Trend Analysis ➞ | |
 | WRN Western Copper and Gold Corporation |
| Sector: Materials | |
| SubSector: Industrial Metals & Minerals | |
| MarketCap: 38.191 Millions | |
| Recent Price: 1.50 Market Intelligence Score: 66 | |
| Day Percent Change: 1.01% Day Change: 0.02 | |
| Week Change: 1.01% Year-to-date Change: 12.4% | |
| WRN Links: Profile News Message Board | |
| Charts:- Daily , Weekly | |
| Add WRN to Watchlist: View: Get Complete WRN Trend Analysis ➞ | |
 | CVE Cenovus Energy Inc. |
| Sector: Energy | |
| SubSector: Oil & Gas Drilling & Exploration | |
| MarketCap: 2369.29 Millions | |
| Recent Price: 20.70 Market Intelligence Score: 76 | |
| Day Percent Change: 1.00% Day Change: 0.21 | |
| Week Change: 1% Year-to-date Change: 24.3% | |
| CVE Links: Profile News Message Board | |
| Charts:- Daily , Weekly | |
| Add CVE to Watchlist: View: Get Complete CVE Trend Analysis ➞ | |
 | AUPH Aurinia Pharmaceuticals Inc. |
| Sector: Health Care | |
| SubSector: Biotechnology | |
| MarketCap: 1319.75 Millions | |
| Recent Price: 5.15 Market Intelligence Score: 49 | |
| Day Percent Change: 0.98% Day Change: 0.05 | |
| Week Change: 0.98% Year-to-date Change: -42.7% | |
| AUPH Links: Profile News Message Board | |
| Charts:- Daily , Weekly | |
| Add AUPH to Watchlist: View: Get Complete AUPH Trend Analysis ➞ | |
 | TU TELUS Corporation |
| Sector: Technology | |
| SubSector: Wireless Communications | |
| MarketCap: 10864.7 Millions | |
| Recent Price: 16.53 Market Intelligence Score: 74 | |
| Day Percent Change: 0.92% Day Change: 0.15 | |
| Week Change: 0.92% Year-to-date Change: -7.1% | |
| TU Links: Profile News Message Board | |
| Charts:- Daily , Weekly | |
| Add TU to Watchlist: View: Get Complete TU Trend Analysis ➞ | |
 | RPTX Repare Therapeutics Inc. |
| Sector: Health Care | |
| SubSector: Biotechnology | |
| MarketCap: 13687 Millions | |
| Recent Price: 3.49 Market Intelligence Score: 64 | |
| Day Percent Change: 0.87% Day Change: 0.03 | |
| Week Change: 0.87% Year-to-date Change: -52.2% | |
| RPTX Links: Profile News Message Board | |
| Charts:- Daily , Weekly | |
| Add RPTX to Watchlist: View: Get Complete RPTX Trend Analysis ➞ | |
 | GOOS Canada Goose Holdings Inc. |
| Sector: Consumer Staples | |
| SubSector: Textile - Apparel Clothing | |
| MarketCap: 881.465 Millions | |
| Recent Price: 11.46 Market Intelligence Score: 67 | |
| Day Percent Change: 0.84% Day Change: 0.10 | |
| Week Change: 0.84% Year-to-date Change: -3.3% | |
| GOOS Links: Profile News Message Board | |
| Charts:- Daily , Weekly | |
| Add GOOS to Watchlist: View: Get Complete GOOS Trend Analysis ➞ | |
 | RCI Rogers Communications Inc. |
| Sector: Technology | |
| SubSector: Wireless Communications | |
| MarketCap: 22111.6 Millions | |
| Recent Price: 38.72 Market Intelligence Score: 57 | |
| Day Percent Change: 0.75% Day Change: 0.29 | |
| Week Change: 0.75% Year-to-date Change: -17.3% | |
| RCI Links: Profile News Message Board | |
| Charts:- Daily , Weekly | |
| Add RCI to Watchlist: View: Get Complete RCI Trend Analysis ➞ | |
 | EPIX ESSA Pharma Inc. |
| Sector: Health Care | |
| SubSector: Biotechnology | |
| MarketCap: 70.5785 Millions | |
| Recent Price: 6.92 Market Intelligence Score: 57 | |
| Day Percent Change: 0.65% Day Change: 0.04 | |
| Week Change: 0.65% Year-to-date Change: 5.9% | |
| EPIX Links: Profile News Message Board | |
| Charts:- Daily , Weekly | |
| Add EPIX to Watchlist: View: Get Complete EPIX Trend Analysis ➞ | |
 | OR Osisko Gold Royalties Ltd |
| Sector: Materials | |
| SubSector: Gold | |
| MarketCap: 1025.99 Millions | |
| Recent Price: 15.54 Market Intelligence Score: 58 | |
| Day Percent Change: 0.65% Day Change: 0.10 | |
| Week Change: 0.65% Year-to-date Change: 8.8% | |
| OR Links: Profile News Message Board | |
| Charts:- Daily , Weekly | |
| Add OR to Watchlist: View: Get Complete OR Trend Analysis ➞ | |
| To view more stocks, click on Next / Previous arrows or select different range: 0 - 25 , 25 - 50 , 50 - 75 , 75 - 100 , 100 - 125 , 125 - 150 | ||
| Click To Change The Sort Order: By Market Cap or Company Size Performance: Year-to-date, Week and Day | |
| Select Chart Type: | ||
 Best Stocks Today 12Stocks.com |
© 2024 12Stocks.com Terms & Conditions Privacy Contact Us
All Information Provided Only For Education And Not To Be Used For Investing or Trading. See Terms & Conditions


One More Thing ... Get Best Stocks Delivered Daily!
Never Ever Miss A Move With Our Top Ten Stocks Lists
Find Best Stocks In Any Market - Bull or Bear Market
Take A Peek At Our Top Ten Stocks Lists: Daily, Weekly, Year-to-Date & Top Trends
Find Best Stocks In Any Market - Bull or Bear Market
Take A Peek At Our Top Ten Stocks Lists: Daily, Weekly, Year-to-Date & Top Trends
Canada Stocks With Best Up Trends [0-bearish to 100-bullish]: Milestone [100], Cameco [100], BlackBerry [100], Brookfield Renewable[100], Algonquin Power[100], Algonquin Power[100], Denison Mines[100], Mercer [100], TransAlta [100], Bank of Montreal[100], Methanex [100]
Best Canada Stocks Year-to-Date:
Aurora Cannabis[1330.07%], Fusion [123.65%], Canopy Growth[108.61%], McEwen Mining[68.79%], D-Wave Quantum[59.56%], Hudbay Minerals[52.26%], IAMGOLD [47.63%], OrganiGram [45.8%], Endeavour Silver[45.69%], Gold Royalty[33.56%], SilverCrest Metals[30.46%] Best Canada Stocks This Week:
Endeavour Silver[8.3%], Majestic Silver[6.72%], Bausch +[6.59%], Milestone [5.92%], Ivanhoe Electric[5.91%], Fortuna Silver[5.77%], Lion Electric[5.45%], Cameco [4.94%], Canopy Growth[4.1%], IAMGOLD [4.04%], Sandstorm Gold[3.96%] Best Canada Stocks Daily:
Endeavour Silver[8.30%], Majestic Silver[6.72%], Bausch +[6.59%], Milestone [5.92%], Ivanhoe Electric[5.91%], Fortuna Silver[5.77%], Lion Electric[5.45%], Cameco [4.94%], Canopy Growth[4.10%], IAMGOLD [4.04%], Sandstorm Gold[3.96%]