
 Login Sign Up


| |||||
 |  | ||||

| 12Stocks.com Market Intelligence |
Best Canada Stocks
|
|
| Quick Read: Top Canada Stocks By Performances & Trends: Daily, Weekly, Year-to-Date, Market Cap (Size) & Technical Trends | |||
| Best Canada Views: Quick Browse View, Summary & Slide Show | |||
| 12Stocks.com Canada Stocks Performances & Trends Daily | |||||||||
|
|  The overall market intelligence score is 49 (0-bearish to 100-bullish) which puts Canada index in short term neutral trend. The market intelligence score from previous trading session is 21 and hence an improvement of trend.
| ||||||||
Here are the market intelligence trend scores of the most requested Canada stocks at 12Stocks.com (click stock name for detailed review):
| |||||||||||||||||
| Scroll down this page for most comprehensive review of Canada stocks by performance, trends, technical analysis, charts, fund plays & more | |||||||||||||||||


| 12Stocks.com: Top Performing Canada Index Stocks | ||||||||||||||||||||||||||||||||||||||||||||||||
 The top performing Canada Index stocks year to date are
Now, more recently, over last week, the top performing Canada Index stocks on the move are


|
||||||||||||||||||||||||||||||||||||||||||||||||
| 12Stocks.com: Investing in Canada Index with Stocks | |
|
The following table helps investors and traders sort through current performance and trends (as measured by market intelligence score) of various
stocks in the Canada Index. Quick View: Move mouse or cursor over stock symbol (ticker) to view short-term technical chart and over stock name to view long term chart. Click on  to add stock symbol to your watchlist and to add stock symbol to your watchlist and  to view watchlist. Click on any ticker or stock name for detailed market intelligence report for that stock. to view watchlist. Click on any ticker or stock name for detailed market intelligence report for that stock. |
12Stocks.com Performance of Stocks in Canada Index
| Ticker | Stock Name | Watchlist | Category | Recent Price | Market Intelligence Score | Change % | YTD Change% |
| LAC | Lithium Americas |   | Materials | 4.42 | 20 | 1.49 | -31.02% |
| KGC | Kinross Gold | | Materials | 6.59 | 68 | 1.46 | 9.01% |
| FSI | Flexible | | Materials | 2.10 | 36 | 1.45 | 9.95% |
| CVE | Cenovus Energy | | Energy | 20.63 | 46 | 1.43 | 23.90% |
| BUR | Burcon Nutrascience | | Health Care | 15.68 | 24 | 1.42 | 0.51% |
| AEM | Agnico Eagle | | Materials | 65.16 | 80 | 1.42 | 18.79% |
| TCX | Tucows | | Technology | 18.30 | 74 | 1.39 | -32.22% |
| IAG | IAMGOLD | | Materials | 3.67 | 53 | 1.38 | 45.06% |
| CP | Canadian Pacific | | Transports | 78.58 | 17 | 1.31 | -0.60% |
| PDS | Precision Drilling | | Energy | 69.75 | 53 | 1.29 | 28.48% |
| EGO | Eldorado Gold | | Materials | 14.59 | 46 | 1.25 | 12.49% |
| SHOP | Shopify | | Technology | 71.28 | 42 | 1.24 | -8.50% |
| ENB | Enbridge | | Energy | 36.03 | 88 | 1.24 | 0.03% |
| MGA | Magna | | Services & Goods | 48.21 | 17 | 1.20 | -18.40% |
| APT | Alpha Tech | | Industrials | 5.98 | 49 | 1.18 | 13.04% |
| SAND | Sandstorm Gold | | Materials | 5.64 | 88 | 1.16 | 12.23% |
| IMO | Imperial Oil | | Energy | 68.16 | 31 | 1.14 | 19.18% |
| EXK | Endeavour Silver | | Materials | 2.70 | 46 | 1.12 | 37.06% |
| ERF | Enerplus | | Energy | 19.55 | 53 | 1.11 | 27.41% |
| SU | Suncor Energy | | Energy | 38.06 | 58 | 1.09 | 18.79% |
| AUPH | Aurinia | | Health Care | 5.25 | 74 | 1.06 | -41.55% |
| IMAX | IMAX | | Services & Goods | 16.36 | 25 | 1.05 | 8.92% |
| AG | Majestic Silver | | Materials | 6.80 | 53 | 1.04 | 10.57% |
| MERC | Mercer | | Consumer Staples | 10.35 | 100 | 1.03 | 9.12% |
| FSM | Fortuna Silver | | Materials | 4.74 | 90 | 0.96 | 22.67% |
| To view more stocks, click on Next / Previous arrows or select different range: 0 - 25 , 25 - 50 , 50 - 75 , 75 - 100 , 100 - 125 , 125 - 150 | ||
 | Click To Change The Sort Order: By Market Cap or Company Size Performance: Year-to-date, Week and Day |  |
| Detailed Overview Of Canada Stocks |
| Canada Technical Overview, Leaders & Laggards, Top Canada ETF Funds & Detailed Canada Stocks List, Charts, Trends & More |
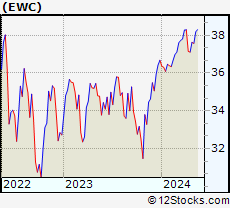
| Canada: Technical Analysis, Trends & YTD Performance | |
 EWC Weekly Chart |
|
| Long Term Trend: Good | |
| Medium Term Trend: Good | |
 EWC Daily Chart |
|
| Short Term Trend: Deteriorating | |
| Overall Trend Score: 49 | |
| YTD Performance: 1.54% | |
| **Trend Scores & Views Are Only For Educational Purposes And Not For Investing | |
| 12Stocks.com: Investing in Canada Index using Exchange Traded Funds | |
|
The following table shows list of key exchange traded funds (ETF) that
help investors play Canada stock market. For detailed view, check out our ETF Funds section of our website. Quick View: Move mouse or cursor over ETF symbol (ticker) to view short-term technical chart and over ETF name to view long term chart. Click on ticker or stock name for detailed view. Click on to add stock symbol to your watchlist and to view watchlist. |
12Stocks.com List of ETFs that track Canada Index
| Ticker | ETF Name | Watchlist | Recent Price | Market Intelligence Score | Change % | Week % | Year-to-date % |
| EWC | Canada | | 37.24 | 49 | 0.83 | -1.02 | 1.54% |
| 12Stocks.com: Charts, Trends, Fundamental Data and Performances of Canada Stocks | |
|
We now take in-depth look at all Canada stocks including charts, multi-period performances and overall trends (as measured by market intelligence score). One can sort Canada stocks (click link to choose) by Daily, Weekly and by Year-to-Date performances. Also, one can sort by size of the company or by market capitalization. |
| Select Your Default Chart Type: | |||||
| |||||
| Click on stock symbol or name for detailed view. Click on to add stock symbol to your watchlist and to view watchlist. Quick View: Move mouse or cursor over "Daily" to quickly view daily technical stock chart and over "Weekly" to view weekly technical stock chart. | |||||

 | LAC Lithium Americas Corp. |
| Sector: Materials | |
| SubSector: Industrial Metals & Minerals | |
| MarketCap: 192.01 Millions | |
| Recent Price: 4.42 Market Intelligence Score: 20 | |
| Day Percent Change: 1.49% Day Change: 0.07 | |
| Week Change: -4.44% Year-to-date Change: -31.0% | |
| LAC Links: Profile News Message Board | |
| Charts:- Daily , Weekly | |
| Add LAC to Watchlist: View: Get Complete LAC Trend Analysis ➞ | |
 | KGC Kinross Gold Corporation |
| Sector: Materials | |
| SubSector: Gold | |
| MarketCap: 5389.29 Millions | |
| Recent Price: 6.59 Market Intelligence Score: 68 | |
| Day Percent Change: 1.46% Day Change: 0.09 | |
| Week Change: -2.15% Year-to-date Change: 9.0% | |
| KGC Links: Profile News Message Board | |
| Charts:- Daily , Weekly | |
| Add KGC to Watchlist: View: Get Complete KGC Trend Analysis ➞ | |
 | FSI Flexible Solutions International Inc. |
| Sector: Materials | |
| SubSector: Specialty Chemicals | |
| MarketCap: 14.3357 Millions | |
| Recent Price: 2.10 Market Intelligence Score: 36 | |
| Day Percent Change: 1.45% Day Change: 0.03 | |
| Week Change: -4.11% Year-to-date Change: 10.0% | |
| FSI Links: Profile News Message Board | |
| Charts:- Daily , Weekly | |
| Add FSI to Watchlist: View: Get Complete FSI Trend Analysis ➞ | |
 | CVE Cenovus Energy Inc. |
| Sector: Energy | |
| SubSector: Oil & Gas Drilling & Exploration | |
| MarketCap: 2369.29 Millions | |
| Recent Price: 20.63 Market Intelligence Score: 46 | |
| Day Percent Change: 1.43% Day Change: 0.29 | |
| Week Change: -3.87% Year-to-date Change: 23.9% | |
| CVE Links: Profile News Message Board | |
| Charts:- Daily , Weekly | |
| Add CVE to Watchlist: View: Get Complete CVE Trend Analysis ➞ | |
 | BUR Burcon Nutrascience Corporation |
| Sector: Health Care | |
| SubSector: Biotechnology | |
| MarketCap: 0 Millions | |
| Recent Price: 15.68 Market Intelligence Score: 24 | |
| Day Percent Change: 1.42% Day Change: 0.22 | |
| Week Change: 1.88% Year-to-date Change: 0.5% | |
| BUR Links: Profile News Message Board | |
| Charts:- Daily , Weekly | |
| Add BUR to Watchlist: View: Get Complete BUR Trend Analysis ➞ | |
 | AEM Agnico Eagle Mines Limited |
| Sector: Materials | |
| SubSector: Gold | |
| MarketCap: 9491.49 Millions | |
| Recent Price: 65.16 Market Intelligence Score: 80 | |
| Day Percent Change: 1.42% Day Change: 0.92 | |
| Week Change: -0.56% Year-to-date Change: 18.8% | |
| AEM Links: Profile News Message Board | |
| Charts:- Daily , Weekly | |
| Add AEM to Watchlist: View: Get Complete AEM Trend Analysis ➞ | |
 | TCX Tucows Inc. |
| Sector: Technology | |
| SubSector: Internet Information Providers | |
| MarketCap: 557.78 Millions | |
| Recent Price: 18.30 Market Intelligence Score: 74 | |
| Day Percent Change: 1.39% Day Change: 0.25 | |
| Week Change: 1.95% Year-to-date Change: -32.2% | |
| TCX Links: Profile News Message Board | |
| Charts:- Daily , Weekly | |
| Add TCX to Watchlist: View: Get Complete TCX Trend Analysis ➞ | |
 | IAG IAMGOLD Corporation |
| Sector: Materials | |
| SubSector: Gold | |
| MarketCap: 1158.09 Millions | |
| Recent Price: 3.67 Market Intelligence Score: 53 | |
| Day Percent Change: 1.38% Day Change: 0.05 | |
| Week Change: -2.91% Year-to-date Change: 45.1% | |
| IAG Links: Profile News Message Board | |
| Charts:- Daily , Weekly | |
| Add IAG to Watchlist: View: Get Complete IAG Trend Analysis ➞ | |
 | CP Canadian Pacific Railway Limited |
| Sector: Transports | |
| SubSector: Railroads | |
| MarketCap: 25428.5 Millions | |
| Recent Price: 78.58 Market Intelligence Score: 17 | |
| Day Percent Change: 1.31% Day Change: 1.02 | |
| Week Change: -3.79% Year-to-date Change: -0.6% | |
| CP Links: Profile News Message Board | |
| Charts:- Daily , Weekly | |
| Add CP to Watchlist: View: Get Complete CP Trend Analysis ➞ | |
 | PDS Precision Drilling Corporation |
| Sector: Energy | |
| SubSector: Oil & Gas Equipment & Services | |
| MarketCap: 103.461 Millions | |
| Recent Price: 69.75 Market Intelligence Score: 53 | |
| Day Percent Change: 1.29% Day Change: 0.89 | |
| Week Change: -3.53% Year-to-date Change: 28.5% | |
| PDS Links: Profile News Message Board | |
| Charts:- Daily , Weekly | |
| Add PDS to Watchlist: View: Get Complete PDS Trend Analysis ➞ | |
 | EGO Eldorado Gold Corporation |
| Sector: Materials | |
| SubSector: Gold | |
| MarketCap: 982.519 Millions | |
| Recent Price: 14.59 Market Intelligence Score: 46 | |
| Day Percent Change: 1.25% Day Change: 0.18 | |
| Week Change: -4.01% Year-to-date Change: 12.5% | |
| EGO Links: Profile News Message Board | |
| Charts:- Daily , Weekly | |
| Add EGO to Watchlist: View: Get Complete EGO Trend Analysis ➞ | |
 | SHOP Shopify Inc. |
| Sector: Technology | |
| SubSector: Application Software | |
| MarketCap: 45164.2 Millions | |
| Recent Price: 71.28 Market Intelligence Score: 42 | |
| Day Percent Change: 1.24% Day Change: 0.88 | |
| Week Change: -0.08% Year-to-date Change: -8.5% | |
| SHOP Links: Profile News Message Board | |
| Charts:- Daily , Weekly | |
| Add SHOP to Watchlist: View: Get Complete SHOP Trend Analysis ➞ | |
 | ENB Enbridge Inc. |
| Sector: Energy | |
| SubSector: Oil & Gas Pipelines | |
| MarketCap: 62578.4 Millions | |
| Recent Price: 36.03 Market Intelligence Score: 88 | |
| Day Percent Change: 1.24% Day Change: 0.44 | |
| Week Change: 0.59% Year-to-date Change: 0.0% | |
| ENB Links: Profile News Message Board | |
| Charts:- Daily , Weekly | |
| Add ENB to Watchlist: View: Get Complete ENB Trend Analysis ➞ | |
 | MGA Magna International Inc. |
| Sector: Services & Goods | |
| SubSector: Auto Parts Wholesale | |
| MarketCap: 8967.3 Millions | |
| Recent Price: 48.21 Market Intelligence Score: 17 | |
| Day Percent Change: 1.20% Day Change: 0.57 | |
| Week Change: -1.85% Year-to-date Change: -18.4% | |
| MGA Links: Profile News Message Board | |
| Charts:- Daily , Weekly | |
| Add MGA to Watchlist: View: Get Complete MGA Trend Analysis ➞ | |
 | APT Alpha Pro Tech, Ltd. |
| Sector: Industrials | |
| SubSector: General Building Materials | |
| MarketCap: 125.953 Millions | |
| Recent Price: 5.98 Market Intelligence Score: 49 | |
| Day Percent Change: 1.18% Day Change: 0.07 | |
| Week Change: -2.76% Year-to-date Change: 13.0% | |
| APT Links: Profile News Message Board | |
| Charts:- Daily , Weekly | |
| Add APT to Watchlist: View: Get Complete APT Trend Analysis ➞ | |
 | SAND Sandstorm Gold Ltd. |
| Sector: Materials | |
| SubSector: Gold | |
| MarketCap: 808.119 Millions | |
| Recent Price: 5.64 Market Intelligence Score: 88 | |
| Day Percent Change: 1.16% Day Change: 0.06 | |
| Week Change: 0.27% Year-to-date Change: 12.2% | |
| SAND Links: Profile News Message Board | |
| Charts:- Daily , Weekly | |
| Add SAND to Watchlist: View: Get Complete SAND Trend Analysis ➞ | |
 | IMO Imperial Oil Limited |
| Sector: Energy | |
| SubSector: Major Integrated Oil & Gas | |
| MarketCap: 8171.25 Millions | |
| Recent Price: 68.16 Market Intelligence Score: 31 | |
| Day Percent Change: 1.14% Day Change: 0.77 | |
| Week Change: -3.59% Year-to-date Change: 19.2% | |
| IMO Links: Profile News Message Board | |
| Charts:- Daily , Weekly | |
| Add IMO to Watchlist: View: Get Complete IMO Trend Analysis ➞ | |
 | EXK Endeavour Silver Corp. |
| Sector: Materials | |
| SubSector: Silver | |
| MarketCap: 204.456 Millions | |
| Recent Price: 2.70 Market Intelligence Score: 46 | |
| Day Percent Change: 1.12% Day Change: 0.03 | |
| Week Change: -2.88% Year-to-date Change: 37.1% | |
| EXK Links: Profile News Message Board | |
| Charts:- Daily , Weekly | |
| Add EXK to Watchlist: View: Get Complete EXK Trend Analysis ➞ | |
 | ERF Enerplus Corporation |
| Sector: Energy | |
| SubSector: Oil & Gas Drilling & Exploration | |
| MarketCap: 372.639 Millions | |
| Recent Price: 19.55 Market Intelligence Score: 53 | |
| Day Percent Change: 1.11% Day Change: 0.22 | |
| Week Change: -4.71% Year-to-date Change: 27.4% | |
| ERF Links: Profile News Message Board | |
| Charts:- Daily , Weekly | |
| Add ERF to Watchlist: View: Get Complete ERF Trend Analysis ➞ | |
 | SU Suncor Energy Inc. |
| Sector: Energy | |
| SubSector: Independent Oil & Gas | |
| MarketCap: 21550.6 Millions | |
| Recent Price: 38.06 Market Intelligence Score: 58 | |
| Day Percent Change: 1.09% Day Change: 0.41 | |
| Week Change: -3.43% Year-to-date Change: 18.8% | |
| SU Links: Profile News Message Board | |
| Charts:- Daily , Weekly | |
| Add SU to Watchlist: View: Get Complete SU Trend Analysis ➞ | |
 | AUPH Aurinia Pharmaceuticals Inc. |
| Sector: Health Care | |
| SubSector: Biotechnology | |
| MarketCap: 1319.75 Millions | |
| Recent Price: 5.25 Market Intelligence Score: 74 | |
| Day Percent Change: 1.06% Day Change: 0.05 | |
| Week Change: 7.03% Year-to-date Change: -41.6% | |
| AUPH Links: Profile News Message Board | |
| Charts:- Daily , Weekly | |
| Add AUPH to Watchlist: View: Get Complete AUPH Trend Analysis ➞ | |
 | IMAX IMAX Corporation |
| Sector: Services & Goods | |
| SubSector: Entertainment - Diversified | |
| MarketCap: 874.237 Millions | |
| Recent Price: 16.36 Market Intelligence Score: 25 | |
| Day Percent Change: 1.05% Day Change: 0.17 | |
| Week Change: -4.61% Year-to-date Change: 8.9% | |
| IMAX Links: Profile News Message Board | |
| Charts:- Daily , Weekly | |
| Add IMAX to Watchlist: View: Get Complete IMAX Trend Analysis ➞ | |
 | AG First Majestic Silver Corp. |
| Sector: Materials | |
| SubSector: Silver | |
| MarketCap: 1128.56 Millions | |
| Recent Price: 6.80 Market Intelligence Score: 53 | |
| Day Percent Change: 1.04% Day Change: 0.07 | |
| Week Change: -3.41% Year-to-date Change: 10.6% | |
| AG Links: Profile News Message Board | |
| Charts:- Daily , Weekly | |
| Add AG to Watchlist: View: Get Complete AG Trend Analysis ➞ | |
 | MERC Mercer International Inc. |
| Sector: Consumer Staples | |
| SubSector: Paper & Paper Products | |
| MarketCap: 509.003 Millions | |
| Recent Price: 10.35 Market Intelligence Score: 100 | |
| Day Percent Change: 1.03% Day Change: 0.11 | |
| Week Change: 2.94% Year-to-date Change: 9.1% | |
| MERC Links: Profile News Message Board | |
| Charts:- Daily , Weekly | |
| Add MERC to Watchlist: View: Get Complete MERC Trend Analysis ➞ | |
 | FSM Fortuna Silver Mines Inc. |
| Sector: Materials | |
| SubSector: Silver | |
| MarketCap: 362.256 Millions | |
| Recent Price: 4.74 Market Intelligence Score: 90 | |
| Day Percent Change: 0.96% Day Change: 0.04 | |
| Week Change: -0.73% Year-to-date Change: 22.7% | |
| FSM Links: Profile News Message Board | |
| Charts:- Daily , Weekly | |
| Add FSM to Watchlist: View: Get Complete FSM Trend Analysis ➞ | |
| To view more stocks, click on Next / Previous arrows or select different range: 0 - 25 , 25 - 50 , 50 - 75 , 75 - 100 , 100 - 125 , 125 - 150 | ||
| Click To Change The Sort Order: By Market Cap or Company Size Performance: Year-to-date, Week and Day | |
| Select Chart Type: | ||
 Best Stocks Today 12Stocks.com |
© 2024 12Stocks.com Terms & Conditions Privacy Contact Us
All Information Provided Only For Education And Not To Be Used For Investing or Trading. See Terms & Conditions


One More Thing ... Get Best Stocks Delivered Daily!
Never Ever Miss A Move With Our Top Ten Stocks Lists
Find Best Stocks In Any Market - Bull or Bear Market
Take A Peek At Our Top Ten Stocks Lists: Daily, Weekly, Year-to-Date & Top Trends
Find Best Stocks In Any Market - Bull or Bear Market
Take A Peek At Our Top Ten Stocks Lists: Daily, Weekly, Year-to-Date & Top Trends
Canada Stocks With Best Up Trends [0-bearish to 100-bullish]: Brookfield Renewable[100], Mercer [100], CAE [100], Algonquin Power[100], Tilray [95], Descartes Systems[95], New Gold[95], Algonquin Power[90], Fortuna Silver[90], Enbridge [88], Sandstorm Gold[88]
Best Canada Stocks Year-to-Date:
Aurora Cannabis[1416.17%], Fusion [123.49%], McEwen Mining[63.66%], D-Wave Quantum[57.28%], OrganiGram [51.91%], Hudbay Minerals[49.82%], IAMGOLD [45.06%], Gold Royalty[40.83%], Endeavour Silver[37.06%], New Gold[29.45%], Cronos [28.71%] Best Canada Stocks This Week:
Tilray [16.85%], Brookfield Renewable[12.42%], Repare [9.53%], Vision Marine[8.51%], Aurora Cannabis[7.76%], Aurinia [7.03%], OrganiGram [6.99%], Canadian Solar[6.2%], Zymeworks [5.69%], Xenon [5.2%], Denison Mines[4.93%] Best Canada Stocks Daily:
Vermilion Energy[6.26%], Repare [6.21%], Denison Mines[4.41%], Cameco [4.05%], OrganiGram [3.92%], Trilogy Metals[3.39%], Vision Marine[3.31%], CGI [3.25%], Tilray [2.97%], Brookfield Renewable[2.96%], Stantec [2.62%]