
 Login Sign Up


| |||||
 |  | ||||

| 12Stocks.com Market Intelligence |
Best Canada Stocks
|
|
| Quick Read: Top Canada Stocks By Performances & Trends: Daily, Weekly, Year-to-Date, Market Cap (Size) & Technical Trends | |||
| Best Canada Views: Quick Browse View, Summary & Slide Show | |||
| 12Stocks.com Canada Stocks Performances & Trends Daily | |||||||||
|
|  The overall market intelligence score is 90 (0-bearish to 100-bullish) which puts Canada index in short term bullish trend. The market intelligence score from previous trading session is 90 and an improvement of trend continues.
| ||||||||
Here are the market intelligence trend scores of the most requested Canada stocks at 12Stocks.com (click stock name for detailed review):
| ||||||||||||||||||||||||
| Scroll down this page for most comprehensive review of Canada stocks by performance, trends, technical analysis, charts, fund plays & more | ||||||||||||||||||||||||

| 12Stocks.com: Top Performing Canada Index Stocks | ||||||||||||||||||||||||||||||||||||||||||||||||
 The top performing Canada Index stocks year to date are
Now, more recently, over last week, the top performing Canada Index stocks on the move are


|
||||||||||||||||||||||||||||||||||||||||||||||||
| 12Stocks.com: Investing in Canada Index with Stocks | |
|
The following table helps investors and traders sort through current performance and trends (as measured by market intelligence score) of various
stocks in the Canada Index. Quick View: Move mouse or cursor over stock symbol (ticker) to view short-term technical chart and over stock name to view long term chart. Click on  to add stock symbol to your watchlist and to add stock symbol to your watchlist and  to view watchlist. Click on any ticker or stock name for detailed market intelligence report for that stock. to view watchlist. Click on any ticker or stock name for detailed market intelligence report for that stock. |
12Stocks.com Performance of Stocks in Canada Index
| Ticker | Stock Name | Watchlist | Category | Recent Price | Market Intelligence Score | Change % | YTD Change% |
| CORV | Correvio Pharma |   | Health Care | 3.49 | 80 | -0.29% | 0.00% |
| LMLP | UBS ETRACS | | Utilities | 44.13 | 80 | -0.61% | 0.00% |
| MAG | MAG Silver | | Materials | 24.47 | 80 | -1.17% | 74.10% |
| SMTS | Sierra Metals | | Materials | 0.29 | 80 | -2.66% | 0.00% |
| MPVD | Mountain Prove | | Materials | 10.23 | 80 | -4.39% | 0.00% |
| CRHM | CRH Medical | | Health Care | 18.50 | 80 | -6.04% | 0.00% |
| PCOM | Points | | Technology | 42.14 | 70 | 4.33% | 0.00% |
| CXRX | Concordia | | Health Care | 42.14 | 70 | 4.33% | 0.00% |
| LAC | Lithium Americas | | Materials | 2.89 | 70 | 3.58% | -5.56% |
| ASTL | Algoma Steel | | Materials | 5.13 | 70 | 3.01% | -46.26% |
| NXE | NexGen Energy | | Energy | 7.80 | 70 | 2.63% | 7.00% |
| BB | BlackBerry | | Technology | 3.88 | 70 | 2.11% | 1.57% |
| AUY | Yamana Gold | | Materials | 42.46 | 70 | 1.77% | 0.00% |
| SNDL | SNDL | | Consumer Staples | 2.48 | 70 | 1.64% | 30.53% |
| RFP | Resolute Forest | | Consumer Staples | 47.23 | 70 | 1.46% | 0.00% |
| MERC | Mercer | | Materials | 3.23 | 70 | 1.25% | -47.75% |
| BCE | BCE | | Technology | 24.72 | 70 | 1.02% | 10.93% |
| GIL | Gildan Activewear | | Services & Goods | 55.50 | 70 | 0.78% | 19.84% |
| APT | Alpha Tech | | Industrials | 4.89 | 70 | 0.73% | -9.19% |
| SWIR | Sierra Wireless | | Technology | 62.28 | 70 | 0.44% | 0.00% |
| ENB | Enbridge | | Energy | 48.26 | 70 | 0.21% | 15.69% |
| NYMX | Nymox Pharmaceutical | | Health Care | 44.30 | 70 | 0.16% | 0.00% |
| CIO | City Office | | Financials | 6.94 | 70 | -0.14% | 35.50% |
| CP | Canadian Pacific | | Industrials | 76.63 | 70 | -0.17% | 4.42% |
| AXU | Alexco Resource | | Materials | 3.52 | 70 | -0.56% | 0.00% |
| To view more stocks, click on Next / Previous arrows or select different range: 0 - 25 , 25 - 50 , 50 - 75 , 75 - 100 , 100 - 125 , 125 - 150 , 150 - 175 , 175 - 200 , 200 - 225 , 225 - 250 | ||
 | Click To Change The Sort Order: By Market Cap or Company Size Performance: Year-to-date, Week and Day |  |
| Detailed Overview Of Canada Stocks |
| Canada Technical Overview, Leaders & Laggards, Top Canada ETF Funds & Detailed Canada Stocks List, Charts, Trends & More |
| Canada: Technical Analysis, Trends & YTD Performance | |
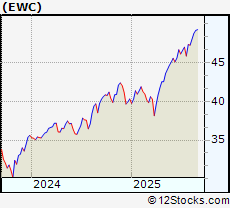
 EWC Weekly Chart |
|
| Long Term Trend: Very Good | |
| Medium Term Trend: Good | |
 EWC Daily Chart |
|
| Short Term Trend: Good | |
| Overall Trend Score: 90 | |
| YTD Performance: 22.6769% | |
| **Trend Scores & Views Are Only For Educational Purposes And Not For Investing | |
| 12Stocks.com: Investing in Canada Index using Exchange Traded Funds | |
|
The following table shows list of key exchange traded funds (ETF) that
help investors play Canada stock market. For detailed view, check out our ETF Funds section of our website. Quick View: Move mouse or cursor over ETF symbol (ticker) to view short-term technical chart and over ETF name to view long term chart. Click on ticker or stock name for detailed view. Click on to add stock symbol to your watchlist and to view watchlist. |
12Stocks.com List of ETFs that track Canada Index
| Ticker | ETF Name | Watchlist | Recent Price | Market Intelligence Score | Change % | Week % | Year-to-date % |
| FCAN | Canada AlphaDEX | | 93.12 | 70 | -0.608389 | 10.3841 | 0% |
| QCAN | Canada StrategicFactors | | 59.03 | 10 | 0 | 0 | 0% |
| 12Stocks.com: Charts, Trends, Fundamental Data and Performances of Canada Stocks | |
|
We now take in-depth look at all Canada stocks including charts, multi-period performances and overall trends (as measured by market intelligence score). One can sort Canada stocks (click link to choose) by Daily, Weekly and by Year-to-Date performances. Also, one can sort by size of the company or by market capitalization. |
| Select Your Default Chart Type: | |||||
| |||||
| Click on stock symbol or name for detailed view. Click on to add stock symbol to your watchlist and to view watchlist. Quick View: Move mouse or cursor over "Daily" to quickly view daily technical stock chart and over "Weekly" to view weekly technical stock chart. | |||||

 | CORV Correvio Pharma Corp. |
| Sector: Health Care | |
| SubSector: Drug Manufacturers - Other | |
| MarketCap: 20.5033 Millions | |
| Recent Price: 3.49 Market Intelligence Score: 80 | |
| Day Percent Change: -0.285714% Day Change: -9999 | |
| Week Change: 85.6383% Year-to-date Change: 0.0% | |
| CORV Links: Profile News Message Board | |
| Charts:- Daily , Weekly | |
| Add CORV to Watchlist: View: Get Complete CORV Trend Analysis ➞ | |
 | LMLP UBS ETRACS M Py 2xLvg WF MLP Ex-Engy ETN |
| Sector: Utilities | |
| SubSector: Exchange Traded Fund | |
| MarketCap: 0 Millions | |
| Recent Price: 44.13 Market Intelligence Score: 80 | |
| Day Percent Change: -0.608108% Day Change: -9999 | |
| Week Change: 117.068% Year-to-date Change: 0.0% | |
| LMLP Links: Profile News Message Board | |
| Charts:- Daily , Weekly | |
| Add LMLP to Watchlist: View: Get Complete LMLP Trend Analysis ➞ | |
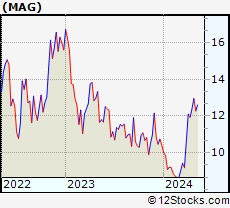 | MAG MAG Silver Corp |
| Sector: Materials | |
| SubSector: Silver | |
| MarketCap: 2536.56 Millions | |
| Recent Price: 24.47 Market Intelligence Score: 80 | |
| Day Percent Change: -1.17124% Day Change: 0.51 | |
| Week Change: 3.73039% Year-to-date Change: 74.1% | |
| MAG Links: Profile News Message Board | |
| Charts:- Daily , Weekly | |
| Add MAG to Watchlist: View: Get Complete MAG Trend Analysis ➞ | |
 | SMTS Sierra Metals Inc. |
| Sector: Materials | |
| SubSector: Industrial Metals & Minerals | |
| MarketCap: 124.91 Millions | |
| Recent Price: 0.29 Market Intelligence Score: 80 | |
| Day Percent Change: -2.65781% Day Change: -9999 | |
| Week Change: 67.4286% Year-to-date Change: 0.0% | |
| SMTS Links: Profile News Message Board | |
| Charts:- Daily , Weekly | |
| Add SMTS to Watchlist: View: Get Complete SMTS Trend Analysis ➞ | |
 | MPVD Mountain Province Diamonds Inc. |
| Sector: Materials | |
| SubSector: Industrial Metals & Minerals | |
| MarketCap: 581.66 Millions | |
| Recent Price: 10.23 Market Intelligence Score: 80 | |
| Day Percent Change: -4.39252% Day Change: -9999 | |
| Week Change: 22.6619% Year-to-date Change: 0.0% | |
| MPVD Links: Profile News Message Board | |
| Charts:- Daily , Weekly | |
| Add MPVD to Watchlist: View: Get Complete MPVD Trend Analysis ➞ | |
 | CRHM CRH Medical Corporation |
| Sector: Health Care | |
| SubSector: Medical Instruments & Supplies | |
| MarketCap: 80.286 Millions | |
| Recent Price: 18.50 Market Intelligence Score: 80 | |
| Day Percent Change: -6.04368% Day Change: -9999 | |
| Week Change: 363.659% Year-to-date Change: 0.0% | |
| CRHM Links: Profile News Message Board | |
| Charts:- Daily , Weekly | |
| Add CRHM to Watchlist: View: Get Complete CRHM Trend Analysis ➞ | |
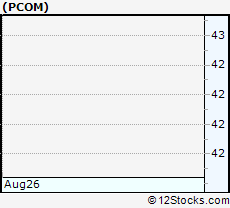 | PCOM Points International Ltd. |
| Sector: Technology | |
| SubSector: Internet Information Providers | |
| MarketCap: 111.98 Millions | |
| Recent Price: 42.14 Market Intelligence Score: 70 | |
| Day Percent Change: 4.33276% Day Change: -9999 | |
| Week Change: 68.6274% Year-to-date Change: 0.0% | |
| PCOM Links: Profile News Message Board | |
| Charts:- Daily , Weekly | |
| Add PCOM to Watchlist: View: Get Complete PCOM Trend Analysis ➞ | |
 | CXRX Concordia International Corp. |
| Sector: Health Care | |
| SubSector: Biotechnology | |
| MarketCap: 101.01 Millions | |
| Recent Price: 42.14 Market Intelligence Score: 70 | |
| Day Percent Change: 4.33276% Day Change: -9999 | |
| Week Change: 283.789% Year-to-date Change: 0.0% | |
| CXRX Links: Profile News Message Board | |
| Charts:- Daily , Weekly | |
| Add CXRX to Watchlist: View: Get Complete CXRX Trend Analysis ➞ | |
 | LAC Lithium Americas Corp (NewCo) |
| Sector: Materials | |
| SubSector: Other Industrial Metals & Mining | |
| MarketCap: 645.42 Millions | |
| Recent Price: 2.89 Market Intelligence Score: 70 | |
| Day Percent Change: 3.58423% Day Change: 0.02 | |
| Week Change: -3.02013% Year-to-date Change: -5.6% | |
| LAC Links: Profile News Message Board | |
| Charts:- Daily , Weekly | |
| Add LAC to Watchlist: View: Get Complete LAC Trend Analysis ➞ | |
 | ASTL Algoma Steel Group Inc |
| Sector: Materials | |
| SubSector: Steel | |
| MarketCap: 538.29 Millions | |
| Recent Price: 5.13 Market Intelligence Score: 70 | |
| Day Percent Change: 3.01205% Day Change: 0.22 | |
| Week Change: 4.0568% Year-to-date Change: -46.3% | |
| ASTL Links: Profile News Message Board | |
| Charts:- Daily , Weekly | |
| Add ASTL to Watchlist: View: Get Complete ASTL Trend Analysis ➞ | |
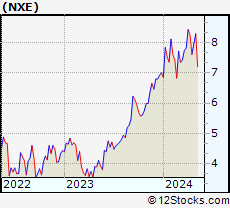 | NXE NexGen Energy Ltd |
| Sector: Energy | |
| SubSector: Uranium | |
| MarketCap: 4455.52 Millions | |
| Recent Price: 7.80 Market Intelligence Score: 70 | |
| Day Percent Change: 2.63158% Day Change: 0.13 | |
| Week Change: 7.73481% Year-to-date Change: 7.0% | |
| NXE Links: Profile News Message Board | |
| Charts:- Daily , Weekly | |
| Add NXE to Watchlist: View: Get Complete NXE Trend Analysis ➞ | |
 | BB BlackBerry Ltd |
| Sector: Technology | |
| SubSector: Software - Infrastructure | |
| MarketCap: 2306.78 Millions | |
| Recent Price: 3.88 Market Intelligence Score: 70 | |
| Day Percent Change: 2.10526% Day Change: 0 | |
| Week Change: 0.779221% Year-to-date Change: 1.6% | |
| BB Links: Profile News Message Board | |
| Charts:- Daily , Weekly | |
| Add BB to Watchlist: View: Get Complete BB Trend Analysis ➞ | |
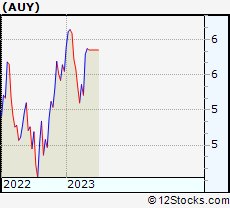 | AUY Yamana Gold Inc. |
| Sector: Materials | |
| SubSector: Gold | |
| MarketCap: 2786.49 Millions | |
| Recent Price: 42.46 Market Intelligence Score: 70 | |
| Day Percent Change: 1.77373% Day Change: -9999 | |
| Week Change: 625.812% Year-to-date Change: 0.0% | |
| AUY Links: Profile News Message Board | |
| Charts:- Daily , Weekly | |
| Add AUY to Watchlist: View: Get Complete AUY Trend Analysis ➞ | |
 | SNDL SNDL Inc |
| Sector: Consumer Staples | |
| SubSector: Beverages - Wineries & Distilleries | |
| MarketCap: 638.35 Millions | |
| Recent Price: 2.48 Market Intelligence Score: 70 | |
| Day Percent Change: 1.63934% Day Change: 0.03 | |
| Week Change: -1.97628% Year-to-date Change: 30.5% | |
| SNDL Links: Profile News Message Board | |
| Charts:- Daily , Weekly | |
| Add SNDL to Watchlist: View: Get Complete SNDL Trend Analysis ➞ | |
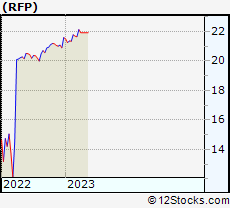 | RFP Resolute Forest Products Inc. |
| Sector: Consumer Staples | |
| SubSector: Paper & Paper Products | |
| MarketCap: 129.303 Millions | |
| Recent Price: 47.23 Market Intelligence Score: 70 | |
| Day Percent Change: 1.46079% Day Change: -9999 | |
| Week Change: 115.465% Year-to-date Change: 0.0% | |
| RFP Links: Profile News Message Board | |
| Charts:- Daily , Weekly | |
| Add RFP to Watchlist: View: Get Complete RFP Trend Analysis ➞ | |
 | MERC Mercer International Inc |
| Sector: Materials | |
| SubSector: Paper & Paper Products | |
| MarketCap: 216.35 Millions | |
| Recent Price: 3.23 Market Intelligence Score: 70 | |
| Day Percent Change: 1.25392% Day Change: 0.06 | |
| Week Change: -0.615385% Year-to-date Change: -47.8% | |
| MERC Links: Profile News Message Board | |
| Charts:- Daily , Weekly | |
| Add MERC to Watchlist: View: Get Complete MERC Trend Analysis ➞ | |
 | BCE BCE Inc |
| Sector: Technology | |
| SubSector: Telecom Services | |
| MarketCap: 22787.6 Millions | |
| Recent Price: 24.72 Market Intelligence Score: 70 | |
| Day Percent Change: 1.02166% Day Change: -0.02 | |
| Week Change: -1.04083% Year-to-date Change: 10.9% | |
| BCE Links: Profile News Message Board | |
| Charts:- Daily , Weekly | |
| Add BCE to Watchlist: View: Get Complete BCE Trend Analysis ➞ | |
 | GIL Gildan Activewear Inc |
| Sector: Services & Goods | |
| SubSector: Apparel Manufacturing | |
| MarketCap: 8272.83 Millions | |
| Recent Price: 55.50 Market Intelligence Score: 70 | |
| Day Percent Change: 0.780824% Day Change: -0.39 | |
| Week Change: 0.216685% Year-to-date Change: 19.8% | |
| GIL Links: Profile News Message Board | |
| Charts:- Daily , Weekly | |
| Add GIL to Watchlist: View: Get Complete GIL Trend Analysis ➞ | |
 | APT Alpha Pro Tech Ltd |
| Sector: Industrials | |
| SubSector: Building Products & Equipment | |
| MarketCap: 51.17 Millions | |
| Recent Price: 4.89 Market Intelligence Score: 70 | |
| Day Percent Change: 0.734021% Day Change: 0 | |
| Week Change: 0.734021% Year-to-date Change: -9.2% | |
| APT Links: Profile News Message Board | |
| Charts:- Daily , Weekly | |
| Add APT to Watchlist: View: Get Complete APT Trend Analysis ➞ | |
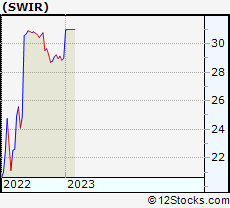 | SWIR Sierra Wireless, Inc. |
| Sector: Technology | |
| SubSector: Communication Equipment | |
| MarketCap: 212.639 Millions | |
| Recent Price: 62.28 Market Intelligence Score: 70 | |
| Day Percent Change: 0.435414% Day Change: -9999 | |
| Week Change: 100.968% Year-to-date Change: 0.0% | |
| SWIR Links: Profile News Message Board | |
| Charts:- Daily , Weekly | |
| Add SWIR to Watchlist: View: Get Complete SWIR Trend Analysis ➞ | |
 | ENB Enbridge Inc |
| Sector: Energy | |
| SubSector: Oil & Gas Midstream | |
| MarketCap: 105232 Millions | |
| Recent Price: 48.26 Market Intelligence Score: 70 | |
| Day Percent Change: 0.207641% Day Change: -0.09 | |
| Week Change: 1.36526% Year-to-date Change: 15.7% | |
| ENB Links: Profile News Message Board | |
| Charts:- Daily , Weekly | |
| Add ENB to Watchlist: View: Get Complete ENB Trend Analysis ➞ | |
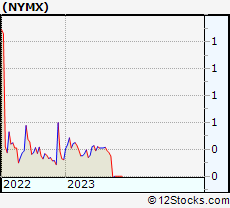 | NYMX Nymox Pharmaceutical Corporation |
| Sector: Health Care | |
| SubSector: Biotechnology | |
| MarketCap: 143.585 Millions | |
| Recent Price: 44.30 Market Intelligence Score: 70 | |
| Day Percent Change: 0.158264% Day Change: -9999 | |
| Week Change: 8258.49% Year-to-date Change: 0.0% | |
| NYMX Links: Profile News Message Board | |
| Charts:- Daily , Weekly | |
| Add NYMX to Watchlist: View: Get Complete NYMX Trend Analysis ➞ | |
 | CIO City Office REIT Inc |
| Sector: Financials | |
| SubSector: REIT - Office | |
| MarketCap: 280.12 Millions | |
| Recent Price: 6.94 Market Intelligence Score: 70 | |
| Day Percent Change: -0.143885% Day Change: 0 | |
| Week Change: -0.143885% Year-to-date Change: 35.5% | |
| CIO Links: Profile News Message Board | |
| Charts:- Daily , Weekly | |
| Add CIO to Watchlist: View: Get Complete CIO Trend Analysis ➞ | |
 | CP Canadian Pacific Kansas City Limited |
| Sector: Industrials | |
| SubSector: Railroads | |
| MarketCap: 70344.8 Millions | |
| Recent Price: 76.63 Market Intelligence Score: 70 | |
| Day Percent Change: -0.169359% Day Change: -1.06 | |
| Week Change: -0.299245% Year-to-date Change: 4.4% | |
| CP Links: Profile News Message Board | |
| Charts:- Daily , Weekly | |
| Add CP to Watchlist: View: Get Complete CP Trend Analysis ➞ | |
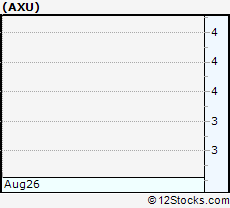 | AXU Alexco Resource Corp. |
| Sector: Materials | |
| SubSector: Industrial Metals & Minerals | |
| MarketCap: 230.41 Millions | |
| Recent Price: 3.52 Market Intelligence Score: 70 | |
| Day Percent Change: -0.564972% Day Change: -9999 | |
| Week Change: 690.301% Year-to-date Change: 0.0% | |
| AXU Links: Profile News Message Board | |
| Charts:- Daily , Weekly | |
| Add AXU to Watchlist: View: Get Complete AXU Trend Analysis ➞ | |
| To view more stocks, click on Next / Previous arrows or select different range: 0 - 25 , 25 - 50 , 50 - 75 , 75 - 100 , 100 - 125 , 125 - 150 , 150 - 175 , 175 - 200 , 200 - 225 , 225 - 250 | ||
| Click To Change The Sort Order: By Market Cap or Company Size Performance: Year-to-date, Week and Day | |
| Select Chart Type: | ||
 Best Stocks Today 12Stocks.com |
© 2025 12Stocks.com Terms & Conditions Privacy Contact Us
All Information Provided Only For Education And Not To Be Used For Investing or Trading. See Terms & Conditions


One More Thing ... Get Best Stocks Delivered Daily!
Never Ever Miss A Move With Our Top Ten Stocks Lists
Find Best Stocks In Any Market - Bull or Bear Market
Take A Peek At Our Top Ten Stocks Lists: Daily, Weekly, Year-to-Date & Top Trends
Find Best Stocks In Any Market - Bull or Bear Market
Take A Peek At Our Top Ten Stocks Lists: Daily, Weekly, Year-to-Date & Top Trends
Canada Stocks With Best Up Trends [0-bearish to 100-bullish]: Celestica [100], Equinox Gold[100], Gold Royalty[100], EMX Royalty[100], Iamgold Corp[100], Trilogy Metals[100], Barrick Mining[100], Methanex Corp[100], Eldorado Gold[100], Turquo Hill[100], Denison Mines[100]
Best Canada Stocks Year-to-Date:
Americas Gold[605.128%], Avino Silver[339.322%], Gold Royalty[209.677%], Tower Hill[199.363%], Celestica [160.75%], New Gold[140.458%], EMX Royalty[133.908%], Kinross Gold[124.846%], Sandstorm Gold[102.209%], Agnico Eagle[86.6197%], OR Royalties[85.4636%] Best Canada Stocks This Week:
Crescent Point[4066.17%], Golden Star[1837.95%], Alexco Resource[690.301%], Yamana Gold[625.812%], Novelion [579.167%], Turquo Hill[433.11%], Enerplus [415.601%], Nevsun Resources[402.516%], Bellatrix Exploration[291.621%], Domtar [250.297%], Trillium [203.688%] Best Canada Stocks Daily:
Canadian Solar[15.036%], Celestica [9.64128%], Equinox Gold[9.0301%], Ballard Power[7.56757%], Novelion [7.37813%], Gold Royalty[6.66667%], EMX Royalty[6.5445%], Canopy Growth[5.7971%], Iamgold Corp[4.75687%], Teck Resources[4.69942%], Trilogy Metals[4.54545%]