
 Login Sign Up


| |||||
 |  | ||||

| 12Stocks.com Market Intelligence |
Best Canada Stocks
|
|
| Quick Read: Top Canada Stocks By Performances & Trends: Daily, Weekly, Year-to-Date, Market Cap (Size) & Technical Trends | |||
| Best Canada Views: Quick Browse View, Summary & Slide Show | |||
| 12Stocks.com Canada Stocks Performances & Trends Daily | |||||||||
|
|  The overall market intelligence score is 90 (0-bearish to 100-bullish) which puts Canada index in short term bullish trend. The market intelligence score from previous trading session is 90 and an improvement of trend continues.
| ||||||||
Here are the market intelligence trend scores of the most requested Canada stocks at 12Stocks.com (click stock name for detailed review):
| ||||||||||||||||||||||||
| Scroll down this page for most comprehensive review of Canada stocks by performance, trends, technical analysis, charts, fund plays & more | ||||||||||||||||||||||||

| 12Stocks.com: Top Performing Canada Index Stocks | ||||||||||||||||||||||||||||||||||||||||||||||||
 The top performing Canada Index stocks year to date are
Now, more recently, over last week, the top performing Canada Index stocks on the move are


|
||||||||||||||||||||||||||||||||||||||||||||||||
| 12Stocks.com: Investing in Canada Index with Stocks | |
|
The following table helps investors and traders sort through current performance and trends (as measured by market intelligence score) of various
stocks in the Canada Index. Quick View: Move mouse or cursor over stock symbol (ticker) to view short-term technical chart and over stock name to view long term chart. Click on  to add stock symbol to your watchlist and to add stock symbol to your watchlist and  to view watchlist. Click on any ticker or stock name for detailed market intelligence report for that stock. to view watchlist. Click on any ticker or stock name for detailed market intelligence report for that stock. |
12Stocks.com Performance of Stocks in Canada Index
| Ticker | Stock Name | Watchlist | Category | Recent Price | Market Intelligence Score | Change % | YTD Change% |
| BMO | Bank of Montreal |   | Financials | 126.10 | 100 | 0.73% | 34.35% |
| DOOO | BRP | | Services & Goods | 65.50 | 80 | 0.12% | 31.60% |
| SNDL | SNDL | | Consumer Staples | 2.48 | 70 | 1.64% | 30.53% |
| EDSA | Edesa Biotech | | Health Care | 2.45 | 90 | 5.60% | 28.57% |
| TRX | TRX Gold | | Materials | 0.40 | 100 | 0.65% | 28.23% |
| RPTX | Repare | | Health Care | 1.69 | 50 | 0.00% | 28.03% |
| AQN | Algonquin Power | | Utilities | 5.67 | 20 | 0.53% | 27.92% |
| CM | Canadian Imperial | | Financials | 78.32 | 70 | -1.04% | 27.56% |
| NTR | Nutrien | | Materials | 56.43 | 0 | -0.97% | 27.19% |
| TU | Telus Corp | | Technology | 16.57 | 60 | 0.91% | 26.06% |
| NAK | Northern Dynasty | | Materials | 0.84 | 10 | -1.10% | 24.26% |
| RY | Royal Bank | | Financials | 144.49 | 60 | -0.91% | 23.89% |
| BNS | Bank Of | | Financials | 63.44 | 90 | -0.17% | 23.63% |
| CIGI | Colliers | | Financials | 165.86 | 80 | 0.27% | 23.58% |
| PLG | Platinum | | Materials | 1.66 | 60 | 2.47% | 22.96% |
| CRON | Cronos | | Health Care | 2.50 | 40 | 0.00% | 21.36% |
| RCI | | Technology | 35.89 | 90 | 0.84% | 21.26% | |
| FTS | Fortis | | Utilities | 49.23 | 10 | -0.91% | 21.26% |
| OTEX | Open Text | | Technology | 33.23 | 90 | -0.72% | 19.94% |
| GIL | Gildan Activewear | | Services & Goods | 55.50 | 70 | 0.78% | 19.84% |
| IMAX | Imax Corp | | Technology | 29.78 | 90 | 1.95% | 18.60% |
| SILV | SilverCrest Metals | | Materials | 11.55 | 60 | -0.86% | 17.74% |
| BBU | Brookfield Business | | Industrials | 27.35 | 80 | 0.11% | 16.04% |
| ENB | Enbridge | | Energy | 48.26 | 70 | 0.21% | 15.69% |
| MGA | Magna | | Services & Goods | 45.88 | 80 | 1.17% | 14.22% |
| To view more stocks, click on Next / Previous arrows or select different range: 0 - 25 , 25 - 50 , 50 - 75 , 75 - 100 , 100 - 125 , 125 - 150 , 150 - 175 , 175 - 200 , 200 - 225 , 225 - 250 | ||
 | Click To Change The Sort Order: By Market Cap or Company Size Performance: Year-to-date, Week and Day |  |
| Detailed Overview Of Canada Stocks |
| Canada Technical Overview, Leaders & Laggards, Top Canada ETF Funds & Detailed Canada Stocks List, Charts, Trends & More |
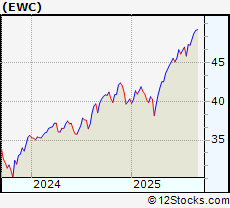
| Canada: Technical Analysis, Trends & YTD Performance | |
 EWC Weekly Chart |
|
| Long Term Trend: Very Good | |
| Medium Term Trend: Good | |
 EWC Daily Chart |
|
| Short Term Trend: Good | |
| Overall Trend Score: 90 | |
| YTD Performance: 22.6769% | |
| **Trend Scores & Views Are Only For Educational Purposes And Not For Investing | |
| 12Stocks.com: Investing in Canada Index using Exchange Traded Funds | |
|
The following table shows list of key exchange traded funds (ETF) that
help investors play Canada stock market. For detailed view, check out our ETF Funds section of our website. Quick View: Move mouse or cursor over ETF symbol (ticker) to view short-term technical chart and over ETF name to view long term chart. Click on ticker or stock name for detailed view. Click on to add stock symbol to your watchlist and to view watchlist. |
12Stocks.com List of ETFs that track Canada Index
| Ticker | ETF Name | Watchlist | Recent Price | Market Intelligence Score | Change % | Week % | Year-to-date % |
| FCAN | Canada AlphaDEX | | 93.12 | 70 | -0.608389 | 10.3841 | 0% |
| QCAN | Canada StrategicFactors | | 59.03 | 10 | 0 | 0 | 0% |
| 12Stocks.com: Charts, Trends, Fundamental Data and Performances of Canada Stocks | |
|
We now take in-depth look at all Canada stocks including charts, multi-period performances and overall trends (as measured by market intelligence score). One can sort Canada stocks (click link to choose) by Daily, Weekly and by Year-to-Date performances. Also, one can sort by size of the company or by market capitalization. |
| Select Your Default Chart Type: | |||||
| |||||
| Click on stock symbol or name for detailed view. Click on to add stock symbol to your watchlist and to view watchlist. Quick View: Move mouse or cursor over "Daily" to quickly view daily technical stock chart and over "Weekly" to view weekly technical stock chart. | |||||

 | GOOS Canada Goose Holdings Inc |
| Sector: Services & Goods | |
| SubSector: Apparel Manufacturing | |
| MarketCap: 1299.77 Millions | |
| Recent Price: 13.39 Market Intelligence Score: 80 | |
| Day Percent Change: 2.05793% Day Change: -0.07 | |
| Week Change: -5.3041% Year-to-date Change: 34.8% | |
| GOOS Links: Profile News Message Board | |
| Charts:- Daily , Weekly | |
| Add GOOS to Watchlist: View: Get Complete GOOS Trend Analysis ➞ | |
 | BMO Bank of Montreal |
| Sector: Financials | |
| SubSector: Banks - Diversified | |
| MarketCap: 91053 Millions | |
| Recent Price: 126.10 Market Intelligence Score: 100 | |
| Day Percent Change: 0.726895% Day Change: -0.19 | |
| Week Change: 5.86853% Year-to-date Change: 34.3% | |
| BMO Links: Profile News Message Board | |
| Charts:- Daily , Weekly | |
| Add BMO to Watchlist: View: Get Complete BMO Trend Analysis ➞ | |
 | DOOO BRP Inc |
| Sector: Services & Goods | |
| SubSector: Recreational Vehicles | |
| MarketCap: 4783.47 Millions | |
| Recent Price: 65.50 Market Intelligence Score: 80 | |
| Day Percent Change: 0.122287% Day Change: -1.05 | |
| Week Change: 14.8518% Year-to-date Change: 31.6% | |
| DOOO Links: Profile News Message Board | |
| Charts:- Daily , Weekly | |
| Add DOOO to Watchlist: View: Get Complete DOOO Trend Analysis ➞ | |
 | SNDL SNDL Inc |
| Sector: Consumer Staples | |
| SubSector: Beverages - Wineries & Distilleries | |
| MarketCap: 638.35 Millions | |
| Recent Price: 2.48 Market Intelligence Score: 70 | |
| Day Percent Change: 1.63934% Day Change: 0.03 | |
| Week Change: -1.97628% Year-to-date Change: 30.5% | |
| SNDL Links: Profile News Message Board | |
| Charts:- Daily , Weekly | |
| Add SNDL to Watchlist: View: Get Complete SNDL Trend Analysis ➞ | |
 | EDSA Edesa Biotech Inc |
| Sector: Health Care | |
| SubSector: Biotechnology | |
| MarketCap: 17.81 Millions | |
| Recent Price: 2.45 Market Intelligence Score: 90 | |
| Day Percent Change: 5.60345% Day Change: 0.02 | |
| Week Change: 5.60345% Year-to-date Change: 28.6% | |
| EDSA Links: Profile News Message Board | |
| Charts:- Daily , Weekly | |
| Add EDSA to Watchlist: View: Get Complete EDSA Trend Analysis ➞ | |
 | TRX TRX Gold Corp |
| Sector: Materials | |
| SubSector: Gold | |
| MarketCap: 114.48 Millions | |
| Recent Price: 0.40 Market Intelligence Score: 100 | |
| Day Percent Change: 0.646605% Day Change: 0.01 | |
| Week Change: 13.4249% Year-to-date Change: 28.2% | |
| TRX Links: Profile News Message Board | |
| Charts:- Daily , Weekly | |
| Add TRX to Watchlist: View: Get Complete TRX Trend Analysis ➞ | |
 | RPTX Repare Therapeutics Inc |
| Sector: Health Care | |
| SubSector: Biotechnology | |
| MarketCap: 72.6 Millions | |
| Recent Price: 1.69 Market Intelligence Score: 50 | |
| Day Percent Change: 0% Day Change: 0.01 | |
| Week Change: 2.42424% Year-to-date Change: 28.0% | |
| RPTX Links: Profile News Message Board | |
| Charts:- Daily , Weekly | |
| Add RPTX to Watchlist: View: Get Complete RPTX Trend Analysis ➞ | |
 | AQN Algonquin Power & Utilities Corp |
| Sector: Utilities | |
| SubSector: Utilities - Diversified | |
| MarketCap: 4485.08 Millions | |
| Recent Price: 5.67 Market Intelligence Score: 20 | |
| Day Percent Change: 0.531915% Day Change: -0.02 | |
| Week Change: -2.40964% Year-to-date Change: 27.9% | |
| AQN Links: Profile News Message Board | |
| Charts:- Daily , Weekly | |
| Add AQN to Watchlist: View: Get Complete AQN Trend Analysis ➞ | |
 | CM Canadian Imperial Bank Of Commerce |
| Sector: Financials | |
| SubSector: Banks - Diversified | |
| MarketCap: 73165.8 Millions | |
| Recent Price: 78.32 Market Intelligence Score: 70 | |
| Day Percent Change: -1.03614% Day Change: -0.05 | |
| Week Change: 4.03826% Year-to-date Change: 27.6% | |
| CM Links: Profile News Message Board | |
| Charts:- Daily , Weekly | |
| Add CM to Watchlist: View: Get Complete CM Trend Analysis ➞ | |
 | NTR Nutrien Ltd |
| Sector: Materials | |
| SubSector: Agricultural Inputs | |
| MarketCap: 27509.1 Millions | |
| Recent Price: 56.43 Market Intelligence Score: 0 | |
| Day Percent Change: -0.965251% Day Change: 0.57 | |
| Week Change: -2.99123% Year-to-date Change: 27.2% | |
| NTR Links: Profile News Message Board | |
| Charts:- Daily , Weekly | |
| Add NTR to Watchlist: View: Get Complete NTR Trend Analysis ➞ | |
 | TU Telus Corp |
| Sector: Technology | |
| SubSector: Telecom Services | |
| MarketCap: 25269.2 Millions | |
| Recent Price: 16.57 Market Intelligence Score: 60 | |
| Day Percent Change: 0.91352% Day Change: 0 | |
| Week Change: 0.363416% Year-to-date Change: 26.1% | |
| TU Links: Profile News Message Board | |
| Charts:- Daily , Weekly | |
| Add TU to Watchlist: View: Get Complete TU Trend Analysis ➞ | |
 | NAK Northern Dynasty Minerals Ltd |
| Sector: Materials | |
| SubSector: Other Industrial Metals & Mining | |
| MarketCap: 455.23 Millions | |
| Recent Price: 0.84 Market Intelligence Score: 10 | |
| Day Percent Change: -1.10019% Day Change: 0.03 | |
| Week Change: -4.85306% Year-to-date Change: 24.3% | |
| NAK Links: Profile News Message Board | |
| Charts:- Daily , Weekly | |
| Add NAK to Watchlist: View: Get Complete NAK Trend Analysis ➞ | |
 | RY Royal Bank Of Canada |
| Sector: Financials | |
| SubSector: Banks - Diversified | |
| MarketCap: 203771 Millions | |
| Recent Price: 144.49 Market Intelligence Score: 60 | |
| Day Percent Change: -0.905288% Day Change: -0.29 | |
| Week Change: -0.530084% Year-to-date Change: 23.9% | |
| RY Links: Profile News Message Board | |
| Charts:- Daily , Weekly | |
| Add RY to Watchlist: View: Get Complete RY Trend Analysis ➞ | |
 | BNS Bank Of Nova Scotia |
| Sector: Financials | |
| SubSector: Banks - Diversified | |
| MarketCap: 79019 Millions | |
| Recent Price: 63.44 Market Intelligence Score: 90 | |
| Day Percent Change: -0.173092% Day Change: -0.1 | |
| Week Change: 3.30565% Year-to-date Change: 23.6% | |
| BNS Links: Profile News Message Board | |
| Charts:- Daily , Weekly | |
| Add BNS to Watchlist: View: Get Complete BNS Trend Analysis ➞ | |
 | CIGI Colliers International Group Inc |
| Sector: Financials | |
| SubSector: Real Estate Services | |
| MarketCap: 8395.83 Millions | |
| Recent Price: 165.86 Market Intelligence Score: 80 | |
| Day Percent Change: 0.26599% Day Change: 0.03 | |
| Week Change: -0.300553% Year-to-date Change: 23.6% | |
| CIGI Links: Profile News Message Board | |
| Charts:- Daily , Weekly | |
| Add CIGI to Watchlist: View: Get Complete CIGI Trend Analysis ➞ | |
 | PLG Platinum Group Metals Ltd |
| Sector: Materials | |
| SubSector: Other Precious Metals & Mining | |
| MarketCap: 186.17 Millions | |
| Recent Price: 1.66 Market Intelligence Score: 60 | |
| Day Percent Change: 2.46914% Day Change: 0.05 | |
| Week Change: 12.1622% Year-to-date Change: 23.0% | |
| PLG Links: Profile News Message Board | |
| Charts:- Daily , Weekly | |
| Add PLG to Watchlist: View: Get Complete PLG Trend Analysis ➞ | |
 | CRON Cronos Group Inc |
| Sector: Health Care | |
| SubSector: Drug Manufacturers - Specialty & Generic | |
| MarketCap: 957.35 Millions | |
| Recent Price: 2.50 Market Intelligence Score: 40 | |
| Day Percent Change: 0% Day Change: 0.14 | |
| Week Change: -2.34375% Year-to-date Change: 21.4% | |
| CRON Links: Profile News Message Board | |
| Charts:- Daily , Weekly | |
| Add CRON to Watchlist: View: Get Complete CRON Trend Analysis ➞ | |
 | RCI Rogers Communications Inc |
| Sector: Technology | |
| SubSector: Telecom Services | |
| MarketCap: 19388.8 Millions | |
| Recent Price: 35.89 Market Intelligence Score: 90 | |
| Day Percent Change: 0.842933% Day Change: 0.26 | |
| Week Change: 0.307434% Year-to-date Change: 21.3% | |
| RCI Links: Profile News Message Board | |
| Charts:- Daily , Weekly | |
| Add RCI to Watchlist: View: Get Complete RCI Trend Analysis ➞ | |
 | FTS Fortis Inc |
| Sector: Utilities | |
| SubSector: Utilities - Regulated Electric | |
| MarketCap: 24792.2 Millions | |
| Recent Price: 49.23 Market Intelligence Score: 10 | |
| Day Percent Change: -0.905797% Day Change: -0.08 | |
| Week Change: -1.61871% Year-to-date Change: 21.3% | |
| FTS Links: Profile News Message Board | |
| Charts:- Daily , Weekly | |
| Add FTS to Watchlist: View: Get Complete FTS Trend Analysis ➞ | |
 | OTEX Open Text Corp |
| Sector: Technology | |
| SubSector: Software - Application | |
| MarketCap: 8451.05 Millions | |
| Recent Price: 33.23 Market Intelligence Score: 90 | |
| Day Percent Change: -0.71706% Day Change: -0.11 | |
| Week Change: 0.69697% Year-to-date Change: 19.9% | |
| OTEX Links: Profile News Message Board | |
| Charts:- Daily , Weekly | |
| Add OTEX to Watchlist: View: Get Complete OTEX Trend Analysis ➞ | |
 | GIL Gildan Activewear Inc |
| Sector: Services & Goods | |
| SubSector: Apparel Manufacturing | |
| MarketCap: 8272.83 Millions | |
| Recent Price: 55.50 Market Intelligence Score: 70 | |
| Day Percent Change: 0.780824% Day Change: -0.39 | |
| Week Change: 0.216685% Year-to-date Change: 19.8% | |
| GIL Links: Profile News Message Board | |
| Charts:- Daily , Weekly | |
| Add GIL to Watchlist: View: Get Complete GIL Trend Analysis ➞ | |
 | IMAX Imax Corp |
| Sector: Technology | |
| SubSector: Entertainment | |
| MarketCap: 1601.64 Millions | |
| Recent Price: 29.78 Market Intelligence Score: 90 | |
| Day Percent Change: 1.95139% Day Change: 0.22 | |
| Week Change: 2.83149% Year-to-date Change: 18.6% | |
| IMAX Links: Profile News Message Board | |
| Charts:- Daily , Weekly | |
| Add IMAX to Watchlist: View: Get Complete IMAX Trend Analysis ➞ | |
 | SILV SilverCrest Metals Inc. |
| Sector: Materials | |
| SubSector: Silver | |
| MarketCap: 555.356 Millions | |
| Recent Price: 11.55 Market Intelligence Score: 60 | |
| Day Percent Change: -0.858369% Day Change: -9999 | |
| Week Change: 2.12202% Year-to-date Change: 17.7% | |
| SILV Links: Profile News Message Board | |
| Charts:- Daily , Weekly | |
| Add SILV to Watchlist: View: Get Complete SILV Trend Analysis ➞ | |
 | BBU Brookfield Business Partners L.P |
| Sector: Industrials | |
| SubSector: Conglomerates | |
| MarketCap: 2444.54 Millions | |
| Recent Price: 27.35 Market Intelligence Score: 80 | |
| Day Percent Change: 0.10981% Day Change: -0.17 | |
| Week Change: -2.56502% Year-to-date Change: 16.0% | |
| BBU Links: Profile News Message Board | |
| Charts:- Daily , Weekly | |
| Add BBU to Watchlist: View: Get Complete BBU Trend Analysis ➞ | |
 | ENB Enbridge Inc |
| Sector: Energy | |
| SubSector: Oil & Gas Midstream | |
| MarketCap: 105232 Millions | |
| Recent Price: 48.26 Market Intelligence Score: 70 | |
| Day Percent Change: 0.207641% Day Change: -0.09 | |
| Week Change: 1.36526% Year-to-date Change: 15.7% | |
| ENB Links: Profile News Message Board | |
| Charts:- Daily , Weekly | |
| Add ENB to Watchlist: View: Get Complete ENB Trend Analysis ➞ | |
| To view more stocks, click on Next / Previous arrows or select different range: 0 - 25 , 25 - 50 , 50 - 75 , 75 - 100 , 100 - 125 , 125 - 150 , 150 - 175 , 175 - 200 , 200 - 225 , 225 - 250 | ||
| Click To Change The Sort Order: By Market Cap or Company Size Performance: Year-to-date, Week and Day | |
| Select Chart Type: | ||
 Best Stocks Today 12Stocks.com |
© 2025 12Stocks.com Terms & Conditions Privacy Contact Us
All Information Provided Only For Education And Not To Be Used For Investing or Trading. See Terms & Conditions


One More Thing ... Get Best Stocks Delivered Daily!
Never Ever Miss A Move With Our Top Ten Stocks Lists
Find Best Stocks In Any Market - Bull or Bear Market
Take A Peek At Our Top Ten Stocks Lists: Daily, Weekly, Year-to-Date & Top Trends
Find Best Stocks In Any Market - Bull or Bear Market
Take A Peek At Our Top Ten Stocks Lists: Daily, Weekly, Year-to-Date & Top Trends
Canada Stocks With Best Up Trends [0-bearish to 100-bullish]: Celestica [100], Equinox Gold[100], Gold Royalty[100], EMX Royalty[100], Iamgold Corp[100], Trilogy Metals[100], Barrick Mining[100], Methanex Corp[100], Eldorado Gold[100], Turquo Hill[100], Denison Mines[100]
Best Canada Stocks Year-to-Date:
Americas Gold[605.128%], Avino Silver[339.322%], Gold Royalty[209.677%], Tower Hill[199.363%], Celestica [160.75%], New Gold[140.458%], EMX Royalty[133.908%], Kinross Gold[124.846%], Sandstorm Gold[102.209%], Agnico Eagle[86.6197%], OR Royalties[85.4636%] Best Canada Stocks This Week:
Crescent Point[4066.17%], Golden Star[1837.95%], Alexco Resource[690.301%], Yamana Gold[625.812%], Novelion [579.167%], Turquo Hill[433.11%], Enerplus [415.601%], Nevsun Resources[402.516%], Bellatrix Exploration[291.621%], Domtar [250.297%], Trillium [203.688%] Best Canada Stocks Daily:
Canadian Solar[15.036%], Celestica [9.64128%], Equinox Gold[9.0301%], Ballard Power[7.56757%], Novelion [7.37813%], Gold Royalty[6.66667%], EMX Royalty[6.5445%], Canopy Growth[5.7971%], Iamgold Corp[4.75687%], Teck Resources[4.69942%], Trilogy Metals[4.54545%]