
 Login Sign Up


| |||||
 |  | ||||

| 12Stocks.com Market Intelligence |
Best Canada Stocks
|
|
| Quick Read: Top Canada Stocks By Performances & Trends: Daily, Weekly, Year-to-Date, Market Cap (Size) & Technical Trends | |||
| Best Canada Views: Quick Browse View, Summary & Slide Show | |||
| 12Stocks.com Canada Stocks Performances & Trends Daily | |||||||||
|
|  The overall market intelligence score is 90 (0-bearish to 100-bullish) which puts Canada index in short term bullish trend. The market intelligence score from previous trading session is 90 and an improvement of trend continues.
| ||||||||
Here are the market intelligence trend scores of the most requested Canada stocks at 12Stocks.com (click stock name for detailed review):
| ||||||||||||||||||||||||
| Scroll down this page for most comprehensive review of Canada stocks by performance, trends, technical analysis, charts, fund plays & more | ||||||||||||||||||||||||

| 12Stocks.com: Top Performing Canada Index Stocks | ||||||||||||||||||||||||||||||||||||||||||||||||
 The top performing Canada Index stocks year to date are
Now, more recently, over last week, the top performing Canada Index stocks on the move are


|
||||||||||||||||||||||||||||||||||||||||||||||||
| 12Stocks.com: Investing in Canada Index with Stocks | |
|
The following table helps investors and traders sort through current performance and trends (as measured by market intelligence score) of various
stocks in the Canada Index. Quick View: Move mouse or cursor over stock symbol (ticker) to view short-term technical chart and over stock name to view long term chart. Click on  to add stock symbol to your watchlist and to add stock symbol to your watchlist and  to view watchlist. Click on any ticker or stock name for detailed market intelligence report for that stock. to view watchlist. Click on any ticker or stock name for detailed market intelligence report for that stock. |
12Stocks.com Performance of Stocks in Canada Index
| Ticker | Stock Name | Watchlist | Category | Recent Price | Market Intelligence Score | Change % | Weekly Change% |
| RY | Royal Bank |   | Financials | 144.49 | 60 | -0.91% | -0.53% |
| MERC | Mercer | | Materials | 3.23 | 70 | 1.25% | -0.62% |
| CNI | Canadian National | | Industrials | 96.58 | 40 | -0.17% | -0.69% |
| MGA | Magna | | Services & Goods | 45.88 | 80 | 1.17% | -0.89% |
| BCE | BCE | | Technology | 24.72 | 70 | 1.02% | -1.04% |
| IMV | IMV | | Health Care | 0.08 | 20 | 0.00% | -1.10% |
| OGI | Organigram Global | | Health Care | 1.65 | 80 | 2.48% | -1.20% |
| STN | Stantec | | Industrials | 108.05 | 10 | -1.13% | -1.26% |
| FSI | Flexible | | Materials | 9.50 | 60 | -4.62% | -1.35% |
| CAE | Cae | | Industrials | 26.62 | 10 | -0.11% | -1.48% |
| BLDP | Ballard Power | | Industrials | 1.99 | 60 | 7.57% | -1.49% |
| FTS | Fortis | | Utilities | 49.23 | 10 | -0.91% | -1.62% |
| SNDL | SNDL | | Consumer Staples | 2.48 | 70 | 1.64% | -1.98% |
| WCN | Waste Connections | | Industrials | 179.30 | 0 | -1.09% | -2.14% |
| TD | Toronto Dominion | | Financials | 74.46 | 40 | -0.33% | -2.21% |
| VOXR | Vox Royalty | | Materials | 3.54 | 50 | 3.21% | -2.21% |
| CRON | Cronos | | Health Care | 2.50 | 40 | 0.00% | -2.34% |
| AQN | Algonquin Power | | Utilities | 5.67 | 20 | 0.53% | -2.41% |
| BBU | Brookfield Business | | Industrials | 27.35 | 80 | 0.11% | -2.57% |
| TMDI | Titan Medical | | Health Care | 0.16 | 20 | 2.87% | -2.77% |
| IMO | Imperial Oil | | Energy | 87.28 | 50 | -0.22% | -2.83% |
| CNQ | Canadian Natural | | Energy | 30.36 | 20 | -3.19% | -2.97% |
| NTR | Nutrien | | Materials | 56.43 | 0 | -0.97% | -2.99% |
| ABCL | AbCellera Biologics | | Health Care | 4.22 | 60 | 1.44% | -2.99% |
| LAC | Lithium Americas | | Materials | 2.89 | 70 | 3.58% | -3.02% |
| To view more stocks, click on Next / Previous arrows or select different range: 0 - 25 , 25 - 50 , 50 - 75 , 75 - 100 , 100 - 125 , 125 - 150 , 150 - 175 , 175 - 200 , 200 - 225 , 225 - 250 | ||
 | Click To Change The Sort Order: By Market Cap or Company Size Performance: Year-to-date, Week and Day |  |
| Detailed Overview Of Canada Stocks |
| Canada Technical Overview, Leaders & Laggards, Top Canada ETF Funds & Detailed Canada Stocks List, Charts, Trends & More |
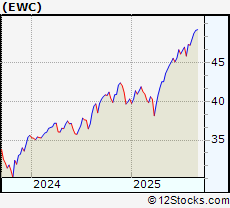
| Canada: Technical Analysis, Trends & YTD Performance | |
 EWC Weekly Chart |
|
| Long Term Trend: Very Good | |
| Medium Term Trend: Good | |
 EWC Daily Chart |
|
| Short Term Trend: Good | |
| Overall Trend Score: 90 | |
| YTD Performance: 22.6769% | |
| **Trend Scores & Views Are Only For Educational Purposes And Not For Investing | |
| 12Stocks.com: Investing in Canada Index using Exchange Traded Funds | |
|
The following table shows list of key exchange traded funds (ETF) that
help investors play Canada stock market. For detailed view, check out our ETF Funds section of our website. Quick View: Move mouse or cursor over ETF symbol (ticker) to view short-term technical chart and over ETF name to view long term chart. Click on ticker or stock name for detailed view. Click on to add stock symbol to your watchlist and to view watchlist. |
12Stocks.com List of ETFs that track Canada Index
| Ticker | ETF Name | Watchlist | Recent Price | Market Intelligence Score | Change % | Week % | Year-to-date % |
| FCAN | Canada AlphaDEX | | 93.12 | 70 | -0.608389 | 10.3841 | 0% |
| QCAN | Canada StrategicFactors | | 59.03 | 10 | 0 | 0 | 0% |
| 12Stocks.com: Charts, Trends, Fundamental Data and Performances of Canada Stocks | |
|
We now take in-depth look at all Canada stocks including charts, multi-period performances and overall trends (as measured by market intelligence score). One can sort Canada stocks (click link to choose) by Daily, Weekly and by Year-to-Date performances. Also, one can sort by size of the company or by market capitalization. |
| Select Your Default Chart Type: | |||||
| |||||
| Click on stock symbol or name for detailed view. Click on to add stock symbol to your watchlist and to view watchlist. Quick View: Move mouse or cursor over "Daily" to quickly view daily technical stock chart and over "Weekly" to view weekly technical stock chart. | |||||

 | NOA North American Construction Group Ltd |
| Sector: Energy | |
| SubSector: Oil & Gas Equipment & Services | |
| MarketCap: 393.48 Millions | |
| Recent Price: 13.37 Market Intelligence Score: 50 | |
| Day Percent Change: -0.742391% Day Change: 0.33 | |
| Week Change: -0.520833% Year-to-date Change: -37.8% | |
| NOA Links: Profile News Message Board | |
| Charts:- Daily , Weekly | |
| Add NOA to Watchlist: View: Get Complete NOA Trend Analysis ➞ | |
 | RY Royal Bank Of Canada |
| Sector: Financials | |
| SubSector: Banks - Diversified | |
| MarketCap: 203771 Millions | |
| Recent Price: 144.49 Market Intelligence Score: 60 | |
| Day Percent Change: -0.905288% Day Change: -0.29 | |
| Week Change: -0.530084% Year-to-date Change: 23.9% | |
| RY Links: Profile News Message Board | |
| Charts:- Daily , Weekly | |
| Add RY to Watchlist: View: Get Complete RY Trend Analysis ➞ | |
 | MERC Mercer International Inc |
| Sector: Materials | |
| SubSector: Paper & Paper Products | |
| MarketCap: 216.35 Millions | |
| Recent Price: 3.23 Market Intelligence Score: 70 | |
| Day Percent Change: 1.25392% Day Change: 0.06 | |
| Week Change: -0.615385% Year-to-date Change: -47.8% | |
| MERC Links: Profile News Message Board | |
| Charts:- Daily , Weekly | |
| Add MERC to Watchlist: View: Get Complete MERC Trend Analysis ➞ | |
 | CNI Canadian National Railway Co |
| Sector: Industrials | |
| SubSector: Railroads | |
| MarketCap: 60266.5 Millions | |
| Recent Price: 96.58 Market Intelligence Score: 40 | |
| Day Percent Change: -0.17056% Day Change: 0.22 | |
| Week Change: -0.694087% Year-to-date Change: -4.0% | |
| CNI Links: Profile News Message Board | |
| Charts:- Daily , Weekly | |
| Add CNI to Watchlist: View: Get Complete CNI Trend Analysis ➞ | |
 | MGA Magna International Inc |
| Sector: Services & Goods | |
| SubSector: Auto Parts | |
| MarketCap: 12928.1 Millions | |
| Recent Price: 45.88 Market Intelligence Score: 80 | |
| Day Percent Change: 1.16869% Day Change: -0.12 | |
| Week Change: -0.88572% Year-to-date Change: 14.2% | |
| MGA Links: Profile News Message Board | |
| Charts:- Daily , Weekly | |
| Add MGA to Watchlist: View: Get Complete MGA Trend Analysis ➞ | |
 | BCE BCE Inc |
| Sector: Technology | |
| SubSector: Telecom Services | |
| MarketCap: 22787.6 Millions | |
| Recent Price: 24.72 Market Intelligence Score: 70 | |
| Day Percent Change: 1.02166% Day Change: -0.02 | |
| Week Change: -1.04083% Year-to-date Change: 10.9% | |
| BCE Links: Profile News Message Board | |
| Charts:- Daily , Weekly | |
| Add BCE to Watchlist: View: Get Complete BCE Trend Analysis ➞ | |
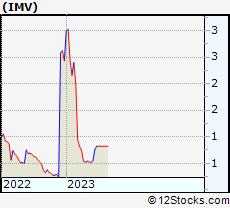 | IMV IMV Inc. |
| Sector: Health Care | |
| SubSector: Biotechnology | |
| MarketCap: 89.1785 Millions | |
| Recent Price: 0.08 Market Intelligence Score: 20 | |
| Day Percent Change: 0% Day Change: -9999 | |
| Week Change: -1.09756% Year-to-date Change: 0.0% | |
| IMV Links: Profile News Message Board | |
| Charts:- Daily , Weekly | |
| Add IMV to Watchlist: View: Get Complete IMV Trend Analysis ➞ | |
 | OGI Organigram Global Inc |
| Sector: Health Care | |
| SubSector: Drug Manufacturers - Specialty & Generic | |
| MarketCap: 220.9 Millions | |
| Recent Price: 1.65 Market Intelligence Score: 80 | |
| Day Percent Change: 2.48447% Day Change: 0.07 | |
| Week Change: -1.1976% Year-to-date Change: -0.6% | |
| OGI Links: Profile News Message Board | |
| Charts:- Daily , Weekly | |
| Add OGI to Watchlist: View: Get Complete OGI Trend Analysis ➞ | |
 | STN Stantec Inc |
| Sector: Industrials | |
| SubSector: Engineering & Construction | |
| MarketCap: 12325.3 Millions | |
| Recent Price: 108.05 Market Intelligence Score: 10 | |
| Day Percent Change: -1.1346% Day Change: 2.12 | |
| Week Change: -1.26108% Year-to-date Change: 38.0% | |
| STN Links: Profile News Message Board | |
| Charts:- Daily , Weekly | |
| Add STN to Watchlist: View: Get Complete STN Trend Analysis ➞ | |
 | FSI Flexible Solutions International Inc |
| Sector: Materials | |
| SubSector: Specialty Chemicals | |
| MarketCap: 120.24 Millions | |
| Recent Price: 9.50 Market Intelligence Score: 60 | |
| Day Percent Change: -4.61847% Day Change: 0 | |
| Week Change: -1.34995% Year-to-date Change: 164.9% | |
| FSI Links: Profile News Message Board | |
| Charts:- Daily , Weekly | |
| Add FSI to Watchlist: View: Get Complete FSI Trend Analysis ➞ | |
 | CAE Cae Inc |
| Sector: Industrials | |
| SubSector: Aerospace & Defense | |
| MarketCap: 8533.31 Millions | |
| Recent Price: 26.62 Market Intelligence Score: 10 | |
| Day Percent Change: -0.11257% Day Change: 0.1 | |
| Week Change: -1.48038% Year-to-date Change: 9.2% | |
| CAE Links: Profile News Message Board | |
| Charts:- Daily , Weekly | |
| Add CAE to Watchlist: View: Get Complete CAE Trend Analysis ➞ | |
 | BLDP Ballard Power Systems Inc |
| Sector: Industrials | |
| SubSector: Specialty Industrial Machinery | |
| MarketCap: 598.15 Millions | |
| Recent Price: 1.99 Market Intelligence Score: 60 | |
| Day Percent Change: 7.56757% Day Change: -0.01 | |
| Week Change: -1.48515% Year-to-date Change: 8.2% | |
| BLDP Links: Profile News Message Board | |
| Charts:- Daily , Weekly | |
| Add BLDP to Watchlist: View: Get Complete BLDP Trend Analysis ➞ | |
 | FTS Fortis Inc |
| Sector: Utilities | |
| SubSector: Utilities - Regulated Electric | |
| MarketCap: 24792.2 Millions | |
| Recent Price: 49.23 Market Intelligence Score: 10 | |
| Day Percent Change: -0.905797% Day Change: -0.08 | |
| Week Change: -1.61871% Year-to-date Change: 21.3% | |
| FTS Links: Profile News Message Board | |
| Charts:- Daily , Weekly | |
| Add FTS to Watchlist: View: Get Complete FTS Trend Analysis ➞ | |
 | SNDL SNDL Inc |
| Sector: Consumer Staples | |
| SubSector: Beverages - Wineries & Distilleries | |
| MarketCap: 638.35 Millions | |
| Recent Price: 2.48 Market Intelligence Score: 70 | |
| Day Percent Change: 1.63934% Day Change: 0.03 | |
| Week Change: -1.97628% Year-to-date Change: 30.5% | |
| SNDL Links: Profile News Message Board | |
| Charts:- Daily , Weekly | |
| Add SNDL to Watchlist: View: Get Complete SNDL Trend Analysis ➞ | |
 | WCN Waste Connections Inc |
| Sector: Industrials | |
| SubSector: Waste Management | |
| MarketCap: 46164.4 Millions | |
| Recent Price: 179.30 Market Intelligence Score: 0 | |
| Day Percent Change: -1.08678% Day Change: 0.68 | |
| Week Change: -2.14485% Year-to-date Change: 6.1% | |
| WCN Links: Profile News Message Board | |
| Charts:- Daily , Weekly | |
| Add WCN to Watchlist: View: Get Complete WCN Trend Analysis ➞ | |
 | TD Toronto Dominion Bank |
| Sector: Financials | |
| SubSector: Banks - Diversified | |
| MarketCap: 130432 Millions | |
| Recent Price: 74.46 Market Intelligence Score: 40 | |
| Day Percent Change: -0.334627% Day Change: -0.07 | |
| Week Change: -2.20646% Year-to-date Change: 45.5% | |
| TD Links: Profile News Message Board | |
| Charts:- Daily , Weekly | |
| Add TD to Watchlist: View: Get Complete TD Trend Analysis ➞ | |
 | VOXR Vox Royalty Corp |
| Sector: Materials | |
| SubSector: Other Precious Metals & Mining | |
| MarketCap: 179.69 Millions | |
| Recent Price: 3.54 Market Intelligence Score: 50 | |
| Day Percent Change: 3.207% Day Change: 0.15 | |
| Week Change: -2.20994% Year-to-date Change: 46.9% | |
| VOXR Links: Profile News Message Board | |
| Charts:- Daily , Weekly | |
| Add VOXR to Watchlist: View: Get Complete VOXR Trend Analysis ➞ | |
 | CRON Cronos Group Inc |
| Sector: Health Care | |
| SubSector: Drug Manufacturers - Specialty & Generic | |
| MarketCap: 957.35 Millions | |
| Recent Price: 2.50 Market Intelligence Score: 40 | |
| Day Percent Change: 0% Day Change: 0.14 | |
| Week Change: -2.34375% Year-to-date Change: 21.4% | |
| CRON Links: Profile News Message Board | |
| Charts:- Daily , Weekly | |
| Add CRON to Watchlist: View: Get Complete CRON Trend Analysis ➞ | |
 | AQN Algonquin Power & Utilities Corp |
| Sector: Utilities | |
| SubSector: Utilities - Diversified | |
| MarketCap: 4485.08 Millions | |
| Recent Price: 5.67 Market Intelligence Score: 20 | |
| Day Percent Change: 0.531915% Day Change: -0.02 | |
| Week Change: -2.40964% Year-to-date Change: 27.9% | |
| AQN Links: Profile News Message Board | |
| Charts:- Daily , Weekly | |
| Add AQN to Watchlist: View: Get Complete AQN Trend Analysis ➞ | |
 | BBU Brookfield Business Partners L.P |
| Sector: Industrials | |
| SubSector: Conglomerates | |
| MarketCap: 2444.54 Millions | |
| Recent Price: 27.35 Market Intelligence Score: 80 | |
| Day Percent Change: 0.10981% Day Change: -0.17 | |
| Week Change: -2.56502% Year-to-date Change: 16.0% | |
| BBU Links: Profile News Message Board | |
| Charts:- Daily , Weekly | |
| Add BBU to Watchlist: View: Get Complete BBU Trend Analysis ➞ | |
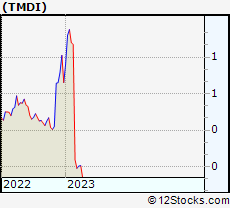 | TMDI Titan Medical Inc. |
| Sector: Health Care | |
| SubSector: Medical Appliances & Equipment | |
| MarketCap: 8.0508 Millions | |
| Recent Price: 0.16 Market Intelligence Score: 20 | |
| Day Percent Change: 2.86832% Day Change: -9999 | |
| Week Change: -2.77264% Year-to-date Change: 0.0% | |
| TMDI Links: Profile News Message Board | |
| Charts:- Daily , Weekly | |
| Add TMDI to Watchlist: View: Get Complete TMDI Trend Analysis ➞ | |
 | IMO Imperial Oil Ltd |
| Sector: Energy | |
| SubSector: Oil & Gas Integrated | |
| MarketCap: 44429.9 Millions | |
| Recent Price: 87.28 Market Intelligence Score: 50 | |
| Day Percent Change: -0.217217% Day Change: 1.07 | |
| Week Change: -2.82788% Year-to-date Change: 41.7% | |
| IMO Links: Profile News Message Board | |
| Charts:- Daily , Weekly | |
| Add IMO to Watchlist: View: Get Complete IMO Trend Analysis ➞ | |
 | CNQ Canadian Natural Resources Ltd |
| Sector: Energy | |
| SubSector: Oil & Gas E&P | |
| MarketCap: 63552 Millions | |
| Recent Price: 30.36 Market Intelligence Score: 20 | |
| Day Percent Change: -3.18878% Day Change: 0.53 | |
| Week Change: -2.9722% Year-to-date Change: -0.7% | |
| CNQ Links: Profile News Message Board | |
| Charts:- Daily , Weekly | |
| Add CNQ to Watchlist: View: Get Complete CNQ Trend Analysis ➞ | |
 | NTR Nutrien Ltd |
| Sector: Materials | |
| SubSector: Agricultural Inputs | |
| MarketCap: 27509.1 Millions | |
| Recent Price: 56.43 Market Intelligence Score: 0 | |
| Day Percent Change: -0.965251% Day Change: 0.57 | |
| Week Change: -2.99123% Year-to-date Change: 27.2% | |
| NTR Links: Profile News Message Board | |
| Charts:- Daily , Weekly | |
| Add NTR to Watchlist: View: Get Complete NTR Trend Analysis ➞ | |
 | ABCL AbCellera Biologics Inc |
| Sector: Health Care | |
| SubSector: Biotechnology | |
| MarketCap: 1261.07 Millions | |
| Recent Price: 4.22 Market Intelligence Score: 60 | |
| Day Percent Change: 1.44231% Day Change: 0.13 | |
| Week Change: -2.98851% Year-to-date Change: 39.3% | |
| ABCL Links: Profile News Message Board | |
| Charts:- Daily , Weekly | |
| Add ABCL to Watchlist: View: Get Complete ABCL Trend Analysis ➞ | |
| To view more stocks, click on Next / Previous arrows or select different range: 0 - 25 , 25 - 50 , 50 - 75 , 75 - 100 , 100 - 125 , 125 - 150 , 150 - 175 , 175 - 200 , 200 - 225 , 225 - 250 | ||
| Click To Change The Sort Order: By Market Cap or Company Size Performance: Year-to-date, Week and Day | |
| Select Chart Type: | ||
 Best Stocks Today 12Stocks.com |
© 2025 12Stocks.com Terms & Conditions Privacy Contact Us
All Information Provided Only For Education And Not To Be Used For Investing or Trading. See Terms & Conditions


One More Thing ... Get Best Stocks Delivered Daily!
Never Ever Miss A Move With Our Top Ten Stocks Lists
Find Best Stocks In Any Market - Bull or Bear Market
Take A Peek At Our Top Ten Stocks Lists: Daily, Weekly, Year-to-Date & Top Trends
Find Best Stocks In Any Market - Bull or Bear Market
Take A Peek At Our Top Ten Stocks Lists: Daily, Weekly, Year-to-Date & Top Trends
Canada Stocks With Best Up Trends [0-bearish to 100-bullish]: Celestica [100], Equinox Gold[100], Gold Royalty[100], EMX Royalty[100], Iamgold Corp[100], Trilogy Metals[100], Barrick Mining[100], Methanex Corp[100], Eldorado Gold[100], Turquo Hill[100], Denison Mines[100]
Best Canada Stocks Year-to-Date:
Americas Gold[605.128%], Avino Silver[339.322%], Gold Royalty[209.677%], Tower Hill[199.363%], Celestica [160.75%], New Gold[140.458%], EMX Royalty[133.908%], Kinross Gold[124.846%], Sandstorm Gold[102.209%], Agnico Eagle[86.6197%], OR Royalties[85.4636%] Best Canada Stocks This Week:
Crescent Point[4066.17%], Golden Star[1837.95%], Alexco Resource[690.301%], Yamana Gold[625.812%], Novelion [579.167%], Turquo Hill[433.11%], Enerplus [415.601%], Nevsun Resources[402.516%], Bellatrix Exploration[291.621%], Domtar [250.297%], Trillium [203.688%] Best Canada Stocks Daily:
Canadian Solar[15.036%], Celestica [9.64128%], Equinox Gold[9.0301%], Ballard Power[7.56757%], Novelion [7.37813%], Gold Royalty[6.66667%], EMX Royalty[6.5445%], Canopy Growth[5.7971%], Iamgold Corp[4.75687%], Teck Resources[4.69942%], Trilogy Metals[4.54545%]