
 Login Sign Up


| |||||
 |  | ||||

| 12Stocks.com Market Intelligence |
Best Biotech Stocks
|
|
| Quick Read: Best Biotech Stocks List By Performances & Trends: Daily, Weekly, Year-to-Date, Market Cap (Size) & Technical Trends | |||
| Best Biotech Stocks Views: Quick Browse View, Summary & Slide Show View | |||
| 12Stocks.com Biotech Stocks Performances & Trends Daily | |||||||||
|
|  The overall market intelligence score is 100 (0-bearish to 100-bullish) which puts Biotech sector in short term bullish trend. The market intelligence score from previous trading session is 90 and hence an improvement of trend.
| ||||||||
Here are the market intelligence trend scores of the most requested Biotech stocks at 12Stocks.com (click stock name for detailed review):
|


| 12Stocks.com: Investing in Biotech sector with Stocks | |
|
The following table helps investors and traders sort through current performance and trends (as measured by market intelligence score) of various
stocks in the Biotech sector. Quick View: Move mouse or cursor over stock symbol (ticker) to view short-term Technical chart and over stock name to view long term chart. Click on  to add stock symbol to your watchlist and to add stock symbol to your watchlist and  to view watchlist. Click on any ticker or stock name for detailed market intelligence report for that stock. to view watchlist. Click on any ticker or stock name for detailed market intelligence report for that stock. |
12Stocks.com Performance of Stocks in Biotech Sector
| Ticker | Stock Name | Watchlist | Category | Recent Price | Market Intelligence Score | Change % | YTD Change% |
| LGND | Ligand |   | Biotechnology | 159.10 | 90 | 1.33% | 46.81% |
| AUPH | Aurinia | | Biotechnology | 12.11 | 70 | 0.58% | 34.52% |
| DERM | Dermira | | Biotechnology | 7.48 | 10 | 0.14% | 81.07% |
| RGNX | REGENXBIO | | Biotechnology | 8.82 | 90 | 0.50% | 4.92% |
| CORT | Corcept | | Biotechnology | 69.73 | 30 | 0.82% | 40.86% |
| SANA | Sana nology | | Biotechnology | 3.37 | 30 | 3.75% | 120.86% |
| EDIT | Editas Medicine | | Biotechnology | 2.67 | 30 | 2.25% | 114.96% |
| HRTX | Heron | | Biotechnology | 1.36 | 50 | 1.54% | -13.73% |
| ESPR | Esperion | | Biotechnology | 2.18 | 90 | 3.90% | -3.18% |
| OPK | OPKO Health | | Biotechnology | 1.42 | 90 | -0.72% | -6.12% |
| MDGL | Madrigal | | Biotechnology | 425.06 | 100 | 3.94% | 31.93% |
| IRON | Disc Medicine | | Biotechnology | 59.95 | 50 | 1.75% | -5.76% |
| VCYT | Veracyte | | Biotechnology | 28.61 | 70 | -0.20% | -25.68% |
| CHRS | Coherus | | Biotechnology | 1.14 | 100 | 5.61% | -18.12% |
| NXTC | NextCure | | Biotechnology | 5.24 | 30 | -0.39% | -44.77% |
| DAWN | Day One | | Biotechnology | 7.59 | 100 | 2.50% | -44.91% |
| INVA | Innoviva | | Biotechnology | 19.84 | 50 | 0.10% | 15.10% |
| TGTX | TG | | Biotechnology | 28.57 | 40 | 1.62% | -4.42% |
| ENTA | Enanta | | Biotechnology | 8.53 | 80 | -2.61% | 49.39% |
| NAMS | NewAmsterdam Pharma | | Biotechnology | 24.47 | 40 | 0.49% | -4.90% |
| ADVM | Adverum nologies | | Biotechnology | 3.04 | 80 | 5.40% | -37.26% |
| RCKT | Rocket | | Biotechnology | 3.32 | 50 | -0.53% | -70.33% |
| YMAB | Y-mAbs | | Biotechnology | 8.55 | 90 | 0.12% | 8.94% |
| INO | Inovio | | Biotechnology | 2.46 | 100 | 3.24% | 4.37% |
| KRYS | Krystal | | Biotechnology | 147.64 | 70 | -0.11% | -7.00% |
| To view more stocks, click on Next / Previous arrows or select different range: 0 - 25 , 25 - 50 , 50 - 75 , 75 - 100 , 100 - 125 , 125 - 150 , 150 - 175 , 175 - 200 , 200 - 225 , 225 - 250 , 250 - 275 , 275 - 300 , 300 - 325 , 325 - 350 | ||
 | Click To Change The Sort Order: By Market Cap or Company Size Performance: Year-to-date, Week and Day |  |
|
Get the most comprehensive stock market coverage daily at 12Stocks.com ➞ Best Stocks Today ➞ Best Stocks Weekly ➞ Best Stocks Year-to-Date ➞ Best Stocks Trends ➞  Best Stocks Today 12Stocks.com Best Nasdaq Stocks ➞ Best S&P 500 Stocks ➞ Best Tech Stocks ➞ Best Biotech Stocks ➞ |
| Detailed Overview of Biotech Stocks |
| Biotech Technical Overview, Leaders & Laggards, Top Biotech ETF Funds & Detailed Biotech Stocks List, Charts, Trends & More |
| Biotech Sector: Technical Analysis, Trends & YTD Performance | |
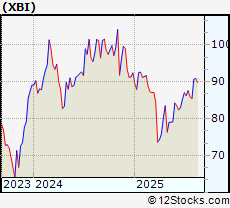
| Biotech sector, as represented by XBI, an exchange-traded fund [ETF] that holds basket of Biotech stocks (e.g, Amgen, Celgene) is down by -3.05% and is currently underperforming the overall market by -10.19% year-to-date. Below is a quick view of Technical charts and trends: | |
 XBI Weekly Chart |
|
| Long Term Trend: Very Good | |
| Medium Term Trend: Good | |
 XBI Daily Chart |
|
| Short Term Trend: Very Good | |
| Overall Trend Score: 100 | |
| YTD Performance: -3.05% | |
| **Trend Scores & Views Are Only For Educational Purposes And Not For Investing | |
| 12Stocks.com: Top Performing Biotech Sector Stocks | ||||||||||||||||||||||||||||||||||||||||||||||||
 The top performing Biotech sector stocks year to date are
Now, more recently, over last week, the top performing Biotech sector stocks on the move are


|
||||||||||||||||||||||||||||||||||||||||||||||||
| 12Stocks.com: Investing in Biotech Sector using Exchange Traded Funds | |
|
The following table shows list of key exchange traded funds (ETF) that
help investors track Biotech Index. For detailed view, check out our ETF Funds section of our website. Quick View: Move mouse or cursor over ETF symbol (ticker) to view short-term Technical chart and over ETF name to view long term chart. Click on ticker or stock name for detailed view. Click on to add stock symbol to your watchlist and to view watchlist. |
12Stocks.com List of ETFs that track Biotech Index
| Ticker | ETF Name | Watchlist | Recent Price | Market Intelligence Score | Change % | Week % | Year-to-date % |
| LABD | Biotech Bear 3X | | 5.66 | 20 | -2.55 | -1.37 | -19.84% |
| XBI | Biotech | | 89.83 | 100 | -0.51 | -1.2 | -3.05% |
| IBB | Biotechnology | | 138.59 | 80 | 0.73 | 0.73 | 0.89% |
| LABU | Biotech Bull 3X | | 70.31 | 100 | 2.38 | 0.61 | -22.08% |
| IYH | Healthcare | | 57.76 | 60 | -0.31 | 2.14 | -0.44% |
| IHF | Healthcare Providers | | 47.23 | 40 | 1.29 | 0.43 | -10.25% |
| ZBIO | Short Biotech | | 16.71 | 60 | 3.74 | 1.01 | 106.72% |
| IXJ | Global Healthcare | | 87.55 | 60 | 0.82 | 1.4 | -2.62% |
| CURE | Healthcare Bull 3X | | 80.00 | 50 | -1.02 | 6.93 | -12.21% |
| BBC | Bio Biotechnology Clinical | | 22.93 | 90 | 2.05 | 0.29 | -5.46% |
| FBT | First NYSE | | 172.07 | 80 | -0.15 | 0.66 | 4.14% |
| PBE | Biotech & Genome | | 68.46 | 80 | 0.31 | 1.64 | 2.9% |
| BIB | Biotechnology | | 55.82 | 60 | 1.03 | 2.47 | 11.53% |
| PTH | DWA Healthcare Momentum | | 40.06 | 80 | 0.67 | 0.47 | -1.58% |
| BBH | Biotech | | 165.39 | 60 | 0.61 | 0.53 | 1.51% |
| BIS | Short Biotech | | 14.27 | 40 | -0.99 | -2.37 | -20.83% |
| BBP | Bio Biotechnology Products | | 67.71 | 90 | 0.76 | 1.05 | 12.25% |
| 12Stocks.com: Charts, Trends, Fundamental Data and Performances of Biotech Stocks | |
|
We now take in-depth look at all Biotech stocks including charts, multi-period performances and overall trends (as measured by market intelligence score). One can sort Biotech stocks (click link to choose) by Daily, Weekly and by Year-to-Date performances. Also, one can sort by size of the company or by market capitalization. |
| Select Your Default Chart Type: | |||||
| |||||
| Click on stock symbol or name for detailed view. Click on to add stock symbol to your watchlist and to view watchlist. Quick View: Move mouse or cursor over "Daily" to quickly view daily Technical stock chart and over "Weekly" to view weekly Technical stock chart. | |||||

 | LGND Ligand Pharmaceuticals Incorporated |
| Sector: Health Care | |
| SubSector: Biotechnology | |
| MarketCap: 1344.45 Millions | |
| Recent Price: 159.10 Market Intelligence Score: 90 | |
| Day Percent Change: 1.33% Day Change: 2.06 | |
| Week Change: 2.29% Year-to-date Change: 46.8% | |
| LGND Links: Profile News Message Board | |
| Charts:- Daily , Weekly | |
| Add LGND to Watchlist: View: Get Complete LGND Trend Analysis ➞ | |
 | AUPH Aurinia Pharmaceuticals Inc. |
| Sector: Health Care | |
| SubSector: Biotechnology | |
| MarketCap: 1319.75 Millions | |
| Recent Price: 12.11 Market Intelligence Score: 70 | |
| Day Percent Change: 0.58% Day Change: 0.07 | |
| Week Change: -0.08% Year-to-date Change: 34.5% | |
| AUPH Links: Profile News Message Board | |
| Charts:- Daily , Weekly | |
| Add AUPH to Watchlist: View: Get Complete AUPH Trend Analysis ➞ | |
 | DERM Dermira, Inc. |
| Sector: Health Care | |
| SubSector: Biotechnology | |
| MarketCap: 1312.25 Millions | |
| Recent Price: 7.48 Market Intelligence Score: 10 | |
| Day Percent Change: 0.14% Day Change: 0.01 | |
| Week Change: -2.48% Year-to-date Change: 81.1% | |
| DERM Links: Profile News Message Board | |
| Charts:- Daily , Weekly | |
| Add DERM to Watchlist: View: Get Complete DERM Trend Analysis ➞ | |
 | RGNX REGENXBIO Inc. |
| Sector: Health Care | |
| SubSector: Biotechnology | |
| MarketCap: 1232.85 Millions | |
| Recent Price: 8.82 Market Intelligence Score: 90 | |
| Day Percent Change: 0.5% Day Change: 0.04 | |
| Week Change: -10.49% Year-to-date Change: 4.9% | |
| RGNX Links: Profile News Message Board | |
| Charts:- Daily , Weekly | |
| Add RGNX to Watchlist: View: Get Complete RGNX Trend Analysis ➞ | |
 | CORT Corcept Therapeutics Incorporated |
| Sector: Health Care | |
| SubSector: Biotechnology | |
| MarketCap: 1228.45 Millions | |
| Recent Price: 69.73 Market Intelligence Score: 30 | |
| Day Percent Change: 0.82% Day Change: 0.58 | |
| Week Change: -1.42% Year-to-date Change: 40.9% | |
| CORT Links: Profile News Message Board | |
| Charts:- Daily , Weekly | |
| Add CORT to Watchlist: View: Get Complete CORT Trend Analysis ➞ | |
 | SANA Sana Biotechnology, Inc. |
| Sector: Health Care | |
| SubSector: Biotechnology | |
| MarketCap: 1210 Millions | |
| Recent Price: 3.37 Market Intelligence Score: 30 | |
| Day Percent Change: 3.75% Day Change: 0.13 | |
| Week Change: 4.96% Year-to-date Change: 120.9% | |
| SANA Links: Profile News Message Board | |
| Charts:- Daily , Weekly | |
| Add SANA to Watchlist: View: Get Complete SANA Trend Analysis ➞ | |
 | EDIT Editas Medicine, Inc. |
| Sector: Health Care | |
| SubSector: Biotechnology | |
| MarketCap: 1194.95 Millions | |
| Recent Price: 2.67 Market Intelligence Score: 30 | |
| Day Percent Change: 2.25% Day Change: 0.06 | |
| Week Change: -7.77% Year-to-date Change: 115.0% | |
| EDIT Links: Profile News Message Board | |
| Charts:- Daily , Weekly | |
| Add EDIT to Watchlist: View: Get Complete EDIT Trend Analysis ➞ | |
 | HRTX Heron Therapeutics, Inc. |
| Sector: Health Care | |
| SubSector: Biotechnology | |
| MarketCap: 1172.75 Millions | |
| Recent Price: 1.36 Market Intelligence Score: 50 | |
| Day Percent Change: 1.54% Day Change: 0.02 | |
| Week Change: -2.22% Year-to-date Change: -13.7% | |
| HRTX Links: Profile News Message Board | |
| Charts:- Daily , Weekly | |
| Add HRTX to Watchlist: View: Get Complete HRTX Trend Analysis ➞ | |
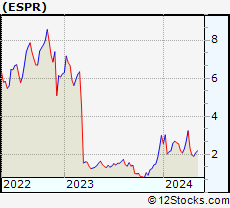 | ESPR Esperion Therapeutics, Inc. |
| Sector: Health Care | |
| SubSector: Biotechnology | |
| MarketCap: 1153.55 Millions | |
| Recent Price: 2.18 Market Intelligence Score: 90 | |
| Day Percent Change: 3.9% Day Change: 0.08 | |
| Week Change: 2.9% Year-to-date Change: -3.2% | |
| ESPR Links: Profile News Message Board | |
| Charts:- Daily , Weekly | |
| Add ESPR to Watchlist: View: Get Complete ESPR Trend Analysis ➞ | |
 | OPK OPKO Health, Inc. |
| Sector: Health Care | |
| SubSector: Biotechnology | |
| MarketCap: 1116.05 Millions | |
| Recent Price: 1.42 Market Intelligence Score: 90 | |
| Day Percent Change: -0.72% Day Change: -0.01 | |
| Week Change: 2.22% Year-to-date Change: -6.1% | |
| OPK Links: Profile News Message Board | |
| Charts:- Daily , Weekly | |
| Add OPK to Watchlist: View: Get Complete OPK Trend Analysis ➞ | |
 | MDGL Madrigal Pharmaceuticals, Inc. |
| Sector: Health Care | |
| SubSector: Biotechnology | |
| MarketCap: 1104.35 Millions | |
| Recent Price: 425.06 Market Intelligence Score: 100 | |
| Day Percent Change: 3.94% Day Change: 15.43 | |
| Week Change: 9.62% Year-to-date Change: 31.9% | |
| MDGL Links: Profile News Message Board | |
| Charts:- Daily , Weekly | |
| Add MDGL to Watchlist: View: Get Complete MDGL Trend Analysis ➞ | |
 | IRON Disc Medicine Opco Inc |
| Sector: Health Care | |
| SubSector: Biotechnology | |
| MarketCap: 1100 Millions | |
| Recent Price: 59.95 Market Intelligence Score: 50 | |
| Day Percent Change: 1.75% Day Change: 1.03 | |
| Week Change: -1.6% Year-to-date Change: -5.8% | |
| IRON Links: Profile News Message Board | |
| Charts:- Daily , Weekly | |
| Add IRON to Watchlist: View: Get Complete IRON Trend Analysis ➞ | |
 | VCYT Veracyte, Inc. |
| Sector: Health Care | |
| SubSector: Biotechnology | |
| MarketCap: 1089.05 Millions | |
| Recent Price: 28.61 Market Intelligence Score: 70 | |
| Day Percent Change: -0.2% Day Change: -0.06 | |
| Week Change: -2.03% Year-to-date Change: -25.7% | |
| VCYT Links: Profile News Message Board | |
| Charts:- Daily , Weekly | |
| Add VCYT to Watchlist: View: Get Complete VCYT Trend Analysis ➞ | |
 | CHRS Coherus BioSciences, Inc. |
| Sector: Health Care | |
| SubSector: Biotechnology | |
| MarketCap: 1073.45 Millions | |
| Recent Price: 1.14 Market Intelligence Score: 100 | |
| Day Percent Change: 5.61% Day Change: 0.06 | |
| Week Change: 10.78% Year-to-date Change: -18.1% | |
| CHRS Links: Profile News Message Board | |
| Charts:- Daily , Weekly | |
| Add CHRS to Watchlist: View: Get Complete CHRS Trend Analysis ➞ | |
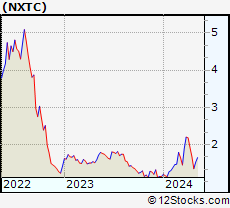 | NXTC NextCure, Inc. |
| Sector: Health Care | |
| SubSector: Biotechnology | |
| MarketCap: 1040.95 Millions | |
| Recent Price: 5.24 Market Intelligence Score: 30 | |
| Day Percent Change: -0.39% Day Change: -0.02 | |
| Week Change: -0.74% Year-to-date Change: -44.8% | |
| NXTC Links: Profile News Message Board | |
| Charts:- Daily , Weekly | |
| Add NXTC to Watchlist: View: Get Complete NXTC Trend Analysis ➞ | |
 | DAWN Day One Biopharmaceuticals, Inc. |
| Sector: Health Care | |
| SubSector: Biotechnology | |
| MarketCap: 1040 Millions | |
| Recent Price: 7.59 Market Intelligence Score: 100 | |
| Day Percent Change: 2.5% Day Change: 0.17 | |
| Week Change: 11.68% Year-to-date Change: -44.9% | |
| DAWN Links: Profile News Message Board | |
| Charts:- Daily , Weekly | |
| Add DAWN to Watchlist: View: Get Complete DAWN Trend Analysis ➞ | |
 | INVA Innoviva, Inc. |
| Sector: Health Care | |
| SubSector: Biotechnology | |
| MarketCap: 1023.15 Millions | |
| Recent Price: 19.84 Market Intelligence Score: 50 | |
| Day Percent Change: 0.1% Day Change: 0.02 | |
| Week Change: -4.36% Year-to-date Change: 15.1% | |
| INVA Links: Profile News Message Board | |
| Charts:- Daily , Weekly | |
| Add INVA to Watchlist: View: Get Complete INVA Trend Analysis ➞ | |
 | TGTX TG Therapeutics, Inc. |
| Sector: Health Care | |
| SubSector: Biotechnology | |
| MarketCap: 1022.85 Millions | |
| Recent Price: 28.57 Market Intelligence Score: 40 | |
| Day Percent Change: 1.62% Day Change: 0.46 | |
| Week Change: 3.6% Year-to-date Change: -4.4% | |
| TGTX Links: Profile News Message Board | |
| Charts:- Daily , Weekly | |
| Add TGTX to Watchlist: View: Get Complete TGTX Trend Analysis ➞ | |
 | ENTA Enanta Pharmaceuticals, Inc. |
| Sector: Health Care | |
| SubSector: Biotechnology | |
| MarketCap: 998.385 Millions | |
| Recent Price: 8.53 Market Intelligence Score: 80 | |
| Day Percent Change: -2.61% Day Change: -0.23 | |
| Week Change: 10.98% Year-to-date Change: 49.4% | |
| ENTA Links: Profile News Message Board | |
| Charts:- Daily , Weekly | |
| Add ENTA to Watchlist: View: Get Complete ENTA Trend Analysis ➞ | |
 | NAMS NewAmsterdam Pharma Company N.V. |
| Sector: Health Care | |
| SubSector: Biotechnology | |
| MarketCap: 979 Millions | |
| Recent Price: 24.47 Market Intelligence Score: 40 | |
| Day Percent Change: 0.49% Day Change: 0.12 | |
| Week Change: -2.9% Year-to-date Change: -4.9% | |
| NAMS Links: Profile News Message Board | |
| Charts:- Daily , Weekly | |
| Add NAMS to Watchlist: View: Get Complete NAMS Trend Analysis ➞ | |
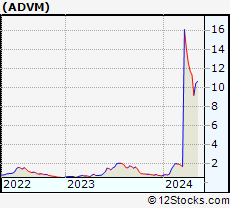 | ADVM Adverum Biotechnologies, Inc. |
| Sector: Health Care | |
| SubSector: Biotechnology | |
| MarketCap: 902.585 Millions | |
| Recent Price: 3.04 Market Intelligence Score: 80 | |
| Day Percent Change: 5.4% Day Change: 0.15 | |
| Week Change: 5.78% Year-to-date Change: -37.3% | |
| ADVM Links: Profile News Message Board | |
| Charts:- Daily , Weekly | |
| Add ADVM to Watchlist: View: Get Complete ADVM Trend Analysis ➞ | |
 | RCKT Rocket Pharmaceuticals, Inc. |
| Sector: Health Care | |
| SubSector: Biotechnology | |
| MarketCap: 899.585 Millions | |
| Recent Price: 3.32 Market Intelligence Score: 50 | |
| Day Percent Change: -0.53% Day Change: -0.02 | |
| Week Change: 23.1% Year-to-date Change: -70.3% | |
| RCKT Links: Profile News Message Board | |
| Charts:- Daily , Weekly | |
| Add RCKT to Watchlist: View: Get Complete RCKT Trend Analysis ➞ | |
 | YMAB Y-mAbs Therapeutics, Inc. |
| Sector: Health Care | |
| SubSector: Biotechnology | |
| MarketCap: 899.585 Millions | |
| Recent Price: 8.55 Market Intelligence Score: 90 | |
| Day Percent Change: 0.12% Day Change: 0.01 | |
| Week Change: 0.24% Year-to-date Change: 8.9% | |
| YMAB Links: Profile News Message Board | |
| Charts:- Daily , Weekly | |
| Add YMAB to Watchlist: View: Get Complete YMAB Trend Analysis ➞ | |
 | INO Inovio Pharmaceuticals, Inc. |
| Sector: Health Care | |
| SubSector: Biotechnology | |
| MarketCap: 876.385 Millions | |
| Recent Price: 2.46 Market Intelligence Score: 100 | |
| Day Percent Change: 3.24% Day Change: 0.06 | |
| Week Change: 17.9% Year-to-date Change: 4.4% | |
| INO Links: Profile News Message Board | |
| Charts:- Daily , Weekly | |
| Add INO to Watchlist: View: Get Complete INO Trend Analysis ➞ | |
 | KRYS Krystal Biotech, Inc. |
| Sector: Health Care | |
| SubSector: Biotechnology | |
| MarketCap: 874.085 Millions | |
| Recent Price: 147.64 Market Intelligence Score: 70 | |
| Day Percent Change: -0.11% Day Change: -0.16 | |
| Week Change: -3.08% Year-to-date Change: -7.0% | |
| KRYS Links: Profile News Message Board | |
| Charts:- Daily , Weekly | |
| Add KRYS to Watchlist: View: Get Complete KRYS Trend Analysis ➞ | |
| To view more stocks, click on Next / Previous arrows or select different range: 0 - 25 , 25 - 50 , 50 - 75 , 75 - 100 , 100 - 125 , 125 - 150 , 150 - 175 , 175 - 200 , 200 - 225 , 225 - 250 , 250 - 275 , 275 - 300 , 300 - 325 , 325 - 350 | ||
| Click To Change The Sort Order: By Market Cap or Company Size Performance: Year-to-date, Week and Day | |
| Select Chart Type: | ||
|
Best Stocks Today 12Stocks.com |
© 2025 12Stocks.com Terms & Conditions Privacy Contact Us
All Information Provided Only For Education And Not To Be Used For Investing or Trading. See Terms & Conditions


One More Thing ... Get Best Stocks Delivered Daily!
Never Ever Miss A Move With Our Top Ten Stocks Lists
Find Best Stocks In Any Market - Bull or Bear Market
Take A Peek At Our Top Ten Stocks Lists: Daily, Weekly, Year-to-Date & Top Trends
Find Best Stocks In Any Market - Bull or Bear Market
Take A Peek At Our Top Ten Stocks Lists: Daily, Weekly, Year-to-Date & Top Trends
Biotech Stocks With Best Up Trends [0-bearish to 100-bullish]: ALX Oncology[100], Precigen [100], Aligos [100], Design [100], Keros [100], Coherus [100], Kura Oncology[100], Denali [100], Prelude [100], FibroGen [100], Madrigal [100]
Best Biotech Stocks Year-to-Date:
I Mab[454.12%], Matinas BioPharma[241.18%], Nanobiotix S.A[239.28%], Atai Life[230.08%], Precigen [225%], DBV Technologies[208.74%], Galectin [200.78%], Sol-Gel Technologies[177.39%], Rigel [149.64%], Gossamer Bio[139.89%], Lineage Cell[132.84%] Best Biotech Stocks This Week:
Precigen [96.76%], Sol-Gel Technologies[69.18%], ALX Oncology[57.25%], Immuneering [52.3%], Minerva Neuro[34.54%], Aligos [29.73%], Karyopharm [29.46%], CASI [27.32%], Zentalis [26.35%], Rocket [23.1%], Tenaya [22.51%] Best Biotech Stocks Daily:
Sol-Gel Technologies[40.22%], Immuneering [34.99%], ALX Oncology[23.8%], Tyra [14.26%], Nanobiotix S.A[14.15%], Zentalis [14.02%], Zura Bio[13.71%], X4 [13.57%], Precigen [13.4%], Gossamer Bio[11.28%], Mersana [11.25%]