
 Login Sign Up


| |||||
 |  | ||||

| 12Stocks.com Market Intelligence |
Best Biotech Stocks
|
|
| Quick Read: Best Biotech Stocks List By Performances & Trends: Daily, Weekly, Year-to-Date, Market Cap (Size) & Technical Trends | |||
| Best Biotech Stocks Views: Quick Browse View, Summary & Slide Show View | |||
| 12Stocks.com Biotech Stocks Performances & Trends Daily | |||||||||
|
|  The overall market intelligence score is 10 (0-bearish to 100-bullish) which puts Biotech sector in short term bearish trend. The market intelligence score from previous trading session is 0 and an improvement of trend continues.
| ||||||||
Here are the market intelligence trend scores of the most requested Biotech stocks at 12Stocks.com (click stock name for detailed review):
|


| 12Stocks.com: Investing in Biotech sector with Stocks | |
|
The following table helps investors and traders sort through current performance and trends (as measured by market intelligence score) of various
stocks in the Biotech sector. Quick View: Move mouse or cursor over stock symbol (ticker) to view short-term Technical chart and over stock name to view long term chart. Click on  to add stock symbol to your watchlist and to add stock symbol to your watchlist and  to view watchlist. Click on any ticker or stock name for detailed market intelligence report for that stock. to view watchlist. Click on any ticker or stock name for detailed market intelligence report for that stock. |
12Stocks.com Performance of Stocks in Biotech Sector
| Ticker | Stock Name | Watchlist | Category | Recent Price | Market Intelligence Score | Change % | YTD Change% |
| SPRY | ARS |   | Biotechnology | 8.21 | 36 | -3.07% | 44.42% |
| AVRO | AVROBIO | | Biotechnology | 1.20 | 0 | -0.41% | -11.76% |
| CNTA | Centessa | | Biotechnology | 10.00 | 31 | -5.39% | 23.76% |
| GHRS | GH Research | | Biotechnology | 11.72 | 88 | 6.26% | 113.87% |
| TERN | Terns | | Biotechnology | 4.82 | 32 | 5.70% | -27.08% |
| CERS | Cerus | | Biotechnology | 1.69 | 42 | 0.60% | -21.76% |
| CARA | Cara | | Biotechnology | 0.73 | 68 | 10.50% | -1.70% |
| CDXS | Codexis | | Biotechnology | 2.86 | 70 | 1.06% | -6.23% |
| ATRA | Atara Bio | | Biotechnology | 0.70 | 51 | 5.51% | 36.00% |
| OABI | OmniAb | | Biotechnology | 4.68 | 17 | 0.21% | -22.77% |
| ASMB | Assembly | | Biotechnology | 13.22 | 51 | -1.42% | NA |
| PGEN | Precigen | | Biotechnology | 1.38 | 45 | 3.76% | 2.99% |
| IMVT | Immunovant | | Biotechnology | 28.74 | 42 | 1.77% | -31.78% |
| ARDX | Ardelyx | | Biotechnology | 6.51 | 25 | 0.46% | 5.00% |
| RCUS | Arcus | | Biotechnology | 14.68 | 20 | 0.62% | -23.14% |
| GNFT | Genfit SA | | Biotechnology | 3.66 | 69 | 1.95% | -4.94% |
| ETNB | 89bio | | Biotechnology | 9.31 | 32 | 2.53% | -16.65% |
| TSVT | 2seventy bio | | Biotechnology | 4.65 | 10 | 2.88% | 7.51% |
| RLMD | Relmada | | Biotechnology | 3.87 | 5 | -3.25% | -6.52% |
| JANX | Janux | | Biotechnology | 48.88 | 66 | 0.39% | 354.91% |
| EWTX | Edgewise | | Biotechnology | 15.08 | 5 | -0.98% | 32.86% |
| ANIP | ANI | | Biotechnology | 65.62 | 51 | 0.21% | 19.01% |
| BTAI | BioXcel | | Biotechnology | 2.85 | 62 | 2.89% | -3.39% |
| MORF | Morphic Holding | | Biotechnology | 28.50 | 42 | 1.79% | -1.32% |
| APTO | Aptose | | Biotechnology | 1.23 | 20 | -0.08% | -51.57% |
| To view more stocks, click on Next / Previous arrows or select different range: 0 - 25 , 25 - 50 , 50 - 75 , 75 - 100 , 100 - 125 , 125 - 150 , 150 - 175 , 175 - 200 , 200 - 225 , 225 - 250 , 250 - 275 , 275 - 300 , 300 - 325 , 325 - 350 , 350 - 375 , 375 - 400 | ||
 | Click To Change The Sort Order: By Market Cap or Company Size Performance: Year-to-date, Week and Day |  |
|
Get the most comprehensive stock market coverage daily at 12Stocks.com ➞ Best Stocks Today ➞ Best Stocks Weekly ➞ Best Stocks Year-to-Date ➞ Best Stocks Trends ➞  Best Stocks Today 12Stocks.com Best Nasdaq Stocks ➞ Best S&P 500 Stocks ➞ Best Tech Stocks ➞ Best Biotech Stocks ➞ |
| Detailed Overview of Biotech Stocks |
| Biotech Technical Overview, Leaders & Laggards, Top Biotech ETF Funds & Detailed Biotech Stocks List, Charts, Trends & More |
| Biotech Sector: Technical Analysis, Trends & YTD Performance | |
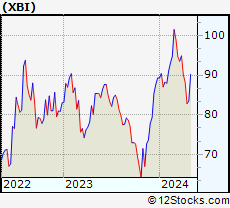
| Biotech sector, as represented by XBI, an exchange-traded fund [ETF] that holds basket of Biotech stocks (e.g, Amgen, Celgene) is down by -7.26% and is currently underperforming the overall market by -11.65% year-to-date. Below is a quick view of Technical charts and trends: | |
 XBI Weekly Chart |
|
| Long Term Trend: Not Good | |
| Medium Term Trend: Not Good | |
 XBI Daily Chart |
|
| Short Term Trend: Deteriorating | |
| Overall Trend Score: 10 | |
| YTD Performance: -7.26% | |
| **Trend Scores & Views Are Only For Educational Purposes And Not For Investing | |
| 12Stocks.com: Top Performing Biotech Sector Stocks | ||||||||||||||||||||||||||||||||||||||||||||||||
 The top performing Biotech sector stocks year to date are
Now, more recently, over last week, the top performing Biotech sector stocks on the move are


|
||||||||||||||||||||||||||||||||||||||||||||||||
| 12Stocks.com: Investing in Biotech Sector using Exchange Traded Funds | |
|
The following table shows list of key exchange traded funds (ETF) that
help investors track Biotech Index. For detailed view, check out our ETF Funds section of our website. Quick View: Move mouse or cursor over ETF symbol (ticker) to view short-term Technical chart and over ETF name to view long term chart. Click on ticker or stock name for detailed view. Click on to add stock symbol to your watchlist and to view watchlist. |
12Stocks.com List of ETFs that track Biotech Index
| Ticker | ETF Name | Watchlist | Recent Price | Market Intelligence Score | Change % | Week % | Year-to-date % |
| LABD | Biotech Bear 3X | | 10.75 | 95 | -0.46 | -0.46 | 10.94% |
| XBI | Biotech | | 82.81 | 10 | -0.03 | -0.03 | -7.26% |
| IBB | Biotechnology | | 126.11 | 25 | 1.11 | 1.11 | -7.17% |
| LABU | Biotech Bull 3X | | 86.43 | 10 | 0.44 | 0.44 | -29.14% |
| IHF | Healthcare Providers | | 52.08 | 70 | -0.26 | -0.26 | -0.83% |
| IYH | Healthcare | | 58.43 | 38 | 0.46 | 0.46 | 2.06% |
| IXJ | Global Healthcare | | 88.41 | 52 | 0.75 | 0.75 | 1.95% |
| CURE | Healthcare Bull 3X | | 104.45 | 32 | 1.08 | 1.08 | 2.66% |
| FBT | First NYSE | | 142.93 | 25 | 0.88 | 0.88 | -9.57% |
| BIB | Biotechnology | | 49.10 | 25 | 1.87 | 1.87 | -13.94% |
| PTH | DWA Healthcare Momentum | | 39.34 | 20 | -0.48 | -0.48 | 0.51% |
| PBE | Biotech & Genome | | 60.64 | 25 | 1.32 | 1.32 | -7.9% |
| BIS | Short Biotech | | 20.47 | 76 | -2.03 | -2.03 | 13.28% |
| BBH | Biotech | | 154.56 | 32 | 1.44 | 1.44 | -6.5% |
| BBC | Bio Biotechnology Clinical | | 24.86 | 10 | 0.61 | 0.61 | 1.67% |
| BTEC | Principal Healthcare Innovators | | 33.76 | 10 | -0.30 | -0.3 | -7.07% |
| BBP | Bio Biotechnology Products | | 51.43 | 17 | 1.98 | 1.98 | -11.47% |
| 12Stocks.com: Charts, Trends, Fundamental Data and Performances of Biotech Stocks | |
|
We now take in-depth look at all Biotech stocks including charts, multi-period performances and overall trends (as measured by market intelligence score). One can sort Biotech stocks (click link to choose) by Daily, Weekly and by Year-to-Date performances. Also, one can sort by size of the company or by market capitalization. |
| Select Your Default Chart Type: | |||||
| |||||
| Click on stock symbol or name for detailed view. Click on to add stock symbol to your watchlist and to view watchlist. Quick View: Move mouse or cursor over "Daily" to quickly view daily Technical stock chart and over "Weekly" to view weekly Technical stock chart. | |||||

 | SPRY ARS Pharmaceuticals, Inc. |
| Sector: Health Care | |
| SubSector: Biotechnology | |
| MarketCap: 632 Millions | |
| Recent Price: 8.21 Market Intelligence Score: 36 | |
| Day Percent Change: -3.07% Day Change: -0.26 | |
| Week Change: -3.07% Year-to-date Change: 44.4% | |
| SPRY Links: Profile News Message Board | |
| Charts:- Daily , Weekly | |
| Add SPRY to Watchlist: View: Get Complete SPRY Trend Analysis ➞ | |
 | AVRO AVROBIO, Inc. |
| Sector: Health Care | |
| SubSector: Biotechnology | |
| MarketCap: 626.185 Millions | |
| Recent Price: 1.20 Market Intelligence Score: 0 | |
| Day Percent Change: -0.41% Day Change: -0.01 | |
| Week Change: -0.41% Year-to-date Change: -11.8% | |
| AVRO Links: Profile News Message Board | |
| Charts:- Daily , Weekly | |
| Add AVRO to Watchlist: View: Get Complete AVRO Trend Analysis ➞ | |
 | CNTA Centessa Pharmaceuticals plc |
| Sector: Health Care | |
| SubSector: Biotechnology | |
| MarketCap: 616 Millions | |
| Recent Price: 10.00 Market Intelligence Score: 31 | |
| Day Percent Change: -5.39% Day Change: -0.57 | |
| Week Change: -5.39% Year-to-date Change: 23.8% | |
| CNTA Links: Profile News Message Board | |
| Charts:- Daily , Weekly | |
| Add CNTA to Watchlist: View: Get Complete CNTA Trend Analysis ➞ | |
 | GHRS GH Research PLC |
| Sector: Health Care | |
| SubSector: Biotechnology | |
| MarketCap: 614 Millions | |
| Recent Price: 11.72 Market Intelligence Score: 88 | |
| Day Percent Change: 6.26% Day Change: 0.69 | |
| Week Change: 6.26% Year-to-date Change: 113.9% | |
| GHRS Links: Profile News Message Board | |
| Charts:- Daily , Weekly | |
| Add GHRS to Watchlist: View: Get Complete GHRS Trend Analysis ➞ | |
 | TERN Terns Pharmaceuticals, Inc. |
| Sector: Health Care | |
| SubSector: Biotechnology | |
| MarketCap: 611 Millions | |
| Recent Price: 4.82 Market Intelligence Score: 32 | |
| Day Percent Change: 5.70% Day Change: 0.26 | |
| Week Change: 5.7% Year-to-date Change: -27.1% | |
| TERN Links: Profile News Message Board | |
| Charts:- Daily , Weekly | |
| Add TERN to Watchlist: View: Get Complete TERN Trend Analysis ➞ | |
 | CERS Cerus Corporation |
| Sector: Health Care | |
| SubSector: Biotechnology | |
| MarketCap: 607.185 Millions | |
| Recent Price: 1.69 Market Intelligence Score: 42 | |
| Day Percent Change: 0.60% Day Change: 0.01 | |
| Week Change: 0.6% Year-to-date Change: -21.8% | |
| CERS Links: Profile News Message Board | |
| Charts:- Daily , Weekly | |
| Add CERS to Watchlist: View: Get Complete CERS Trend Analysis ➞ | |
 | CARA Cara Therapeutics, Inc. |
| Sector: Health Care | |
| SubSector: Biotechnology | |
| MarketCap: 597.985 Millions | |
| Recent Price: 0.73 Market Intelligence Score: 68 | |
| Day Percent Change: 10.50% Day Change: 0.07 | |
| Week Change: 10.5% Year-to-date Change: -1.7% | |
| CARA Links: Profile News Message Board | |
| Charts:- Daily , Weekly | |
| Add CARA to Watchlist: View: Get Complete CARA Trend Analysis ➞ | |
 | CDXS Codexis, Inc. |
| Sector: Health Care | |
| SubSector: Biotechnology | |
| MarketCap: 592.185 Millions | |
| Recent Price: 2.86 Market Intelligence Score: 70 | |
| Day Percent Change: 1.06% Day Change: 0.03 | |
| Week Change: 1.06% Year-to-date Change: -6.2% | |
| CDXS Links: Profile News Message Board | |
| Charts:- Daily , Weekly | |
| Add CDXS to Watchlist: View: Get Complete CDXS Trend Analysis ➞ | |
 | ATRA Atara Biotherapeutics, Inc. |
| Sector: Health Care | |
| SubSector: Biotechnology | |
| MarketCap: 579.185 Millions | |
| Recent Price: 0.70 Market Intelligence Score: 51 | |
| Day Percent Change: 5.51% Day Change: 0.04 | |
| Week Change: 5.51% Year-to-date Change: 36.0% | |
| ATRA Links: Profile News Message Board | |
| Charts:- Daily , Weekly | |
| Add ATRA to Watchlist: View: Get Complete ATRA Trend Analysis ➞ | |
 | OABI OmniAb, Inc. |
| Sector: Health Care | |
| SubSector: Biotechnology | |
| MarketCap: 570 Millions | |
| Recent Price: 4.68 Market Intelligence Score: 17 | |
| Day Percent Change: 0.21% Day Change: 0.01 | |
| Week Change: 0.21% Year-to-date Change: -22.8% | |
| OABI Links: Profile News Message Board | |
| Charts:- Daily , Weekly | |
| Add OABI to Watchlist: View: Get Complete OABI Trend Analysis ➞ | |
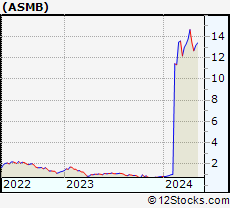 | ASMB Assembly Biosciences, Inc. |
| Sector: Health Care | |
| SubSector: Biotechnology | |
| MarketCap: 569.485 Millions | |
| Recent Price: 13.22 Market Intelligence Score: 51 | |
| Day Percent Change: -1.42% Day Change: -0.19 | |
| Week Change: -1.42% Year-to-date Change: 1,512.0% | |
| ASMB Links: Profile News Message Board | |
| Charts:- Daily , Weekly | |
| Add ASMB to Watchlist: View: Get Complete ASMB Trend Analysis ➞ | |
 | PGEN Precigen, Inc. |
| Sector: Health Care | |
| SubSector: Biotechnology | |
| MarketCap: 564.785 Millions | |
| Recent Price: 1.38 Market Intelligence Score: 45 | |
| Day Percent Change: 3.76% Day Change: 0.05 | |
| Week Change: 3.76% Year-to-date Change: 3.0% | |
| PGEN Links: Profile News Message Board | |
| Charts:- Daily , Weekly | |
| Add PGEN to Watchlist: View: Get Complete PGEN Trend Analysis ➞ | |
 | IMVT Immunovant, Inc. |
| Sector: Health Care | |
| SubSector: Biotechnology | |
| MarketCap: 552.885 Millions | |
| Recent Price: 28.74 Market Intelligence Score: 42 | |
| Day Percent Change: 1.77% Day Change: 0.50 | |
| Week Change: 1.77% Year-to-date Change: -31.8% | |
| IMVT Links: Profile News Message Board | |
| Charts:- Daily , Weekly | |
| Add IMVT to Watchlist: View: Get Complete IMVT Trend Analysis ➞ | |
 | ARDX Ardelyx, Inc. |
| Sector: Health Care | |
| SubSector: Biotechnology | |
| MarketCap: 541.985 Millions | |
| Recent Price: 6.51 Market Intelligence Score: 25 | |
| Day Percent Change: 0.46% Day Change: 0.03 | |
| Week Change: 0.46% Year-to-date Change: 5.0% | |
| ARDX Links: Profile News Message Board | |
| Charts:- Daily , Weekly | |
| Add ARDX to Watchlist: View: Get Complete ARDX Trend Analysis ➞ | |
 | RCUS Arcus Biosciences, Inc. |
| Sector: Health Care | |
| SubSector: Biotechnology | |
| MarketCap: 539.285 Millions | |
| Recent Price: 14.68 Market Intelligence Score: 20 | |
| Day Percent Change: 0.62% Day Change: 0.09 | |
| Week Change: 0.62% Year-to-date Change: -23.1% | |
| RCUS Links: Profile News Message Board | |
| Charts:- Daily , Weekly | |
| Add RCUS to Watchlist: View: Get Complete RCUS Trend Analysis ➞ | |
 | GNFT Genfit SA |
| Sector: Health Care | |
| SubSector: Biotechnology | |
| MarketCap: 529.285 Millions | |
| Recent Price: 3.66 Market Intelligence Score: 69 | |
| Day Percent Change: 1.95% Day Change: 0.07 | |
| Week Change: 1.95% Year-to-date Change: -4.9% | |
| GNFT Links: Profile News Message Board | |
| Charts:- Daily , Weekly | |
| Add GNFT to Watchlist: View: Get Complete GNFT Trend Analysis ➞ | |
 | ETNB 89bio, Inc. |
| Sector: Health Care | |
| SubSector: Biotechnology | |
| MarketCap: 517.485 Millions | |
| Recent Price: 9.31 Market Intelligence Score: 32 | |
| Day Percent Change: 2.53% Day Change: 0.23 | |
| Week Change: 2.53% Year-to-date Change: -16.7% | |
| ETNB Links: Profile News Message Board | |
| Charts:- Daily , Weekly | |
| Add ETNB to Watchlist: View: Get Complete ETNB Trend Analysis ➞ | |
 | TSVT 2seventy bio, Inc. |
| Sector: Health Care | |
| SubSector: Biotechnology | |
| MarketCap: 504 Millions | |
| Recent Price: 4.65 Market Intelligence Score: 10 | |
| Day Percent Change: 2.88% Day Change: 0.13 | |
| Week Change: 2.88% Year-to-date Change: 7.5% | |
| TSVT Links: Profile News Message Board | |
| Charts:- Daily , Weekly | |
| Add TSVT to Watchlist: View: Get Complete TSVT Trend Analysis ➞ | |
 | RLMD Relmada Therapeutics, Inc. |
| Sector: Health Care | |
| SubSector: Biotechnology | |
| MarketCap: 499.685 Millions | |
| Recent Price: 3.87 Market Intelligence Score: 5 | |
| Day Percent Change: -3.25% Day Change: -0.13 | |
| Week Change: -3.25% Year-to-date Change: -6.5% | |
| RLMD Links: Profile News Message Board | |
| Charts:- Daily , Weekly | |
| Add RLMD to Watchlist: View: Get Complete RLMD Trend Analysis ➞ | |
 | JANX Janux Therapeutics, Inc. |
| Sector: Health Care | |
| SubSector: Biotechnology | |
| MarketCap: 496 Millions | |
| Recent Price: 48.88 Market Intelligence Score: 66 | |
| Day Percent Change: 0.39% Day Change: 0.19 | |
| Week Change: 0.39% Year-to-date Change: 354.9% | |
| JANX Links: Profile News Message Board | |
| Charts:- Daily , Weekly | |
| Add JANX to Watchlist: View: Get Complete JANX Trend Analysis ➞ | |
 | EWTX Edgewise Therapeutics, Inc. |
| Sector: Health Care | |
| SubSector: Biotechnology | |
| MarketCap: 492 Millions | |
| Recent Price: 15.08 Market Intelligence Score: 5 | |
| Day Percent Change: -0.98% Day Change: -0.15 | |
| Week Change: -0.98% Year-to-date Change: 32.9% | |
| EWTX Links: Profile News Message Board | |
| Charts:- Daily , Weekly | |
| Add EWTX to Watchlist: View: Get Complete EWTX Trend Analysis ➞ | |
 | ANIP ANI Pharmaceuticals, Inc. |
| Sector: Health Care | |
| SubSector: Biotechnology | |
| MarketCap: 489.285 Millions | |
| Recent Price: 65.62 Market Intelligence Score: 51 | |
| Day Percent Change: 0.21% Day Change: 0.14 | |
| Week Change: 0.21% Year-to-date Change: 19.0% | |
| ANIP Links: Profile News Message Board | |
| Charts:- Daily , Weekly | |
| Add ANIP to Watchlist: View: Get Complete ANIP Trend Analysis ➞ | |
 | BTAI BioXcel Therapeutics, Inc. |
| Sector: Health Care | |
| SubSector: Biotechnology | |
| MarketCap: 487.485 Millions | |
| Recent Price: 2.85 Market Intelligence Score: 62 | |
| Day Percent Change: 2.89% Day Change: 0.08 | |
| Week Change: 2.89% Year-to-date Change: -3.4% | |
| BTAI Links: Profile News Message Board | |
| Charts:- Daily , Weekly | |
| Add BTAI to Watchlist: View: Get Complete BTAI Trend Analysis ➞ | |
 | MORF Morphic Holding, Inc. |
| Sector: Health Care | |
| SubSector: Biotechnology | |
| MarketCap: 484.885 Millions | |
| Recent Price: 28.50 Market Intelligence Score: 42 | |
| Day Percent Change: 1.79% Day Change: 0.50 | |
| Week Change: 1.79% Year-to-date Change: -1.3% | |
| MORF Links: Profile News Message Board | |
| Charts:- Daily , Weekly | |
| Add MORF to Watchlist: View: Get Complete MORF Trend Analysis ➞ | |
 | APTO Aptose Biosciences Inc. |
| Sector: Health Care | |
| SubSector: Biotechnology | |
| MarketCap: 484.585 Millions | |
| Recent Price: 1.23 Market Intelligence Score: 20 | |
| Day Percent Change: -0.08% Day Change: 0.00 | |
| Week Change: -0.08% Year-to-date Change: -51.6% | |
| APTO Links: Profile News Message Board | |
| Charts:- Daily , Weekly | |
| Add APTO to Watchlist: View: Get Complete APTO Trend Analysis ➞ | |
| To view more stocks, click on Next / Previous arrows or select different range: 0 - 25 , 25 - 50 , 50 - 75 , 75 - 100 , 100 - 125 , 125 - 150 , 150 - 175 , 175 - 200 , 200 - 225 , 225 - 250 , 250 - 275 , 275 - 300 , 300 - 325 , 325 - 350 , 350 - 375 , 375 - 400 | ||
| Click To Change The Sort Order: By Market Cap or Company Size Performance: Year-to-date, Week and Day | |
| Select Chart Type: | ||
|
Best Stocks Today 12Stocks.com |
© 2024 12Stocks.com Terms & Conditions Privacy Contact Us
All Information Provided Only For Education And Not To Be Used For Investing or Trading. See Terms & Conditions


One More Thing ... Get Best Stocks Delivered Daily!
Never Ever Miss A Move With Our Top Ten Stocks Lists
Find Best Stocks In Any Market - Bull or Bear Market
Take A Peek At Our Top Ten Stocks Lists: Daily, Weekly, Year-to-Date & Top Trends
Find Best Stocks In Any Market - Bull or Bear Market
Take A Peek At Our Top Ten Stocks Lists: Daily, Weekly, Year-to-Date & Top Trends
Biotech Stocks With Best Up Trends [0-bearish to 100-bullish]: Annovis Bio[93], Agios [90], Anika [90], GH Research[88], Day One[86], Agenus [83], Moderna [83], Geron [83], XOMA [83], Humacyte [81], NuCana [81]
Best Biotech Stocks Year-to-Date:
Precision [2552.05%], Inovio [1864.71%], Assembly [1512%], Adverum nologies[1406.38%], NuCana [1231.98%], Affimed N.V[700%], Agenus [596.94%], Corbus [524.17%], Mesoblast [402.73%], Janux [354.91%], Viking [237.13%] Best Biotech Stocks This Week:
ProKidney [33.33%], BeyondSpring [17.22%], Molecular Partners[16.87%], ArTara [16.41%], Annovis Bio[14.9%], Seres [11.56%], Cara [10.5%], Syros [9.91%], Nektar [9.68%], Pharvaris N.V[8.92%], Agenus [8.66%] Best Biotech Stocks Daily:
ProKidney [33.33%], BeyondSpring [17.22%], Molecular Partners[16.87%], ArTara [16.41%], Annovis Bio[14.90%], Seres [11.56%], Cara [10.50%], Syros [9.91%], Nektar [9.68%], Pharvaris N.V[8.92%], Agenus [8.66%]