
 Login Sign Up


| |||||
 |  | ||||

| 12Stocks.com Market Intelligence |
Best SmallCap Stocks
|
| In a hurry? Small Cap Stock Lists: Performance Trends Table, Stock Charts
Sort Small Cap stocks: Daily, Weekly, Year-to-Date, Market Cap & Trends. Filter Small Cap stocks list by sector: Show all, Tech, Finance, Energy, Staples, Retail, Industrial, Materials, Utilities and HealthCare Filter Small Cap stocks list by size: All Large Medium Small and MicroCap |
| 12Stocks.com Small Cap Stocks Performances & Trends Daily | |||||||||
|
|  The overall Smart Investing & Trading Score is 49 (0-bearish to 100-bullish) which puts Small Cap index in short term neutral trend. The Smart Investing & Trading Score from previous trading session is 14 and hence an improvement of trend.
| ||||||||
Here are the Smart Investing & Trading Scores of the most requested small cap stocks at 12Stocks.com (click stock name for detailed review):
|


| 12Stocks.com: Investing in Smallcap Index with Stocks | |
|
The following table helps investors and traders sort through current performance and trends (as measured by Smart Investing & Trading Score) of various
stocks in the Smallcap Index. Quick View: Move mouse or cursor over stock symbol (ticker) to view short-term technical chart and over stock name to view long term chart. Click on  to add stock symbol to your watchlist and to add stock symbol to your watchlist and  to view watchlist. Click on any ticker or stock name for detailed market intelligence report for that stock. to view watchlist. Click on any ticker or stock name for detailed market intelligence report for that stock. |
12Stocks.com Performance of Stocks in Smallcap Index
| Ticker | Stock Name | Watchlist | Category | Recent Price | Smart Investing & Trading Score | Change % | YTD Change% |
| OPRX | OptimizeRx |   | Technology | 10.70 | 57 | 2.69% | -25.23% |
| SCSC | ScanSource | | Technology | 42.44 | 57 | 2.34% | 7.14% |
| BANC | Banc of California | | Financials | 14.22 | 57 | 2.23% | 5.88% |
| AI | C3.ai | | Financials | 23.15 | 57 | 2.03% | -19.37% |
| CCNE | CNB Financial | | Financials | 19.40 | 57 | 2.00% | -14.12% |
| MQ | Marqeta | | Technology | 5.60 | 57 | 2.00% | -20.40% |
| DORM | Dorman Products | | Consumer Staples | 90.73 | 57 | 1.92% | 8.78% |
| SPSC | SPS Commerce | | Technology | 182.07 | 57 | 1.73% | -6.07% |
| BATRK | Liberty Braves | | Services & Goods | 38.55 | 57 | 1.63% | -2.60% |
| WD | Walker & Dunlop | | Financials | 94.23 | 57 | 1.58% | -15.12% |
| ALRM | Alarm.com | | Technology | 67.75 | 57 | 1.27% | 4.84% |
| VPG | Vishay Precision | | Technology | 33.80 | 57 | 1.26% | -0.79% |
| MRTN | Marten Transport | | Transports | 17.22 | 57 | 1.23% | -17.92% |
| INDB | Independent Bank | | Financials | 51.33 | 57 | 0.90% | -22.00% |
| BOH | Bank of Hawaii | | Financials | 58.49 | 57 | 0.84% | -19.28% |
| RXRX | Recursion | | Health Care | 8.38 | 57 | 0.60% | -14.40% |
| AMBC | Ambac Financial | | Financials | 14.89 | 57 | 0.47% | -9.65% |
| AROC | Archrock | | Energy | 20.03 | 56 | 2.72% | 30.06% |
| GEO | GEO Group | | Financials | 14.98 | 56 | 1.63% | 38.32% |
| CNK | Cinemark | | Services & Goods | 17.59 | 56 | 0.92% | 24.84% |
| BSIG | BrightSphere | | Financials | 22.62 | 56 | 0.89% | 18.06% |
| BL | BlackLine | | Technology | 59.69 | 55 | 3.02% | -4.40% |
| TDW | Tidewater | | Energy | 93.89 | 55 | 2.70% | 30.20% |
| UFPI | Universal Forest | | Industrials | 115.49 | 55 | 2.20% | -8.01% |
| MD | MEDNAX | | Health Care | 9.12 | 55 | 1.22% | -1.94% |


| Too many stocks? View smallcap stocks filtered by marketcap & sector |
| Marketcap: All SmallCap Stocks (default-no microcap), Large, Mid-Range, Small |
| Smallcap Sector: Tech, Finance, Energy, Staples, Retail, Industrial, Materials, & Medical |
|
Get the most comprehensive stock market coverage daily at 12Stocks.com ➞ Best Stocks Today ➞ Best Stocks Weekly ➞ Best Stocks Year-to-Date ➞ Best Stocks Trends ➞  Best Stocks Today 12Stocks.com Best Nasdaq Stocks ➞ Best S&P 500 Stocks ➞ Best Tech Stocks ➞ Best Biotech Stocks ➞ |
| Detailed Overview of SmallCap Stocks |
| SmallCap Technical Overview, Leaders & Laggards, Top SmallCap ETF Funds & Detailed SmallCap Stocks List, Charts, Trends & More |
| Smallcap: Technical Analysis, Trends & YTD Performance | |
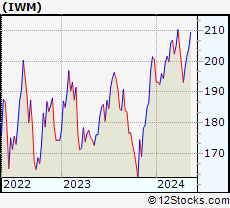
| SmallCap segment as represented by
IWM, an exchange-traded fund [ETF], holds basket of thousands of smallcap stocks from across all major sectors of the US stock market. The smallcap index (contains stocks like Riverbed & Sotheby's) is down by -0.39% and is currently underperforming the overall market by -6.01% year-to-date. Below is a quick view of technical charts and trends: | |
 IWM Weekly Chart |
|
| Long Term Trend: Not Good | |
| Medium Term Trend: Good | |
 IWM Daily Chart |
|
| Short Term Trend: Deteriorating | |
| Overall Trend Score: 49 | |
| YTD Performance: -0.39% | |
| **Trend Scores & Views Are Only For Educational Purposes And Not For Investing | |
| 12Stocks.com: Top Performing Small Cap Index Stocks | ||||||||||||||||||||||||||||||||||||||||||||||||
 The top performing Small Cap Index stocks year to date are
Now, more recently, over last week, the top performing Small Cap Index stocks on the move are


|
||||||||||||||||||||||||||||||||||||||||||||||||
| 12Stocks.com: Investing in Smallcap Index using Exchange Traded Funds | |
|
The following table shows list of key exchange traded funds (ETF) that
help investors track Smallcap index. The following list also includes leveraged ETF funds that track twice or thrice the daily returns of Smallcap indices. Short or inverse ETF funds move in the opposite direction to the index they track and are useful during market pullbacks or during bear markets. Quick View: Move mouse or cursor over ETF symbol (ticker) to view short-term technical chart and over ETF name to view long term chart. Click on ticker or stock name for detailed view. Click on to add stock symbol to your watchlist and to view watchlist. |
12Stocks.com List of ETFs that track Smallcap Index
| Ticker | ETF Name | Watchlist | Recent Price | Smart Investing & Trading Score | Change % | Week % | Year-to-date % |
| IWM | iShares Russell 2000 | | 199.92 | 49 | 1.84 | 0.77 | -0.39% |
| IJR | iShares Core S&P Small-Cap | | 106.33 | 50 | 1.52 | 0.64 | -1.77% |
| VTWO | Vanguard Russell 2000 ETF | | 80.85 | 42 | 1.88 | 0.79 | -0.31% |
| IWN | iShares Russell 2000 Value | | 152.88 | 75 | 2.04 | 1.15 | -1.58% |
| IWO | iShares Russell 2000 Growth | | 254.34 | 32 | 1.91 | 0.49 | 0.84% |
| IJS | iShares S&P Small-Cap 600 Value | | 98.02 | 43 | 1.68 | 0.85 | -4.9% |
| IJT | iShares S&P Small-Cap 600 Growth | | 126.72 | 63 | 1.42 | 0.5 | 1.26% |
| XSLV | PowerShares S&P SmallCap Low Volatil ETF | | 43.14 | 73 | 0.72 | 0.98 | -2.29% |
| SDD | ProShares UltraShort SmallCap600 | | 19.31 | 56 | -2.02 | -0.21 | 4.79% |
| SMLV | SPDR SSGA US Small Cap Low Volatil ETF | | 108.83 | 87 | 1.30 | 1.22 | -3.27% |
| SAA | ProShares Ultra SmallCap600 | | 22.93 | 42 | 1.56 | -0.46 | -8.08% |
| SBB | ProShares Short SmallCap600 | | 16.37 | 49 | -1.14 | -0.09 | 2.76% |
| 12Stocks.com: Charts, Trends, Fundamental Data and Performances of SmallCap Stocks | |
|
We now take in-depth look at all SmallCap stocks including charts, multi-period performances and overall trends (as measured by Smart Investing & Trading Score). One can sort SmallCap stocks (click link to choose) by Daily, Weekly and by Year-to-Date performances. Also, one can sort by size of the company or by market capitalization. |
| Select Your Default Chart Type: | |||||
| |||||
| Click on stock symbol or name for detailed view. Click on to add stock symbol to your watchlist and to view watchlist. Quick View: Move mouse or cursor over "Daily" to quickly view daily technical stock chart and over "Weekly" to view weekly technical stock chart. | |||||

 | OPRX OptimizeRx Corporation |
| Sector: Technology | |
| SubSector: Healthcare Information Services | |
| MarketCap: 107.155 Millions | |
| Recent Price: 10.70 Smart Investing & Trading Score: 57 | |
| Day Percent Change: 2.69% Day Change: 0.28 | |
| Week Change: 5.73% Year-to-date Change: -25.2% | |
| OPRX Links: Profile News Message Board | |
| Charts:- Daily , Weekly | |
| Add OPRX to Watchlist: View: Get Complete OPRX Trend Analysis ➞ | |
 | SCSC ScanSource, Inc. |
| Sector: Technology | |
| SubSector: Technical & System Software | |
| MarketCap: 541 Millions | |
| Recent Price: 42.44 Smart Investing & Trading Score: 57 | |
| Day Percent Change: 2.34% Day Change: 0.97 | |
| Week Change: 1.12% Year-to-date Change: 7.1% | |
| SCSC Links: Profile News Message Board | |
| Charts:- Daily , Weekly | |
| Add SCSC to Watchlist: View: Get Complete SCSC Trend Analysis ➞ | |
 | BANC Banc of California, Inc. |
| Sector: Financials | |
| SubSector: Regional - Pacific Banks | |
| MarketCap: 459.929 Millions | |
| Recent Price: 14.22 Smart Investing & Trading Score: 57 | |
| Day Percent Change: 2.23% Day Change: 0.31 | |
| Week Change: -0.7% Year-to-date Change: 5.9% | |
| BANC Links: Profile News Message Board | |
| Charts:- Daily , Weekly | |
| Add BANC to Watchlist: View: Get Complete BANC Trend Analysis ➞ | |
 | AI C3.ai, Inc. |
| Sector: Financials | |
| SubSector: REIT Mortgage | |
| MarketCap: 12467 Millions | |
| Recent Price: 23.15 Smart Investing & Trading Score: 57 | |
| Day Percent Change: 2.03% Day Change: 0.46 | |
| Week Change: 1.4% Year-to-date Change: -19.4% | |
| AI Links: Profile News Message Board | |
| Charts:- Daily , Weekly | |
| Add AI to Watchlist: View: Get Complete AI Trend Analysis ➞ | |
 | CCNE CNB Financial Corporation |
| Sector: Financials | |
| SubSector: Regional - Northeast Banks | |
| MarketCap: 286.599 Millions | |
| Recent Price: 19.40 Smart Investing & Trading Score: 57 | |
| Day Percent Change: 2.00% Day Change: 0.38 | |
| Week Change: 1.73% Year-to-date Change: -14.1% | |
| CCNE Links: Profile News Message Board | |
| Charts:- Daily , Weekly | |
| Add CCNE to Watchlist: View: Get Complete CCNE Trend Analysis ➞ | |
 | MQ Marqeta, Inc. |
| Sector: Technology | |
| SubSector: Software - Infrastructure | |
| MarketCap: 2650 Millions | |
| Recent Price: 5.60 Smart Investing & Trading Score: 57 | |
| Day Percent Change: 2.00% Day Change: 0.11 | |
| Week Change: 3.42% Year-to-date Change: -20.4% | |
| MQ Links: Profile News Message Board | |
| Charts:- Daily , Weekly | |
| Add MQ to Watchlist: View: Get Complete MQ Trend Analysis ➞ | |
 | DORM Dorman Products, Inc. |
| Sector: Consumer Staples | |
| SubSector: Auto Parts | |
| MarketCap: 2028.79 Millions | |
| Recent Price: 90.73 Smart Investing & Trading Score: 57 | |
| Day Percent Change: 1.92% Day Change: 1.71 | |
| Week Change: 1.68% Year-to-date Change: 8.8% | |
| DORM Links: Profile News Message Board | |
| Charts:- Daily , Weekly | |
| Add DORM to Watchlist: View: Get Complete DORM Trend Analysis ➞ | |
 | SPSC SPS Commerce, Inc. |
| Sector: Technology | |
| SubSector: Application Software | |
| MarketCap: 1398.02 Millions | |
| Recent Price: 182.07 Smart Investing & Trading Score: 57 | |
| Day Percent Change: 1.73% Day Change: 3.10 | |
| Week Change: 1.74% Year-to-date Change: -6.1% | |
| SPSC Links: Profile News Message Board | |
| Charts:- Daily , Weekly | |
| Add SPSC to Watchlist: View: Get Complete SPSC Trend Analysis ➞ | |
 | BATRK The Liberty Braves Group |
| Sector: Services & Goods | |
| SubSector: Broadcasting - TV | |
| MarketCap: 638.363 Millions | |
| Recent Price: 38.55 Smart Investing & Trading Score: 57 | |
| Day Percent Change: 1.63% Day Change: 0.62 | |
| Week Change: 0.94% Year-to-date Change: -2.6% | |
| BATRK Links: Profile News Message Board | |
| Charts:- Daily , Weekly | |
| Add BATRK to Watchlist: View: Get Complete BATRK Trend Analysis ➞ | |
 | WD Walker & Dunlop, Inc. |
| Sector: Financials | |
| SubSector: Mortgage Investment | |
| MarketCap: 1312.99 Millions | |
| Recent Price: 94.23 Smart Investing & Trading Score: 57 | |
| Day Percent Change: 1.58% Day Change: 1.47 | |
| Week Change: 1.09% Year-to-date Change: -15.1% | |
| WD Links: Profile News Message Board | |
| Charts:- Daily , Weekly | |
| Add WD to Watchlist: View: Get Complete WD Trend Analysis ➞ | |
 | ALRM Alarm.com Holdings, Inc. |
| Sector: Technology | |
| SubSector: Application Software | |
| MarketCap: 2035.62 Millions | |
| Recent Price: 67.75 Smart Investing & Trading Score: 57 | |
| Day Percent Change: 1.27% Day Change: 0.85 | |
| Week Change: 2.7% Year-to-date Change: 4.8% | |
| ALRM Links: Profile News Message Board | |
| Charts:- Daily , Weekly | |
| Add ALRM to Watchlist: View: Get Complete ALRM Trend Analysis ➞ | |
 | VPG Vishay Precision Group, Inc. |
| Sector: Technology | |
| SubSector: Scientific & Technical Instruments | |
| MarketCap: 261.553 Millions | |
| Recent Price: 33.80 Smart Investing & Trading Score: 57 | |
| Day Percent Change: 1.26% Day Change: 0.42 | |
| Week Change: 1.17% Year-to-date Change: -0.8% | |
| VPG Links: Profile News Message Board | |
| Charts:- Daily , Weekly | |
| Add VPG to Watchlist: View: Get Complete VPG Trend Analysis ➞ | |
 | MRTN Marten Transport, Ltd. |
| Sector: Transports | |
| SubSector: Trucking | |
| MarketCap: 1012.15 Millions | |
| Recent Price: 17.22 Smart Investing & Trading Score: 57 | |
| Day Percent Change: 1.23% Day Change: 0.21 | |
| Week Change: 1.65% Year-to-date Change: -17.9% | |
| MRTN Links: Profile News Message Board | |
| Charts:- Daily , Weekly | |
| Add MRTN to Watchlist: View: Get Complete MRTN Trend Analysis ➞ | |
 | INDB Independent Bank Corp. |
| Sector: Financials | |
| SubSector: Regional - Northeast Banks | |
| MarketCap: 2347.09 Millions | |
| Recent Price: 51.33 Smart Investing & Trading Score: 57 | |
| Day Percent Change: 0.90% Day Change: 0.46 | |
| Week Change: -2.66% Year-to-date Change: -22.0% | |
| INDB Links: Profile News Message Board | |
| Charts:- Daily , Weekly | |
| Add INDB to Watchlist: View: Get Complete INDB Trend Analysis ➞ | |
 | BOH Bank of Hawaii Corporation |
| Sector: Financials | |
| SubSector: Regional - Pacific Banks | |
| MarketCap: 2305.19 Millions | |
| Recent Price: 58.49 Smart Investing & Trading Score: 57 | |
| Day Percent Change: 0.84% Day Change: 0.49 | |
| Week Change: -0.24% Year-to-date Change: -19.3% | |
| BOH Links: Profile News Message Board | |
| Charts:- Daily , Weekly | |
| Add BOH to Watchlist: View: Get Complete BOH Trend Analysis ➞ | |
 | RXRX Recursion Pharmaceuticals, Inc. |
| Sector: Health Care | |
| SubSector: Biotechnology | |
| MarketCap: 1470 Millions | |
| Recent Price: 8.38 Smart Investing & Trading Score: 57 | |
| Day Percent Change: 0.60% Day Change: 0.05 | |
| Week Change: 3.27% Year-to-date Change: -14.4% | |
| RXRX Links: Profile News Message Board | |
| Charts:- Daily , Weekly | |
| Add RXRX to Watchlist: View: Get Complete RXRX Trend Analysis ➞ | |
 | AMBC Ambac Financial Group, Inc. |
| Sector: Financials | |
| SubSector: Surety & Title Insurance | |
| MarketCap: 587.818 Millions | |
| Recent Price: 14.89 Smart Investing & Trading Score: 57 | |
| Day Percent Change: 0.47% Day Change: 0.07 | |
| Week Change: 2.06% Year-to-date Change: -9.7% | |
| AMBC Links: Profile News Message Board | |
| Charts:- Daily , Weekly | |
| Add AMBC to Watchlist: View: Get Complete AMBC Trend Analysis ➞ | |
 | AROC Archrock, Inc. |
| Sector: Energy | |
| SubSector: Oil & Gas Equipment & Services | |
| MarketCap: 614.961 Millions | |
| Recent Price: 20.03 Smart Investing & Trading Score: 56 | |
| Day Percent Change: 2.72% Day Change: 0.53 | |
| Week Change: -0.84% Year-to-date Change: 30.1% | |
| AROC Links: Profile News Message Board | |
| Charts:- Daily , Weekly | |
| Add AROC to Watchlist: View: Get Complete AROC Trend Analysis ➞ | |
 | GEO The GEO Group, Inc. |
| Sector: Financials | |
| SubSector: REIT - Healthcare Facilities | |
| MarketCap: 1678.34 Millions | |
| Recent Price: 14.98 Smart Investing & Trading Score: 56 | |
| Day Percent Change: 1.63% Day Change: 0.24 | |
| Week Change: 0.74% Year-to-date Change: 38.3% | |
| GEO Links: Profile News Message Board | |
| Charts:- Daily , Weekly | |
| Add GEO to Watchlist: View: Get Complete GEO Trend Analysis ➞ | |
 | CNK Cinemark Holdings, Inc. |
| Sector: Services & Goods | |
| SubSector: Movie Production, Theaters | |
| MarketCap: 1776.29 Millions | |
| Recent Price: 17.59 Smart Investing & Trading Score: 56 | |
| Day Percent Change: 0.92% Day Change: 0.16 | |
| Week Change: -0.34% Year-to-date Change: 24.8% | |
| CNK Links: Profile News Message Board | |
| Charts:- Daily , Weekly | |
| Add CNK to Watchlist: View: Get Complete CNK Trend Analysis ➞ | |
 | BSIG BrightSphere Investment Group Inc. |
| Sector: Financials | |
| SubSector: Asset Management | |
| MarketCap: 430.103 Millions | |
| Recent Price: 22.62 Smart Investing & Trading Score: 56 | |
| Day Percent Change: 0.89% Day Change: 0.20 | |
| Week Change: 0.04% Year-to-date Change: 18.1% | |
| BSIG Links: Profile News Message Board | |
| Charts:- Daily , Weekly | |
| Add BSIG to Watchlist: View: Get Complete BSIG Trend Analysis ➞ | |
 | BL BlackLine, Inc. |
| Sector: Technology | |
| SubSector: Application Software | |
| MarketCap: 2972.62 Millions | |
| Recent Price: 59.69 Smart Investing & Trading Score: 55 | |
| Day Percent Change: 3.02% Day Change: 1.75 | |
| Week Change: -1.87% Year-to-date Change: -4.4% | |
| BL Links: Profile News Message Board | |
| Charts:- Daily , Weekly | |
| Add BL to Watchlist: View: Get Complete BL Trend Analysis ➞ | |
 | TDW Tidewater Inc. |
| Sector: Energy | |
| SubSector: Oil & Gas Equipment & Services | |
| MarketCap: 295.061 Millions | |
| Recent Price: 93.89 Smart Investing & Trading Score: 55 | |
| Day Percent Change: 2.70% Day Change: 2.47 | |
| Week Change: -1.91% Year-to-date Change: 30.2% | |
| TDW Links: Profile News Message Board | |
| Charts:- Daily , Weekly | |
| Add TDW to Watchlist: View: Get Complete TDW Trend Analysis ➞ | |
 | UFPI Universal Forest Products, Inc. |
| Sector: Industrials | |
| SubSector: Lumber, Wood Production | |
| MarketCap: 2263.38 Millions | |
| Recent Price: 115.49 Smart Investing & Trading Score: 55 | |
| Day Percent Change: 2.20% Day Change: 2.49 | |
| Week Change: 1.63% Year-to-date Change: -8.0% | |
| UFPI Links: Profile News Message Board | |
| Charts:- Daily , Weekly | |
| Add UFPI to Watchlist: View: Get Complete UFPI Trend Analysis ➞ | |
 | MD MEDNAX, Inc. |
| Sector: Health Care | |
| SubSector: Specialized Health Services | |
| MarketCap: 913.656 Millions | |
| Recent Price: 9.12 Smart Investing & Trading Score: 55 | |
| Day Percent Change: 1.22% Day Change: 0.11 | |
| Week Change: 0.88% Year-to-date Change: -1.9% | |
| MD Links: Profile News Message Board | |
| Charts:- Daily , Weekly | |
| Add MD to Watchlist: View: Get Complete MD Trend Analysis ➞ | |
| Too many stocks? View smallcap stocks filtered by marketcap & sector |
| Marketcap: All SmallCap Stocks (default-no microcap), Large, Mid-Range, Small & MicroCap |
| Sector: Tech, Finance, Energy, Staples, Retail, Industrial, Materials, Utilities & Medical |
|
Best Stocks Today 12Stocks.com |
© 2024 12Stocks.com Terms & Conditions Privacy Contact Us
All Information Provided Only For Education And Not To Be Used For Investing or Trading. See Terms & Conditions


One More Thing ... Get Best Stocks Delivered Daily!
Never Ever Miss A Move With Our Top Ten Stocks Lists
Find Best Stocks In Any Market - Bull or Bear Market
Take A Peek At Our Top Ten Stocks Lists: Daily, Weekly, Year-to-Date & Top Trends
Find Best Stocks In Any Market - Bull or Bear Market
Take A Peek At Our Top Ten Stocks Lists: Daily, Weekly, Year-to-Date & Top Trends
Smallcap Stocks With Best Up Trends [0-bearish to 100-bullish]: Emergent BioSolutions[100], Aspen Aerogels[100], Carvana Co[100], Perdoceo Education[100], Gannett Co[100], Pitney Bowes[100], Benchmark Electronics[100], Origin Materials[100], FormFactor [100], Lantheus [100], Q2 [100]
Best Smallcap Stocks Year-to-Date:
Janux [440.16%], Viking [307.09%], Longboard [273.98%], Alpine Immune[239.29%], Bakkt [187.89%], Avidity Biosciences[182.96%], Vera [170.74%], Cullinan Oncology[169.74%], Super Micro[168.25%], Arcutis Bio[166.25%], Y-mAbs [152.93%] Best Smallcap Stocks This Week:
Deciphera [73.24%], Emergent BioSolutions[71.88%], Eyenovia [49.22%], Aspen Aerogels[48.14%], P3 Health[38.51%], Carvana Co[38.18%], Cue Biopharma[37.73%], Origin Materials[36.24%], TransMedics Group[35.14%], Seres [34.55%], Enovix [32.07%] Best Smallcap Stocks Daily:
Emergent BioSolutions[70.98%], Aspen Aerogels[56.70%], Carvana Co[33.77%], Perdoceo Education[31.46%], Enovix [31.06%], Office Properties[28.00%], Gannett Co[26.97%], Sunnova Energy[25.21%], Pitney Bowes[24.70%], Pulmonx [21.50%], CommScope Holding[20.95%]