
 Login Sign Up


| |||||
 |  | ||||

| 12Stocks.com Market Intelligence |
Best SmallCap Stocks
|
| In a hurry? Small Cap Stock Lists: Performance Trends Table, Stock Charts
Sort Small Cap stocks: Daily, Weekly, Year-to-Date, Market Cap & Trends. Filter Small Cap stocks list by sector: Show all, Tech, Finance, Energy, Staples, Retail, Industrial, Materials, Utilities and HealthCare Filter Small Cap stocks list by size: All Large Medium Small and MicroCap |
| 12Stocks.com Small Cap Stocks Performances & Trends Daily | |||||||||
|
|  The overall Smart Investing & Trading Score is 14 (0-bearish to 100-bullish) which puts Small Cap index in short term bearish trend. The Smart Investing & Trading Score from previous trading session is 41 and hence a deterioration of trend.
| ||||||||
Here are the Smart Investing & Trading Scores of the most requested small cap stocks at 12Stocks.com (click stock name for detailed review):
|


| 12Stocks.com: Investing in Smallcap Index with Stocks | |
|
The following table helps investors and traders sort through current performance and trends (as measured by Smart Investing & Trading Score) of various
stocks in the Smallcap Index. Quick View: Move mouse or cursor over stock symbol (ticker) to view short-term technical chart and over stock name to view long term chart. Click on  to add stock symbol to your watchlist and to add stock symbol to your watchlist and  to view watchlist. Click on any ticker or stock name for detailed market intelligence report for that stock. to view watchlist. Click on any ticker or stock name for detailed market intelligence report for that stock. |
12Stocks.com Performance of Stocks in Smallcap Index
| Ticker | Stock Name | Watchlist | Category | Recent Price | Smart Investing & Trading Score | Change % | YTD Change% |
| EWCZ | European Wax |   | Consumer Staples | 11.77 | 52 | -0.17% | -13.07% |
| HOV | Hovnanian Enterprises | | Industrials | 150.33 | 52 | 1.69% | -3.40% |
| ALHC | Alignment Healthcare | | Health Care | 5.21 | 52 | 1.26% | -41.07% |
| CENT | Central Garden | | Consumer Staples | 41.44 | 52 | 1.20% | -17.30% |
| PSMT | PriceSmart | | Services & Goods | 81.55 | 52 | 1.19% | 7.61% |
| CENTA | Central Garden | | Materials | 35.68 | 52 | 0.71% | -18.98% |
| SHLS | Shoals | | Technology | 8.47 | 52 | 0.36% | -45.32% |
| CELC | Celcuity | | Health Care | 16.26 | 51 | 3.11% | 10.91% |
| LCNB | LCNB | | Financials | 14.37 | 51 | 1.91% | -8.88% |
| SOI | Solaris Oilfield | | Energy | 8.87 | 51 | 0.68% | 11.43% |
| WIRE | Encore Wire | | Technology | 281.00 | 51 | 0.59% | 31.55% |
| RM | Regional Management | | Financials | 25.29 | 51 | 0.32% | 0.84% |
| PRDO | Perdoceo Education | | Services & Goods | 18.34 | 51 | 0.22% | 4.44% |
| AGX | Argan | | Industrials | 60.33 | 51 | 0.12% | 28.94% |
| FIP | FTAI Infrastructure | | Industrials | 7.11 | 51 | -1.80% | 82.78% |
| SMR | NuScale Power | | Industrials | 5.73 | 51 | -1.21% | 77.67% |
| AGYS | Agilysys | | Technology | 82.70 | 51 | -0.42% | -2.50% |
| EEX | Emerald Holding | | Services & Goods | 5.88 | 51 | 2.26% | -1.67% |
| XOMA | XOMA | | Health Care | 25.82 | 51 | 1.89% | 39.57% |
| EVTC | EVERTEC | | Technology | 37.62 | 51 | 0.24% | -8.11% |
| FC | Franklin Covey | | Services & Goods | 38.97 | 51 | 0.08% | -10.48% |
| KNF | Knife River | | Materials | 77.74 | 51 | -0.58% | 16.90% |
| OEC | Orion Engineered | | Materials | 23.61 | 51 | -0.21% | -14.86% |
| ACET | Aceto | | Materials | 1.52 | 50 | 2.01% | -19.58% |
| NECB | Northeast Community | | Financials | 16.16 | 50 | 1.86% | -8.91% |


| Too many stocks? View smallcap stocks filtered by marketcap & sector |
| Marketcap: All SmallCap Stocks (default-no microcap), Large, Mid-Range, Small |
| Smallcap Sector: Tech, Finance, Energy, Staples, Retail, Industrial, Materials, & Medical |
|
Get the most comprehensive stock market coverage daily at 12Stocks.com ➞ Best Stocks Today ➞ Best Stocks Weekly ➞ Best Stocks Year-to-Date ➞ Best Stocks Trends ➞  Best Stocks Today 12Stocks.com Best Nasdaq Stocks ➞ Best S&P 500 Stocks ➞ Best Tech Stocks ➞ Best Biotech Stocks ➞ |
| Detailed Overview of SmallCap Stocks |
| SmallCap Technical Overview, Leaders & Laggards, Top SmallCap ETF Funds & Detailed SmallCap Stocks List, Charts, Trends & More |
| Smallcap: Technical Analysis, Trends & YTD Performance | |
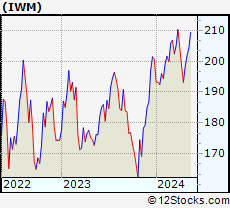
| SmallCap segment as represented by
IWM, an exchange-traded fund [ETF], holds basket of thousands of smallcap stocks from across all major sectors of the US stock market. The smallcap index (contains stocks like Riverbed & Sotheby's) is down by -2.19% and is currently underperforming the overall market by -6.73% year-to-date. Below is a quick view of technical charts and trends: | |
 IWM Weekly Chart |
|
| Long Term Trend: Not Good | |
| Medium Term Trend: Not Good | |
 IWM Daily Chart |
|
| Short Term Trend: Not Good | |
| Overall Trend Score: 14 | |
| YTD Performance: -2.19% | |
| **Trend Scores & Views Are Only For Educational Purposes And Not For Investing | |
| 12Stocks.com: Top Performing Small Cap Index Stocks | ||||||||||||||||||||||||||||||||||||||||||||||||
 The top performing Small Cap Index stocks year to date are
Now, more recently, over last week, the top performing Small Cap Index stocks on the move are


|
||||||||||||||||||||||||||||||||||||||||||||||||
| 12Stocks.com: Investing in Smallcap Index using Exchange Traded Funds | |
|
The following table shows list of key exchange traded funds (ETF) that
help investors track Smallcap index. The following list also includes leveraged ETF funds that track twice or thrice the daily returns of Smallcap indices. Short or inverse ETF funds move in the opposite direction to the index they track and are useful during market pullbacks or during bear markets. Quick View: Move mouse or cursor over ETF symbol (ticker) to view short-term technical chart and over ETF name to view long term chart. Click on ticker or stock name for detailed view. Click on to add stock symbol to your watchlist and to view watchlist. |
12Stocks.com List of ETFs that track Smallcap Index
| Ticker | ETF Name | Watchlist | Recent Price | Smart Investing & Trading Score | Change % | Week % | Year-to-date % |
| IWM | iShares Russell 2000 | | 196.31 | 14 | 0.21 | -1.05 | -2.19% |
| IJR | iShares Core S&P Small-Cap | | 104.74 | 22 | 0.34 | -0.86 | -3.24% |
| VTWO | Vanguard Russell 2000 ETF | | 79.36 | 14 | 0.25 | -1.07 | -2.15% |
| IWN | iShares Russell 2000 Value | | 149.82 | 22 | 0.52 | -0.87 | -3.55% |
| IJS | iShares S&P Small-Cap 600 Value | | 96.40 | 15 | 0.33 | -0.81 | -6.47% |
| IWO | iShares Russell 2000 Growth | | 249.58 | 7 | -0.30 | -1.39 | -1.05% |
| IJT | iShares S&P Small-Cap 600 Growth | | 124.94 | 15 | 0.27 | -0.91 | -0.16% |
| XSLV | PowerShares S&P SmallCap Low Volatil ETF | | 42.94 | 52 | 0.93 | 0.5 | -2.75% |
| SDD | ProShares UltraShort SmallCap600 | | 19.50 | 78 | -0.36 | 0.78 | 5.83% |
| SMLV | SPDR SSGA US Small Cap Low Volatil ETF | | 107.81 | 40 | 1.45 | 0.27 | -4.19% |
| SBB | ProShares Short SmallCap600 | | 16.50 | 71 | -0.30 | 0.7 | 3.58% |
| SAA | ProShares Ultra SmallCap600 | | 22.53 | 8 | -0.31 | -2.21 | -9.7% |
| 12Stocks.com: Charts, Trends, Fundamental Data and Performances of SmallCap Stocks | |
|
We now take in-depth look at all SmallCap stocks including charts, multi-period performances and overall trends (as measured by Smart Investing & Trading Score). One can sort SmallCap stocks (click link to choose) by Daily, Weekly and by Year-to-Date performances. Also, one can sort by size of the company or by market capitalization. |
| Select Your Default Chart Type: | |||||
| |||||
| Click on stock symbol or name for detailed view. Click on to add stock symbol to your watchlist and to view watchlist. Quick View: Move mouse or cursor over "Daily" to quickly view daily technical stock chart and over "Weekly" to view weekly technical stock chart. | |||||

 | EWCZ European Wax Center, Inc. |
| Sector: Consumer Staples | |
| SubSector: Household & Personal Products | |
| MarketCap: 1180 Millions | |
| Recent Price: 11.77 Smart Investing & Trading Score: 52 | |
| Day Percent Change: -0.17% Day Change: -0.02 | |
| Week Change: 1.12% Year-to-date Change: -13.1% | |
| EWCZ Links: Profile News Message Board | |
| Charts:- Daily , Weekly | |
| Add EWCZ to Watchlist: View: Get Complete EWCZ Trend Analysis ➞ | |
 | HOV Hovnanian Enterprises, Inc. |
| Sector: Industrials | |
| SubSector: Residential Construction | |
| MarketCap: 59.9106 Millions | |
| Recent Price: 150.33 Smart Investing & Trading Score: 52 | |
| Day Percent Change: 1.69% Day Change: 2.50 | |
| Week Change: 0.21% Year-to-date Change: -3.4% | |
| HOV Links: Profile News Message Board | |
| Charts:- Daily , Weekly | |
| Add HOV to Watchlist: View: Get Complete HOV Trend Analysis ➞ | |
 | ALHC Alignment Healthcare, Inc. |
| Sector: Health Care | |
| SubSector: Healthcare Plans | |
| MarketCap: 1100 Millions | |
| Recent Price: 5.21 Smart Investing & Trading Score: 52 | |
| Day Percent Change: 1.26% Day Change: 0.06 | |
| Week Change: -0.19% Year-to-date Change: -41.1% | |
| ALHC Links: Profile News Message Board | |
| Charts:- Daily , Weekly | |
| Add ALHC to Watchlist: View: Get Complete ALHC Trend Analysis ➞ | |
 | CENT Central Garden & Pet Company |
| Sector: Consumer Staples | |
| SubSector: Food - Major Diversified | |
| MarketCap: 1396.43 Millions | |
| Recent Price: 41.44 Smart Investing & Trading Score: 52 | |
| Day Percent Change: 1.20% Day Change: 0.49 | |
| Week Change: 0.36% Year-to-date Change: -17.3% | |
| CENT Links: Profile News Message Board | |
| Charts:- Daily , Weekly | |
| Add CENT to Watchlist: View: Get Complete CENT Trend Analysis ➞ | |
 | PSMT PriceSmart, Inc. |
| Sector: Services & Goods | |
| SubSector: Discount, Variety Stores | |
| MarketCap: 1655.72 Millions | |
| Recent Price: 81.55 Smart Investing & Trading Score: 52 | |
| Day Percent Change: 1.19% Day Change: 0.96 | |
| Week Change: 0.07% Year-to-date Change: 7.6% | |
| PSMT Links: Profile News Message Board | |
| Charts:- Daily , Weekly | |
| Add PSMT to Watchlist: View: Get Complete PSMT Trend Analysis ➞ | |
 | CENTA Central Garden & Pet Company |
| Sector: Materials | |
| SubSector: Agricultural Chemicals | |
| MarketCap: 953 Millions | |
| Recent Price: 35.68 Smart Investing & Trading Score: 52 | |
| Day Percent Change: 0.71% Day Change: 0.25 | |
| Week Change: 0.39% Year-to-date Change: -19.0% | |
| CENTA Links: Profile News Message Board | |
| Charts:- Daily , Weekly | |
| Add CENTA to Watchlist: View: Get Complete CENTA Trend Analysis ➞ | |
 | SHLS Shoals Technologies Group, Inc. |
| Sector: Technology | |
| SubSector: Solar | |
| MarketCap: 4360 Millions | |
| Recent Price: 8.47 Smart Investing & Trading Score: 52 | |
| Day Percent Change: 0.36% Day Change: 0.03 | |
| Week Change: -0.59% Year-to-date Change: -45.3% | |
| SHLS Links: Profile News Message Board | |
| Charts:- Daily , Weekly | |
| Add SHLS to Watchlist: View: Get Complete SHLS Trend Analysis ➞ | |
 | CELC Celcuity Inc. |
| Sector: Health Care | |
| SubSector: Medical Laboratories & Research | |
| MarketCap: 70.53 Millions | |
| Recent Price: 16.26 Smart Investing & Trading Score: 51 | |
| Day Percent Change: 3.11% Day Change: 0.49 | |
| Week Change: 2.14% Year-to-date Change: 10.9% | |
| CELC Links: Profile News Message Board | |
| Charts:- Daily , Weekly | |
| Add CELC to Watchlist: View: Get Complete CELC Trend Analysis ➞ | |
 | LCNB LCNB Corp. |
| Sector: Financials | |
| SubSector: Regional - Mid-Atlantic Banks | |
| MarketCap: 176.759 Millions | |
| Recent Price: 14.37 Smart Investing & Trading Score: 51 | |
| Day Percent Change: 1.91% Day Change: 0.27 | |
| Week Change: -5.71% Year-to-date Change: -8.9% | |
| LCNB Links: Profile News Message Board | |
| Charts:- Daily , Weekly | |
| Add LCNB to Watchlist: View: Get Complete LCNB Trend Analysis ➞ | |
 | SOI Solaris Oilfield Infrastructure, Inc. |
| Sector: Energy | |
| SubSector: Oil & Gas Equipment & Services | |
| MarketCap: 267.361 Millions | |
| Recent Price: 8.87 Smart Investing & Trading Score: 51 | |
| Day Percent Change: 0.68% Day Change: 0.06 | |
| Week Change: -7.99% Year-to-date Change: 11.4% | |
| SOI Links: Profile News Message Board | |
| Charts:- Daily , Weekly | |
| Add SOI to Watchlist: View: Get Complete SOI Trend Analysis ➞ | |
 | WIRE Encore Wire Corporation |
| Sector: Technology | |
| SubSector: Diversified Electronics | |
| MarketCap: 898.896 Millions | |
| Recent Price: 281.00 Smart Investing & Trading Score: 51 | |
| Day Percent Change: 0.59% Day Change: 1.64 | |
| Week Change: -1.37% Year-to-date Change: 31.6% | |
| WIRE Links: Profile News Message Board | |
| Charts:- Daily , Weekly | |
| Add WIRE to Watchlist: View: Get Complete WIRE Trend Analysis ➞ | |
 | RM Regional Management Corp. |
| Sector: Financials | |
| SubSector: Credit Services | |
| MarketCap: 148.008 Millions | |
| Recent Price: 25.29 Smart Investing & Trading Score: 51 | |
| Day Percent Change: 0.32% Day Change: 0.08 | |
| Week Change: -4.28% Year-to-date Change: 0.8% | |
| RM Links: Profile News Message Board | |
| Charts:- Daily , Weekly | |
| Add RM to Watchlist: View: Get Complete RM Trend Analysis ➞ | |
 | PRDO Perdoceo Education Corporation |
| Sector: Services & Goods | |
| SubSector: Education & Training Services | |
| MarketCap: 631.006 Millions | |
| Recent Price: 18.34 Smart Investing & Trading Score: 51 | |
| Day Percent Change: 0.22% Day Change: 0.04 | |
| Week Change: -2.76% Year-to-date Change: 4.4% | |
| PRDO Links: Profile News Message Board | |
| Charts:- Daily , Weekly | |
| Add PRDO to Watchlist: View: Get Complete PRDO Trend Analysis ➞ | |
 | AGX Argan, Inc. |
| Sector: Industrials | |
| SubSector: Heavy Construction | |
| MarketCap: 664.095 Millions | |
| Recent Price: 60.33 Smart Investing & Trading Score: 51 | |
| Day Percent Change: 0.12% Day Change: 0.07 | |
| Week Change: -2.66% Year-to-date Change: 28.9% | |
| AGX Links: Profile News Message Board | |
| Charts:- Daily , Weekly | |
| Add AGX to Watchlist: View: Get Complete AGX Trend Analysis ➞ | |
 | FIP FTAI Infrastructure Inc. |
| Sector: Industrials | |
| SubSector: Industrials | |
| MarketCap: 368 Millions | |
| Recent Price: 7.11 Smart Investing & Trading Score: 51 | |
| Day Percent Change: -1.80% Day Change: -0.13 | |
| Week Change: -2.74% Year-to-date Change: 82.8% | |
| FIP Links: Profile News Message Board | |
| Charts:- Daily , Weekly | |
| Add FIP to Watchlist: View: Get Complete FIP Trend Analysis ➞ | |
 | SMR NuScale Power Corporation |
| Sector: Industrials | |
| SubSector: Specialty Industrial Machinery | |
| MarketCap: 1510 Millions | |
| Recent Price: 5.73 Smart Investing & Trading Score: 51 | |
| Day Percent Change: -1.21% Day Change: -0.07 | |
| Week Change: -5.45% Year-to-date Change: 77.7% | |
| SMR Links: Profile News Message Board | |
| Charts:- Daily , Weekly | |
| Add SMR to Watchlist: View: Get Complete SMR Trend Analysis ➞ | |
 | AGYS Agilysys, Inc. |
| Sector: Technology | |
| SubSector: Application Software | |
| MarketCap: 391.862 Millions | |
| Recent Price: 82.70 Smart Investing & Trading Score: 51 | |
| Day Percent Change: -0.42% Day Change: -0.35 | |
| Week Change: -0.36% Year-to-date Change: -2.5% | |
| AGYS Links: Profile News Message Board | |
| Charts:- Daily , Weekly | |
| Add AGYS to Watchlist: View: Get Complete AGYS Trend Analysis ➞ | |
 | EEX Emerald Holding, Inc. |
| Sector: Services & Goods | |
| SubSector: Business Services | |
| MarketCap: 252.682 Millions | |
| Recent Price: 5.88 Smart Investing & Trading Score: 51 | |
| Day Percent Change: 2.26% Day Change: 0.13 | |
| Week Change: 0.34% Year-to-date Change: -1.7% | |
| EEX Links: Profile News Message Board | |
| Charts:- Daily , Weekly | |
| Add EEX to Watchlist: View: Get Complete EEX Trend Analysis ➞ | |
 | XOMA XOMA Corporation |
| Sector: Health Care | |
| SubSector: Biotechnology | |
| MarketCap: 174.885 Millions | |
| Recent Price: 25.82 Smart Investing & Trading Score: 51 | |
| Day Percent Change: 1.89% Day Change: 0.48 | |
| Week Change: 1.61% Year-to-date Change: 39.6% | |
| XOMA Links: Profile News Message Board | |
| Charts:- Daily , Weekly | |
| Add XOMA to Watchlist: View: Get Complete XOMA Trend Analysis ➞ | |
 | EVTC EVERTEC, Inc. |
| Sector: Technology | |
| SubSector: Business Software & Services | |
| MarketCap: 1646.08 Millions | |
| Recent Price: 37.62 Smart Investing & Trading Score: 51 | |
| Day Percent Change: 0.24% Day Change: 0.09 | |
| Week Change: -2.11% Year-to-date Change: -8.1% | |
| EVTC Links: Profile News Message Board | |
| Charts:- Daily , Weekly | |
| Add EVTC to Watchlist: View: Get Complete EVTC Trend Analysis ➞ | |
 | FC Franklin Covey Co. |
| Sector: Services & Goods | |
| SubSector: Education & Training Services | |
| MarketCap: 243.306 Millions | |
| Recent Price: 38.97 Smart Investing & Trading Score: 51 | |
| Day Percent Change: 0.08% Day Change: 0.03 | |
| Week Change: -1.44% Year-to-date Change: -10.5% | |
| FC Links: Profile News Message Board | |
| Charts:- Daily , Weekly | |
| Add FC to Watchlist: View: Get Complete FC Trend Analysis ➞ | |
 | KNF Knife River Corporation |
| Sector: Materials | |
| SubSector: Building Materials | |
| MarketCap: 2570 Millions | |
| Recent Price: 77.74 Smart Investing & Trading Score: 51 | |
| Day Percent Change: -0.58% Day Change: -0.45 | |
| Week Change: -0.65% Year-to-date Change: 16.9% | |
| KNF Links: Profile News Message Board | |
| Charts:- Daily , Weekly | |
| Add KNF to Watchlist: View: Get Complete KNF Trend Analysis ➞ | |
 | OEC Orion Engineered Carbons S.A. |
| Sector: Materials | |
| SubSector: Specialty Chemicals | |
| MarketCap: 493.457 Millions | |
| Recent Price: 23.61 Smart Investing & Trading Score: 51 | |
| Day Percent Change: -0.21% Day Change: -0.05 | |
| Week Change: -0.46% Year-to-date Change: -14.9% | |
| OEC Links: Profile News Message Board | |
| Charts:- Daily , Weekly | |
| Add OEC to Watchlist: View: Get Complete OEC Trend Analysis ➞ | |
 | ACET Aceto Corporation |
| Sector: Materials | |
| SubSector: Chemicals - Major Diversified | |
| MarketCap: 453.16 Millions | |
| Recent Price: 1.52 Smart Investing & Trading Score: 50 | |
| Day Percent Change: 2.01% Day Change: 0.03 | |
| Week Change: -9.52% Year-to-date Change: -19.6% | |
| ACET Links: Profile News Message Board | |
| Charts:- Daily , Weekly | |
| Add ACET to Watchlist: View: Get Complete ACET Trend Analysis ➞ | |
 | NECB Northeast Community Bancorp, Inc. |
| Sector: Financials | |
| SubSector: Savings & Loans | |
| MarketCap: 99.31 Millions | |
| Recent Price: 16.16 Smart Investing & Trading Score: 50 | |
| Day Percent Change: 1.86% Day Change: 0.29 | |
| Week Change: 1.76% Year-to-date Change: -8.9% | |
| NECB Links: Profile News Message Board | |
| Charts:- Daily , Weekly | |
| Add NECB to Watchlist: View: Get Complete NECB Trend Analysis ➞ | |
| Too many stocks? View smallcap stocks filtered by marketcap & sector |
| Marketcap: All SmallCap Stocks (default-no microcap), Large, Mid-Range, Small & MicroCap |
| Sector: Tech, Finance, Energy, Staples, Retail, Industrial, Materials, Utilities & Medical |
|
Best Stocks Today 12Stocks.com |
© 2024 12Stocks.com Terms & Conditions Privacy Contact Us
All Information Provided Only For Education And Not To Be Used For Investing or Trading. See Terms & Conditions


One More Thing ... Get Best Stocks Delivered Daily!
Never Ever Miss A Move With Our Top Ten Stocks Lists
Find Best Stocks In Any Market - Bull or Bear Market
Take A Peek At Our Top Ten Stocks Lists: Daily, Weekly, Year-to-Date & Top Trends
Find Best Stocks In Any Market - Bull or Bear Market
Take A Peek At Our Top Ten Stocks Lists: Daily, Weekly, Year-to-Date & Top Trends
Smallcap Stocks With Best Up Trends [0-bearish to 100-bullish]: Surmodics [100], Rocky Brands[100], TransMedics Group[100], LendingClub [100], Summit [100], A10 s[100], Carpenter [100], UFP [100], PROCEPT BioRobotics[100], Xencor [100], Trinity Industries[100]
Best Smallcap Stocks Year-to-Date:
Janux [441.55%], Viking [310.69%], Longboard [259.25%], Alpine Immune[239.26%], Avidity Biosciences[185.4%], Bakkt [182.96%], Cullinan Oncology[175.33%], Arcutis Bio[173.68%], Vera [173.32%], Super Micro[159.73%], Y-mAbs [141.79%] Best Smallcap Stocks This Week:
Deciphera [73.11%], Eyenovia [44.86%], Cue Biopharma[39.56%], Seres [30.91%], Poseida [30.52%], P3 Health[29.62%], Phibro Animal[28.44%], TransMedics Group[27.72%], Surmodics [27.36%], LendingTree [26.36%], Rocky Brands[24.92%] Best Smallcap Stocks Daily:
Surmodics [29.74%], Rocky Brands[28.41%], TransMedics Group[24.93%], Ventyx Biosciences[24.63%], Eyenovia [21.17%], LendingClub [19.68%], Summit [19.59%], Powell Industries[18.89%], MiMedx Group[18.67%], CareDx [18.30%], A10 s[17.69%]