
 Login Sign Up


| |||||
 |  | ||||

| 12Stocks.com Market Intelligence |
Best SmallCap Stocks
|
| In a hurry? Small Cap Stock Lists: Performance Trends Table, Stock Charts
Sort Small Cap stocks: Daily, Weekly, Year-to-Date, Market Cap & Trends. Filter Small Cap stocks list by sector: Show all, Tech, Finance, Energy, Staples, Retail, Industrial, Materials, Utilities and HealthCare Filter Small Cap stocks list by size: All Large Medium Small and MicroCap |
| 12Stocks.com Small Cap Stocks Performances & Trends Daily | |||||||||
|
|  The overall Smart Investing & Trading Score is 88 (0-bearish to 100-bullish) which puts Small Cap index in short term bullish trend. The Smart Investing & Trading Score from previous trading session is 56 and hence an improvement of trend.
| ||||||||
Here are the Smart Investing & Trading Scores of the most requested small cap stocks at 12Stocks.com (click stock name for detailed review):
|


| 12Stocks.com: Investing in Smallcap Index with Stocks | |
|
The following table helps investors and traders sort through current performance and trends (as measured by Smart Investing & Trading Score) of various
stocks in the Smallcap Index. Quick View: Move mouse or cursor over stock symbol (ticker) to view short-term technical chart and over stock name to view long term chart. Click on  to add stock symbol to your watchlist and to add stock symbol to your watchlist and  to view watchlist. Click on any ticker or stock name for detailed market intelligence report for that stock. to view watchlist. Click on any ticker or stock name for detailed market intelligence report for that stock. |
12Stocks.com Performance of Stocks in Smallcap Index
| Ticker | Stock Name | Watchlist | Category | Recent Price | Smart Investing & Trading Score | Change % | YTD Change% |
| SIBN | SI-BONE |   | Health Care | 14.66 | 27 | 0.62% | -30.16% |
| BCOV | Brightcove | | Technology | 1.64 | 27 | 0.61% | -36.68% |
| OFLX | Omega Flex | | Industrials | 67.08 | 27 | 0.34% | -4.87% |
| CLDT | Chatham Lodging | | Financials | 9.33 | 27 | 0.32% | -12.97% |
| XERS | Xeris | | Health Care | 1.75 | 27 | 0.29% | -25.48% |
| DCGO | DocGo | | Health Care | 3.62 | 27 | 0.28% | -35.24% |
| LIND | Lindblad Expeditions | | Consumer Staples | 7.31 | 27 | 0.27% | -35.14% |
| WALD | Waldencast | | Technology | 5.16 | 27 | 0.19% | -54.32% |
| PECO | Phillips Edison | | Financials | 32.67 | 27 | 0.18% | -11.30% |
| AXGN | AxoGen | | Health Care | 6.64 | 27 | 0.15% | -2.78% |
| FEAM | 5E Advanced | | Materials | 1.11 | 27 | -2.21% | -21.63% |
| EHTH | eHealth | | Financials | 4.44 | 27 | -1.99% | -49.08% |
| XAIR | Beyond Air | | Health Care | 1.15 | 27 | -1.29% | -41.33% |
| FRGE | Forge Global | | Technology | 1.90 | 27 | -1.04% | -46.78% |
| AKRO | Akero | | Health Care | 19.57 | 27 | -0.86% | -16.19% |
| FOLD | Amicus | | Health Care | 10.25 | 27 | -0.29% | -27.77% |
| TWI | Titan | | Industrials | 11.53 | 27 | -0.17% | -22.51% |
| SPWH | Sportsman s | | Consumer Staples | 3.29 | 27 | -0.15% | -22.65% |
| CALM | Cal-Maine Foods | | Consumer Staples | 57.62 | 26 | 1.32% | 0.40% |
| XFOR | X4 | | Health Care | 1.18 | 26 | 1.29% | 40.73% |
| ARCB | ArcBest | | Transports | 129.25 | 26 | 1.06% | 7.52% |
| BARK | BARK | | Services & Goods | 1.10 | 26 | 0.00% | 37.47% |
| CBZ | CBIZ | | Services & Goods | 71.97 | 26 | -1.09% | 14.99% |
| PKST | Peakstone Realty | | Financials | 14.44 | 25 | 4.03% | -29.63% |
| PSFE | Paysafe | | Technology | 14.65 | 25 | 1.31% | 13.57% |


| Too many stocks? View smallcap stocks filtered by marketcap & sector |
| Marketcap: All SmallCap Stocks (default-no microcap), Large, Mid-Range, Small |
| Smallcap Sector: Tech, Finance, Energy, Staples, Retail, Industrial, Materials, & Medical |
|
Get the most comprehensive stock market coverage daily at 12Stocks.com ➞ Best Stocks Today ➞ Best Stocks Weekly ➞ Best Stocks Year-to-Date ➞ Best Stocks Trends ➞  Best Stocks Today 12Stocks.com Best Nasdaq Stocks ➞ Best S&P 500 Stocks ➞ Best Tech Stocks ➞ Best Biotech Stocks ➞ |
| Detailed Overview of SmallCap Stocks |
| SmallCap Technical Overview, Leaders & Laggards, Top SmallCap ETF Funds & Detailed SmallCap Stocks List, Charts, Trends & More |
| Smallcap: Technical Analysis, Trends & YTD Performance | |
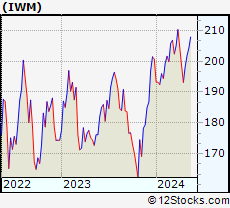
| SmallCap segment as represented by
IWM, an exchange-traded fund [ETF], holds basket of thousands of smallcap stocks from across all major sectors of the US stock market. The smallcap index (contains stocks like Riverbed & Sotheby's) is down by -0.37% and is currently underperforming the overall market by -6.93% year-to-date. Below is a quick view of technical charts and trends: | |
 IWM Weekly Chart |
|
| Long Term Trend: Very Good | |
| Medium Term Trend: Good | |
 IWM Daily Chart |
|
| Short Term Trend: Very Good | |
| Overall Trend Score: 88 | |
| YTD Performance: -0.37% | |
| **Trend Scores & Views Are Only For Educational Purposes And Not For Investing | |
| 12Stocks.com: Top Performing Small Cap Index Stocks | ||||||||||||||||||||||||||||||||||||||||||||||||
 The top performing Small Cap Index stocks year to date are
Now, more recently, over last week, the top performing Small Cap Index stocks on the move are


|
||||||||||||||||||||||||||||||||||||||||||||||||
| 12Stocks.com: Investing in Smallcap Index using Exchange Traded Funds | |
|
The following table shows list of key exchange traded funds (ETF) that
help investors track Smallcap index. The following list also includes leveraged ETF funds that track twice or thrice the daily returns of Smallcap indices. Short or inverse ETF funds move in the opposite direction to the index they track and are useful during market pullbacks or during bear markets. Quick View: Move mouse or cursor over ETF symbol (ticker) to view short-term technical chart and over ETF name to view long term chart. Click on ticker or stock name for detailed view. Click on to add stock symbol to your watchlist and to view watchlist. |
12Stocks.com List of ETFs that track Smallcap Index
| Ticker | ETF Name | Watchlist | Recent Price | Smart Investing & Trading Score | Change % | Week % | Year-to-date % |
| IWM | iShares Russell 2000 | | 199.96 | 88 | 0.79 | 0.79 | -0.37% |
| IJR | iShares Core S&P Small-Cap | | 106.41 | 93 | 0.72 | 0.72 | -1.7% |
| VTWO | Vanguard Russell 2000 ETF | | 80.78 | 88 | 0.70 | 0.7 | -0.39% |
| IWN | iShares Russell 2000 Value | | 152.05 | 93 | 0.60 | 0.6 | -2.11% |
| IWO | iShares Russell 2000 Growth | | 255.74 | 78 | 1.05 | 1.05 | 1.4% |
| IJS | iShares S&P Small-Cap 600 Value | | 97.95 | 70 | 0.78 | 0.78 | -4.97% |
| IJT | iShares S&P Small-Cap 600 Growth | | 126.96 | 88 | 0.69 | 0.69 | 1.45% |
| XSLV | PowerShares S&P SmallCap Low Volatil ETF | | 42.87 | 80 | 0.35 | 0.35 | -2.9% |
| SMLV | SPDR SSGA US Small Cap Low Volatil ETF | | 107.77 | 68 | 0.23 | 0.23 | -4.22% |
| SAA | ProShares Ultra SmallCap600 | | 23.27 | 88 | 1.00 | 1 | -6.73% |
| SBB | ProShares Short SmallCap600 | | 16.28 | 8 | -0.64 | -0.64 | 2.2% |
| SDD | ProShares UltraShort SmallCap600 | | 19.09 | 15 | -1.34 | -1.34 | 3.6% |
| 12Stocks.com: Charts, Trends, Fundamental Data and Performances of SmallCap Stocks | |
|
We now take in-depth look at all SmallCap stocks including charts, multi-period performances and overall trends (as measured by Smart Investing & Trading Score). One can sort SmallCap stocks (click link to choose) by Daily, Weekly and by Year-to-Date performances. Also, one can sort by size of the company or by market capitalization. |
| Select Your Default Chart Type: | |||||
| |||||
| Click on stock symbol or name for detailed view. Click on to add stock symbol to your watchlist and to view watchlist. Quick View: Move mouse or cursor over "Daily" to quickly view daily technical stock chart and over "Weekly" to view weekly technical stock chart. | |||||

 | SIBN SI-BONE, Inc. |
| Sector: Health Care | |
| SubSector: Medical Appliances & Equipment | |
| MarketCap: 234.78 Millions | |
| Recent Price: 14.66 Smart Investing & Trading Score: 27 | |
| Day Percent Change: 0.62% Day Change: 0.09 | |
| Week Change: 0.62% Year-to-date Change: -30.2% | |
| SIBN Links: Profile News Message Board | |
| Charts:- Daily , Weekly | |
| Add SIBN to Watchlist: View: Get Complete SIBN Trend Analysis ➞ | |
 | BCOV Brightcove Inc. |
| Sector: Technology | |
| SubSector: Application Software | |
| MarketCap: 266.162 Millions | |
| Recent Price: 1.64 Smart Investing & Trading Score: 27 | |
| Day Percent Change: 0.61% Day Change: 0.01 | |
| Week Change: 0.61% Year-to-date Change: -36.7% | |
| BCOV Links: Profile News Message Board | |
| Charts:- Daily , Weekly | |
| Add BCOV to Watchlist: View: Get Complete BCOV Trend Analysis ➞ | |
 | OFLX Omega Flex, Inc. |
| Sector: Industrials | |
| SubSector: Industrial Equipment & Components | |
| MarketCap: 590.609 Millions | |
| Recent Price: 67.08 Smart Investing & Trading Score: 27 | |
| Day Percent Change: 0.34% Day Change: 0.23 | |
| Week Change: 0.34% Year-to-date Change: -4.9% | |
| OFLX Links: Profile News Message Board | |
| Charts:- Daily , Weekly | |
| Add OFLX to Watchlist: View: Get Complete OFLX Trend Analysis ➞ | |
 | CLDT Chatham Lodging Trust |
| Sector: Financials | |
| SubSector: REIT - Hotel/Motel | |
| MarketCap: 274.734 Millions | |
| Recent Price: 9.33 Smart Investing & Trading Score: 27 | |
| Day Percent Change: 0.32% Day Change: 0.03 | |
| Week Change: 0.32% Year-to-date Change: -13.0% | |
| CLDT Links: Profile News Message Board | |
| Charts:- Daily , Weekly | |
| Add CLDT to Watchlist: View: Get Complete CLDT Trend Analysis ➞ | |
 | XERS Xeris Pharmaceuticals, Inc. |
| Sector: Health Care | |
| SubSector: Biotechnology | |
| MarketCap: 74.5785 Millions | |
| Recent Price: 1.75 Smart Investing & Trading Score: 27 | |
| Day Percent Change: 0.29% Day Change: 0.00 | |
| Week Change: 0.29% Year-to-date Change: -25.5% | |
| XERS Links: Profile News Message Board | |
| Charts:- Daily , Weekly | |
| Add XERS to Watchlist: View: Get Complete XERS Trend Analysis ➞ | |
 | DCGO DocGo Inc. |
| Sector: Health Care | |
| SubSector: Medical Care Facilities | |
| MarketCap: 972 Millions | |
| Recent Price: 3.62 Smart Investing & Trading Score: 27 | |
| Day Percent Change: 0.28% Day Change: 0.01 | |
| Week Change: 0.28% Year-to-date Change: -35.2% | |
| DCGO Links: Profile News Message Board | |
| Charts:- Daily , Weekly | |
| Add DCGO to Watchlist: View: Get Complete DCGO Trend Analysis ➞ | |
 | LIND Lindblad Expeditions Holdings, Inc. |
| Sector: Consumer Staples | |
| SubSector: Recreational Goods, Other | |
| MarketCap: 220.259 Millions | |
| Recent Price: 7.31 Smart Investing & Trading Score: 27 | |
| Day Percent Change: 0.27% Day Change: 0.02 | |
| Week Change: 0.27% Year-to-date Change: -35.1% | |
| LIND Links: Profile News Message Board | |
| Charts:- Daily , Weekly | |
| Add LIND to Watchlist: View: Get Complete LIND Trend Analysis ➞ | |
 | WALD Waldencast plc |
| Sector: Technology | |
| SubSector: Software - Application | |
| MarketCap: 897 Millions | |
| Recent Price: 5.16 Smart Investing & Trading Score: 27 | |
| Day Percent Change: 0.19% Day Change: 0.01 | |
| Week Change: 0.19% Year-to-date Change: -54.3% | |
| WALD Links: Profile News Message Board | |
| Charts:- Daily , Weekly | |
| Add WALD to Watchlist: View: Get Complete WALD Trend Analysis ➞ | |
 | PECO Phillips Edison & Company, Inc. |
| Sector: Financials | |
| SubSector: REIT - Retail | |
| MarketCap: 3920 Millions | |
| Recent Price: 32.67 Smart Investing & Trading Score: 27 | |
| Day Percent Change: 0.18% Day Change: 0.06 | |
| Week Change: 0.18% Year-to-date Change: -11.3% | |
| PECO Links: Profile News Message Board | |
| Charts:- Daily , Weekly | |
| Add PECO to Watchlist: View: Get Complete PECO Trend Analysis ➞ | |
 | AXGN AxoGen, Inc. |
| Sector: Health Care | |
| SubSector: Medical Appliances & Equipment | |
| MarketCap: 349.28 Millions | |
| Recent Price: 6.64 Smart Investing & Trading Score: 27 | |
| Day Percent Change: 0.15% Day Change: 0.01 | |
| Week Change: 0.15% Year-to-date Change: -2.8% | |
| AXGN Links: Profile News Message Board | |
| Charts:- Daily , Weekly | |
| Add AXGN to Watchlist: View: Get Complete AXGN Trend Analysis ➞ | |
 | FEAM 5E Advanced Materials Inc. |
| Sector: Materials | |
| SubSector: Specialty Chemicals | |
| MarketCap: 247 Millions | |
| Recent Price: 1.11 Smart Investing & Trading Score: 27 | |
| Day Percent Change: -2.21% Day Change: -0.02 | |
| Week Change: -2.21% Year-to-date Change: -21.6% | |
| FEAM Links: Profile News Message Board | |
| Charts:- Daily , Weekly | |
| Add FEAM to Watchlist: View: Get Complete FEAM Trend Analysis ➞ | |
 | EHTH eHealth, Inc. |
| Sector: Financials | |
| SubSector: Insurance Brokers | |
| MarketCap: 2813.57 Millions | |
| Recent Price: 4.44 Smart Investing & Trading Score: 27 | |
| Day Percent Change: -1.99% Day Change: -0.09 | |
| Week Change: -1.99% Year-to-date Change: -49.1% | |
| EHTH Links: Profile News Message Board | |
| Charts:- Daily , Weekly | |
| Add EHTH to Watchlist: View: Get Complete EHTH Trend Analysis ➞ | |
 | XAIR Beyond Air, Inc. |
| Sector: Health Care | |
| SubSector: Medical Appliances & Equipment | |
| MarketCap: 132.48 Millions | |
| Recent Price: 1.15 Smart Investing & Trading Score: 27 | |
| Day Percent Change: -1.29% Day Change: -0.02 | |
| Week Change: -1.29% Year-to-date Change: -41.3% | |
| XAIR Links: Profile News Message Board | |
| Charts:- Daily , Weekly | |
| Add XAIR to Watchlist: View: Get Complete XAIR Trend Analysis ➞ | |
 | FRGE Forge Global Holdings, Inc. |
| Sector: Technology | |
| SubSector: Software - Application | |
| MarketCap: 426 Millions | |
| Recent Price: 1.90 Smart Investing & Trading Score: 27 | |
| Day Percent Change: -1.04% Day Change: -0.02 | |
| Week Change: -1.04% Year-to-date Change: -46.8% | |
| FRGE Links: Profile News Message Board | |
| Charts:- Daily , Weekly | |
| Add FRGE to Watchlist: View: Get Complete FRGE Trend Analysis ➞ | |
 | AKRO Akero Therapeutics, Inc. |
| Sector: Health Care | |
| SubSector: Biotechnology | |
| MarketCap: 675.085 Millions | |
| Recent Price: 19.57 Smart Investing & Trading Score: 27 | |
| Day Percent Change: -0.86% Day Change: -0.17 | |
| Week Change: -0.86% Year-to-date Change: -16.2% | |
| AKRO Links: Profile News Message Board | |
| Charts:- Daily , Weekly | |
| Add AKRO to Watchlist: View: Get Complete AKRO Trend Analysis ➞ | |
 | FOLD Amicus Therapeutics, Inc. |
| Sector: Health Care | |
| SubSector: Biotechnology | |
| MarketCap: 2676.75 Millions | |
| Recent Price: 10.25 Smart Investing & Trading Score: 27 | |
| Day Percent Change: -0.29% Day Change: -0.03 | |
| Week Change: -0.29% Year-to-date Change: -27.8% | |
| FOLD Links: Profile News Message Board | |
| Charts:- Daily , Weekly | |
| Add FOLD to Watchlist: View: Get Complete FOLD Trend Analysis ➞ | |
 | TWI Titan International, Inc. |
| Sector: Industrials | |
| SubSector: Farm & Construction Machinery | |
| MarketCap: 104.607 Millions | |
| Recent Price: 11.53 Smart Investing & Trading Score: 27 | |
| Day Percent Change: -0.17% Day Change: -0.02 | |
| Week Change: -0.17% Year-to-date Change: -22.5% | |
| TWI Links: Profile News Message Board | |
| Charts:- Daily , Weekly | |
| Add TWI to Watchlist: View: Get Complete TWI Trend Analysis ➞ | |
 | SPWH Sportsman s Warehouse Holdings, Inc. |
| Sector: Consumer Staples | |
| SubSector: Sporting Goods | |
| MarketCap: 247.144 Millions | |
| Recent Price: 3.29 Smart Investing & Trading Score: 27 | |
| Day Percent Change: -0.15% Day Change: 0.00 | |
| Week Change: -0.15% Year-to-date Change: -22.7% | |
| SPWH Links: Profile News Message Board | |
| Charts:- Daily , Weekly | |
| Add SPWH to Watchlist: View: Get Complete SPWH Trend Analysis ➞ | |
 | CALM Cal-Maine Foods, Inc. |
| Sector: Consumer Staples | |
| SubSector: Food - Major Diversified | |
| MarketCap: 2177.13 Millions | |
| Recent Price: 57.62 Smart Investing & Trading Score: 26 | |
| Day Percent Change: 1.32% Day Change: 0.75 | |
| Week Change: 1.32% Year-to-date Change: 0.4% | |
| CALM Links: Profile News Message Board | |
| Charts:- Daily , Weekly | |
| Add CALM to Watchlist: View: Get Complete CALM Trend Analysis ➞ | |
 | XFOR X4 Pharmaceuticals, Inc. |
| Sector: Health Care | |
| SubSector: Biotechnology | |
| MarketCap: 143.385 Millions | |
| Recent Price: 1.18 Smart Investing & Trading Score: 26 | |
| Day Percent Change: 1.29% Day Change: 0.01 | |
| Week Change: 1.29% Year-to-date Change: 40.7% | |
| XFOR Links: Profile News Message Board | |
| Charts:- Daily , Weekly | |
| Add XFOR to Watchlist: View: Get Complete XFOR Trend Analysis ➞ | |
 | ARCB ArcBest Corporation |
| Sector: Transports | |
| SubSector: Trucking | |
| MarketCap: 515.415 Millions | |
| Recent Price: 129.25 Smart Investing & Trading Score: 26 | |
| Day Percent Change: 1.06% Day Change: 1.36 | |
| Week Change: 1.06% Year-to-date Change: 7.5% | |
| ARCB Links: Profile News Message Board | |
| Charts:- Daily , Weekly | |
| Add ARCB to Watchlist: View: Get Complete ARCB Trend Analysis ➞ | |
 | BARK BARK, Inc. |
| Sector: Services & Goods | |
| SubSector: Specialty Retail | |
| MarketCap: 234 Millions | |
| Recent Price: 1.10 Smart Investing & Trading Score: 26 | |
| Day Percent Change: 0.00% Day Change: 0.00 | |
| Week Change: 0% Year-to-date Change: 37.5% | |
| BARK Links: Profile News Message Board | |
| Charts:- Daily , Weekly | |
| Add BARK to Watchlist: View: Get Complete BARK Trend Analysis ➞ | |
 | CBZ CBIZ, Inc. |
| Sector: Services & Goods | |
| SubSector: Business Services | |
| MarketCap: 1121.32 Millions | |
| Recent Price: 71.97 Smart Investing & Trading Score: 26 | |
| Day Percent Change: -1.09% Day Change: -0.79 | |
| Week Change: -1.09% Year-to-date Change: 15.0% | |
| CBZ Links: Profile News Message Board | |
| Charts:- Daily , Weekly | |
| Add CBZ to Watchlist: View: Get Complete CBZ Trend Analysis ➞ | |
 | PKST Peakstone Realty Trust |
| Sector: Financials | |
| SubSector: REIT - Diversified | |
| MarketCap: 1050 Millions | |
| Recent Price: 14.44 Smart Investing & Trading Score: 25 | |
| Day Percent Change: 4.03% Day Change: 0.56 | |
| Week Change: 4.03% Year-to-date Change: -29.6% | |
| PKST Links: Profile News Message Board | |
| Charts:- Daily , Weekly | |
| Add PKST to Watchlist: View: Get Complete PKST Trend Analysis ➞ | |
 | PSFE Paysafe Limited |
| Sector: Technology | |
| SubSector: Software - Infrastructure | |
| MarketCap: 605 Millions | |
| Recent Price: 14.65 Smart Investing & Trading Score: 25 | |
| Day Percent Change: 1.31% Day Change: 0.19 | |
| Week Change: 1.31% Year-to-date Change: 13.6% | |
| PSFE Links: Profile News Message Board | |
| Charts:- Daily , Weekly | |
| Add PSFE to Watchlist: View: Get Complete PSFE Trend Analysis ➞ | |
| Too many stocks? View smallcap stocks filtered by marketcap & sector |
| Marketcap: All SmallCap Stocks (default-no microcap), Large, Mid-Range, Small & MicroCap |
| Sector: Tech, Finance, Energy, Staples, Retail, Industrial, Materials, Utilities & Medical |
|
Best Stocks Today 12Stocks.com |
© 2024 12Stocks.com Terms & Conditions Privacy Contact Us
All Information Provided Only For Education And Not To Be Used For Investing or Trading. See Terms & Conditions


One More Thing ... Get Best Stocks Delivered Daily!
Never Ever Miss A Move With Our Top Ten Stocks Lists
Find Best Stocks In Any Market - Bull or Bear Market
Take A Peek At Our Top Ten Stocks Lists: Daily, Weekly, Year-to-Date & Top Trends
Find Best Stocks In Any Market - Bull or Bear Market
Take A Peek At Our Top Ten Stocks Lists: Daily, Weekly, Year-to-Date & Top Trends
Smallcap Stocks With Best Up Trends [0-bearish to 100-bullish]: Bakkt [100], Deciphera [100], Phibro Animal[100], Heartland Financial[100], PTC [100], Sight Sciences[100], Richardson Electronics[100], Fulton Financial[100], Cullinan Oncology[100], TPI Composites[100], Lands [100]
Best Smallcap Stocks Year-to-Date:
CareMax [572.16%], Janux [422.57%], Bakkt [346.64%], Viking [305.75%], Longboard [248.45%], Alpine Immune[239.81%], Super Micro[213.31%], Avidity Biosciences[173.17%], Arcutis Bio[170.43%], Vera [167.34%], Cullinan Oncology[166.41%] Best Smallcap Stocks This Week:
Deciphera [71.95%], Vaxxinity [35.33%], Phibro Animal[31.89%], Zevia PBC[20.94%], Velo3D [19.97%], Janux [18.32%], Acrivon [18.09%], MultiPlan [15.53%], Heartland Financial[15.24%], Codexis [14.29%], Eyenovia [13.66%] Best Smallcap Stocks Daily:
Bakkt [2391.87%], Deciphera [71.95%], Vaxxinity [35.33%], Phibro Animal[31.89%], Zevia PBC[20.94%], Velo3D [19.97%], Janux [18.32%], Acrivon [18.09%], MultiPlan [15.53%], Heartland Financial[15.24%], Codexis [14.29%]