
 Login Sign Up


| |||||
 |  | ||||

| 12Stocks.com Market Intelligence |
Best SmallCap Stocks
|
| In a hurry? Small Cap Stock Lists: Performance Trends Table, Stock Charts
Sort Small Cap stocks: Daily, Weekly, Year-to-Date, Market Cap & Trends. Filter Small Cap stocks list by sector: Show all, Tech, Finance, Energy, Staples, Retail, Industrial, Materials, Utilities and HealthCare Filter Small Cap stocks list by size: All Large Medium Small and MicroCap |
| 12Stocks.com Small Cap Stocks Performances & Trends Daily | |||||||||
|
|  The overall Smart Investing & Trading Score is 41 (0-bearish to 100-bullish) which puts Small Cap index in short term neutral trend. The Smart Investing & Trading Score from previous trading session is 88 and hence a deterioration of trend.
| ||||||||
Here are the Smart Investing & Trading Scores of the most requested small cap stocks at 12Stocks.com (click stock name for detailed review):
|


| 12Stocks.com: Investing in Smallcap Index with Stocks | |
|
The following table helps investors and traders sort through current performance and trends (as measured by Smart Investing & Trading Score) of various
stocks in the Smallcap Index. Quick View: Move mouse or cursor over stock symbol (ticker) to view short-term technical chart and over stock name to view long term chart. Click on  to add stock symbol to your watchlist and to add stock symbol to your watchlist and  to view watchlist. Click on any ticker or stock name for detailed market intelligence report for that stock. to view watchlist. Click on any ticker or stock name for detailed market intelligence report for that stock. |
12Stocks.com Performance of Stocks in Smallcap Index
| Ticker | Stock Name | Watchlist | Category | Recent Price | Smart Investing & Trading Score | Change % | YTD Change% |
| TWOU | 2U |   | Technology | 0.25 | 59 | -5.47% | -79.63% |
| GNE | Genie Energy | | Energy | 15.68 | 59 | -2.31% | -44.26% |
| EVGO | EVgo | | Services & Goods | 1.80 | 59 | -1.64% | -49.79% |
| AURA | Aura Biosciences | | Health Care | 7.45 | 59 | -0.67% | -15.82% |
| HUBG | Hub Group | | Transports | 40.24 | 59 | -0.64% | -56.23% |
| GPRE | Green Plains | | Materials | 20.68 | 59 | -4.88% | -18.00% |
| SXC | SunCoke Energy | | Materials | 10.31 | 59 | -2.55% | -4.00% |
| JXN | Jackson Financial | | Financials | 68.32 | 59 | -2.23% | 32.92% |
| SNBR | Sleep Number | | Consumer Staples | 13.33 | 59 | -2.20% | -10.11% |
| STEP | StepStone Group | | Financials | 36.12 | 59 | -1.45% | 13.44% |
| WIRE | Encore Wire | | Technology | 279.21 | 59 | -1.35% | 30.72% |
| IMMR | Immersion | | Technology | 7.28 | 58 | 0.41% | 3.12% |
| THRD | Third Harmonic | | Health Care | 11.16 | 58 | 0.09% | 1.32% |
| VRRM | Verra Mobility | | Services & Goods | 23.58 | 58 | -3.16% | 2.39% |
| ANNX | Annexon | | Health Care | 4.55 | 58 | -3.09% | -0.11% |
| SUM | Summit Materials | | Industrials | 38.90 | 58 | -3.07% | 1.14% |
| SB | Safe Bulkers | | Transports | 4.99 | 58 | -2.92% | 26.97% |
| PATK | Patrick Industries | | Industrials | 104.52 | 58 | -2.48% | 4.15% |
| DDS | Dillard s | | Services & Goods | 437.99 | 58 | -2.32% | 8.51% |
| AMWD | American Woodmark | | Consumer Staples | 92.07 | 58 | -2.12% | -0.84% |
| QTWO | Q2 | | Technology | 51.39 | 58 | -2.10% | 18.38% |
| SCVL | Shoe Carnival | | Services & Goods | 33.47 | 58 | -2.05% | 10.79% |
| NOVT | Novanta | | Technology | 156.77 | 58 | -2.04% | -6.91% |
| ENVA | Enova | | Financials | 60.53 | 58 | -1.94% | 9.34% |
| MCY | Mercury General | | Financials | 52.26 | 58 | -1.58% | 40.07% |


| Too many stocks? View smallcap stocks filtered by marketcap & sector |
| Marketcap: All SmallCap Stocks (default-no microcap), Large, Mid-Range, Small |
| Smallcap Sector: Tech, Finance, Energy, Staples, Retail, Industrial, Materials, & Medical |
|
Get the most comprehensive stock market coverage daily at 12Stocks.com ➞ Best Stocks Today ➞ Best Stocks Weekly ➞ Best Stocks Year-to-Date ➞ Best Stocks Trends ➞  Best Stocks Today 12Stocks.com Best Nasdaq Stocks ➞ Best S&P 500 Stocks ➞ Best Tech Stocks ➞ Best Biotech Stocks ➞ |
| Detailed Overview of SmallCap Stocks |
| SmallCap Technical Overview, Leaders & Laggards, Top SmallCap ETF Funds & Detailed SmallCap Stocks List, Charts, Trends & More |
| Smallcap: Technical Analysis, Trends & YTD Performance | |
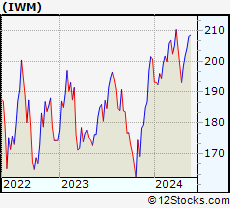
| SmallCap segment as represented by
IWM, an exchange-traded fund [ETF], holds basket of thousands of smallcap stocks from across all major sectors of the US stock market. The smallcap index (contains stocks like Riverbed & Sotheby's) is down by -2.4% and is currently underperforming the overall market by -7.2% year-to-date. Below is a quick view of technical charts and trends: | |
 IWM Weekly Chart |
|
| Long Term Trend: Good | |
| Medium Term Trend: Not Good | |
 IWM Daily Chart |
|
| Short Term Trend: Good | |
| Overall Trend Score: 41 | |
| YTD Performance: -2.4% | |
| **Trend Scores & Views Are Only For Educational Purposes And Not For Investing | |
| 12Stocks.com: Top Performing Small Cap Index Stocks | ||||||||||||||||||||||||||||||||||||||||||||||||
 The top performing Small Cap Index stocks year to date are
Now, more recently, over last week, the top performing Small Cap Index stocks on the move are


|
||||||||||||||||||||||||||||||||||||||||||||||||
| 12Stocks.com: Investing in Smallcap Index using Exchange Traded Funds | |
|
The following table shows list of key exchange traded funds (ETF) that
help investors track Smallcap index. The following list also includes leveraged ETF funds that track twice or thrice the daily returns of Smallcap indices. Short or inverse ETF funds move in the opposite direction to the index they track and are useful during market pullbacks or during bear markets. Quick View: Move mouse or cursor over ETF symbol (ticker) to view short-term technical chart and over ETF name to view long term chart. Click on ticker or stock name for detailed view. Click on to add stock symbol to your watchlist and to view watchlist. |
12Stocks.com List of ETFs that track Smallcap Index
| Ticker | ETF Name | Watchlist | Recent Price | Smart Investing & Trading Score | Change % | Week % | Year-to-date % |
| IWM | iShares Russell 2000 | | 195.90 | 41 | -2.03 | -1.26 | -2.4% |
| IJR | iShares Core S&P Small-Cap | | 104.44 | 86 | -1.85 | -1.15 | -3.52% |
| VTWO | Vanguard Russell 2000 ETF | | 79.17 | 81 | -2.01 | -1.32 | -2.39% |
| IWN | iShares Russell 2000 Value | | 148.97 | 86 | -2.03 | -1.44 | -4.09% |
| IWO | iShares Russell 2000 Growth | | 250.22 | 81 | -2.16 | -1.13 | -0.79% |
| IJS | iShares S&P Small-Cap 600 Value | | 96.07 | 68 | -1.92 | -1.15 | -6.79% |
| IJT | iShares S&P Small-Cap 600 Growth | | 124.59 | 88 | -1.87 | -1.19 | -0.44% |
| XSLV | PowerShares S&P SmallCap Low Volatil ETF | | 42.74 | 73 | -0.29 | 0.06 | -3.18% |
| SMLV | SPDR SSGA US Small Cap Low Volatil ETF | | 106.26 | 61 | -1.40 | -1.17 | -5.56% |
| SDD | ProShares UltraShort SmallCap600 | | 19.57 | 17 | 2.51 | 1.14 | 6.21% |
| SAA | ProShares Ultra SmallCap600 | | 22.60 | 81 | -2.88 | -1.91 | -9.42% |
| SBB | ProShares Short SmallCap600 | | 16.55 | 15 | 1.66 | 1.01 | 3.89% |
| 12Stocks.com: Charts, Trends, Fundamental Data and Performances of SmallCap Stocks | |
|
We now take in-depth look at all SmallCap stocks including charts, multi-period performances and overall trends (as measured by Smart Investing & Trading Score). One can sort SmallCap stocks (click link to choose) by Daily, Weekly and by Year-to-Date performances. Also, one can sort by size of the company or by market capitalization. |
| Select Your Default Chart Type: | |||||
| |||||
| Click on stock symbol or name for detailed view. Click on to add stock symbol to your watchlist and to view watchlist. Quick View: Move mouse or cursor over "Daily" to quickly view daily technical stock chart and over "Weekly" to view weekly technical stock chart. | |||||

 | TWOU 2U, Inc. |
| Sector: Technology | |
| SubSector: Application Software | |
| MarketCap: 1090.12 Millions | |
| Recent Price: 0.25 Smart Investing & Trading Score: 59 | |
| Day Percent Change: -5.47% Day Change: -0.01 | |
| Week Change: 4.24% Year-to-date Change: -79.6% | |
| TWOU Links: Profile News Message Board | |
| Charts:- Daily , Weekly | |
| Add TWOU to Watchlist: View: Get Complete TWOU Trend Analysis ➞ | |
 | GNE Genie Energy Ltd. |
| Sector: Energy | |
| SubSector: Independent Oil & Gas | |
| MarketCap: 177.293 Millions | |
| Recent Price: 15.68 Smart Investing & Trading Score: 59 | |
| Day Percent Change: -2.31% Day Change: -0.37 | |
| Week Change: 1.1% Year-to-date Change: -44.3% | |
| GNE Links: Profile News Message Board | |
| Charts:- Daily , Weekly | |
| Add GNE to Watchlist: View: Get Complete GNE Trend Analysis ➞ | |
 | EVGO EVgo, Inc. |
| Sector: Services & Goods | |
| SubSector: Specialty Retail | |
| MarketCap: 1140 Millions | |
| Recent Price: 1.80 Smart Investing & Trading Score: 59 | |
| Day Percent Change: -1.64% Day Change: -0.03 | |
| Week Change: 0% Year-to-date Change: -49.8% | |
| EVGO Links: Profile News Message Board | |
| Charts:- Daily , Weekly | |
| Add EVGO to Watchlist: View: Get Complete EVGO Trend Analysis ➞ | |
 | AURA Aura Biosciences, Inc. |
| Sector: Health Care | |
| SubSector: Biotechnology | |
| MarketCap: 469 Millions | |
| Recent Price: 7.45 Smart Investing & Trading Score: 59 | |
| Day Percent Change: -0.67% Day Change: -0.05 | |
| Week Change: 3.19% Year-to-date Change: -15.8% | |
| AURA Links: Profile News Message Board | |
| Charts:- Daily , Weekly | |
| Add AURA to Watchlist: View: Get Complete AURA Trend Analysis ➞ | |
 | HUBG Hub Group, Inc. |
| Sector: Transports | |
| SubSector: Air Delivery & Freight Services | |
| MarketCap: 1503.88 Millions | |
| Recent Price: 40.24 Smart Investing & Trading Score: 59 | |
| Day Percent Change: -0.64% Day Change: -0.26 | |
| Week Change: 0.78% Year-to-date Change: -56.2% | |
| HUBG Links: Profile News Message Board | |
| Charts:- Daily , Weekly | |
| Add HUBG to Watchlist: View: Get Complete HUBG Trend Analysis ➞ | |
 | GPRE Green Plains Inc. |
| Sector: Materials | |
| SubSector: Specialty Chemicals | |
| MarketCap: 196.357 Millions | |
| Recent Price: 20.68 Smart Investing & Trading Score: 59 | |
| Day Percent Change: -4.88% Day Change: -1.06 | |
| Week Change: -3.36% Year-to-date Change: -18.0% | |
| GPRE Links: Profile News Message Board | |
| Charts:- Daily , Weekly | |
| Add GPRE to Watchlist: View: Get Complete GPRE Trend Analysis ➞ | |
 | SXC SunCoke Energy, Inc. |
| Sector: Materials | |
| SubSector: Nonmetallic Mineral Mining | |
| MarketCap: 306.5 Millions | |
| Recent Price: 10.31 Smart Investing & Trading Score: 59 | |
| Day Percent Change: -2.55% Day Change: -0.27 | |
| Week Change: -2.46% Year-to-date Change: -4.0% | |
| SXC Links: Profile News Message Board | |
| Charts:- Daily , Weekly | |
| Add SXC to Watchlist: View: Get Complete SXC Trend Analysis ➞ | |
 | JXN Jackson Financial Inc. |
| Sector: Financials | |
| SubSector: Insurance - Life | |
| MarketCap: 2460 Millions | |
| Recent Price: 68.32 Smart Investing & Trading Score: 59 | |
| Day Percent Change: -2.23% Day Change: -1.56 | |
| Week Change: -1.78% Year-to-date Change: 32.9% | |
| JXN Links: Profile News Message Board | |
| Charts:- Daily , Weekly | |
| Add JXN to Watchlist: View: Get Complete JXN Trend Analysis ➞ | |
 | SNBR Sleep Number Corporation |
| Sector: Consumer Staples | |
| SubSector: Home Furnishings & Fixtures | |
| MarketCap: 692.735 Millions | |
| Recent Price: 13.33 Smart Investing & Trading Score: 59 | |
| Day Percent Change: -2.20% Day Change: -0.30 | |
| Week Change: -5.99% Year-to-date Change: -10.1% | |
| SNBR Links: Profile News Message Board | |
| Charts:- Daily , Weekly | |
| Add SNBR to Watchlist: View: Get Complete SNBR Trend Analysis ➞ | |
 | STEP StepStone Group Inc. |
| Sector: Financials | |
| SubSector: Asset Management | |
| MarketCap: 30757 Millions | |
| Recent Price: 36.12 Smart Investing & Trading Score: 59 | |
| Day Percent Change: -1.45% Day Change: -0.53 | |
| Week Change: -0.91% Year-to-date Change: 13.4% | |
| STEP Links: Profile News Message Board | |
| Charts:- Daily , Weekly | |
| Add STEP to Watchlist: View: Get Complete STEP Trend Analysis ➞ | |
 | WIRE Encore Wire Corporation |
| Sector: Technology | |
| SubSector: Diversified Electronics | |
| MarketCap: 898.896 Millions | |
| Recent Price: 279.21 Smart Investing & Trading Score: 59 | |
| Day Percent Change: -1.35% Day Change: -3.82 | |
| Week Change: -1.99% Year-to-date Change: 30.7% | |
| WIRE Links: Profile News Message Board | |
| Charts:- Daily , Weekly | |
| Add WIRE to Watchlist: View: Get Complete WIRE Trend Analysis ➞ | |
 | IMMR Immersion Corporation |
| Sector: Technology | |
| SubSector: Application Software | |
| MarketCap: 173.462 Millions | |
| Recent Price: 7.28 Smart Investing & Trading Score: 58 | |
| Day Percent Change: 0.41% Day Change: 0.03 | |
| Week Change: 1.25% Year-to-date Change: 3.1% | |
| IMMR Links: Profile News Message Board | |
| Charts:- Daily , Weekly | |
| Add IMMR to Watchlist: View: Get Complete IMMR Trend Analysis ➞ | |
 | THRD Third Harmonic Bio, Inc. |
| Sector: Health Care | |
| SubSector: Biotechnology | |
| MarketCap: 190 Millions | |
| Recent Price: 11.16 Smart Investing & Trading Score: 58 | |
| Day Percent Change: 0.09% Day Change: 0.01 | |
| Week Change: 3.05% Year-to-date Change: 1.3% | |
| THRD Links: Profile News Message Board | |
| Charts:- Daily , Weekly | |
| Add THRD to Watchlist: View: Get Complete THRD Trend Analysis ➞ | |
 | VRRM Verra Mobility Corporation |
| Sector: Services & Goods | |
| SubSector: Security & Protection Services | |
| MarketCap: 1265.03 Millions | |
| Recent Price: 23.58 Smart Investing & Trading Score: 58 | |
| Day Percent Change: -3.16% Day Change: -0.77 | |
| Week Change: -2.68% Year-to-date Change: 2.4% | |
| VRRM Links: Profile News Message Board | |
| Charts:- Daily , Weekly | |
| Add VRRM to Watchlist: View: Get Complete VRRM Trend Analysis ➞ | |
 | ANNX Annexon, Inc. |
| Sector: Health Care | |
| SubSector: Biotechnology | |
| MarketCap: 94487 Millions | |
| Recent Price: 4.55 Smart Investing & Trading Score: 58 | |
| Day Percent Change: -3.09% Day Change: -0.15 | |
| Week Change: -3.09% Year-to-date Change: -0.1% | |
| ANNX Links: Profile News Message Board | |
| Charts:- Daily , Weekly | |
| Add ANNX to Watchlist: View: Get Complete ANNX Trend Analysis ➞ | |
 | SUM Summit Materials, Inc. |
| Sector: Industrials | |
| SubSector: General Building Materials | |
| MarketCap: 1138.23 Millions | |
| Recent Price: 38.90 Smart Investing & Trading Score: 58 | |
| Day Percent Change: -3.07% Day Change: -1.23 | |
| Week Change: -2.75% Year-to-date Change: 1.1% | |
| SUM Links: Profile News Message Board | |
| Charts:- Daily , Weekly | |
| Add SUM to Watchlist: View: Get Complete SUM Trend Analysis ➞ | |
 | SB Safe Bulkers, Inc. |
| Sector: Transports | |
| SubSector: Shipping | |
| MarketCap: 108.114 Millions | |
| Recent Price: 4.99 Smart Investing & Trading Score: 58 | |
| Day Percent Change: -2.92% Day Change: -0.15 | |
| Week Change: -1.38% Year-to-date Change: 27.0% | |
| SB Links: Profile News Message Board | |
| Charts:- Daily , Weekly | |
| Add SB to Watchlist: View: Get Complete SB Trend Analysis ➞ | |
 | PATK Patrick Industries, Inc. |
| Sector: Industrials | |
| SubSector: Lumber, Wood Production | |
| MarketCap: 565.838 Millions | |
| Recent Price: 104.52 Smart Investing & Trading Score: 58 | |
| Day Percent Change: -2.48% Day Change: -2.66 | |
| Week Change: -0.92% Year-to-date Change: 4.2% | |
| PATK Links: Profile News Message Board | |
| Charts:- Daily , Weekly | |
| Add PATK to Watchlist: View: Get Complete PATK Trend Analysis ➞ | |
 | DDS Dillard s, Inc. |
| Sector: Services & Goods | |
| SubSector: Department Stores | |
| MarketCap: 1170.82 Millions | |
| Recent Price: 437.99 Smart Investing & Trading Score: 58 | |
| Day Percent Change: -2.32% Day Change: -10.41 | |
| Week Change: -2.45% Year-to-date Change: 8.5% | |
| DDS Links: Profile News Message Board | |
| Charts:- Daily , Weekly | |
| Add DDS to Watchlist: View: Get Complete DDS Trend Analysis ➞ | |
 | AMWD American Woodmark Corporation |
| Sector: Consumer Staples | |
| SubSector: Home Furnishings & Fixtures | |
| MarketCap: 958.435 Millions | |
| Recent Price: 92.07 Smart Investing & Trading Score: 58 | |
| Day Percent Change: -2.12% Day Change: -1.99 | |
| Week Change: -0.91% Year-to-date Change: -0.8% | |
| AMWD Links: Profile News Message Board | |
| Charts:- Daily , Weekly | |
| Add AMWD to Watchlist: View: Get Complete AMWD Trend Analysis ➞ | |
 | QTWO Q2 Holdings, Inc. |
| Sector: Technology | |
| SubSector: Business Software & Services | |
| MarketCap: 2815.88 Millions | |
| Recent Price: 51.39 Smart Investing & Trading Score: 58 | |
| Day Percent Change: -2.10% Day Change: -1.10 | |
| Week Change: -3.55% Year-to-date Change: 18.4% | |
| QTWO Links: Profile News Message Board | |
| Charts:- Daily , Weekly | |
| Add QTWO to Watchlist: View: Get Complete QTWO Trend Analysis ➞ | |
 | SCVL Shoe Carnival, Inc. |
| Sector: Services & Goods | |
| SubSector: Apparel Stores | |
| MarketCap: 252.508 Millions | |
| Recent Price: 33.47 Smart Investing & Trading Score: 58 | |
| Day Percent Change: -2.05% Day Change: -0.70 | |
| Week Change: -3.07% Year-to-date Change: 10.8% | |
| SCVL Links: Profile News Message Board | |
| Charts:- Daily , Weekly | |
| Add SCVL to Watchlist: View: Get Complete SCVL Trend Analysis ➞ | |
 | NOVT Novanta Inc. |
| Sector: Technology | |
| SubSector: Scientific & Technical Instruments | |
| MarketCap: 2680.83 Millions | |
| Recent Price: 156.77 Smart Investing & Trading Score: 58 | |
| Day Percent Change: -2.04% Day Change: -3.26 | |
| Week Change: -1.66% Year-to-date Change: -6.9% | |
| NOVT Links: Profile News Message Board | |
| Charts:- Daily , Weekly | |
| Add NOVT to Watchlist: View: Get Complete NOVT Trend Analysis ➞ | |
 | ENVA Enova International, Inc. |
| Sector: Financials | |
| SubSector: Credit Services | |
| MarketCap: 345.508 Millions | |
| Recent Price: 60.53 Smart Investing & Trading Score: 58 | |
| Day Percent Change: -1.94% Day Change: -1.20 | |
| Week Change: -4.27% Year-to-date Change: 9.3% | |
| ENVA Links: Profile News Message Board | |
| Charts:- Daily , Weekly | |
| Add ENVA to Watchlist: View: Get Complete ENVA Trend Analysis ➞ | |
 | MCY Mercury General Corporation |
| Sector: Financials | |
| SubSector: Property & Casualty Insurance | |
| MarketCap: 2122.12 Millions | |
| Recent Price: 52.26 Smart Investing & Trading Score: 58 | |
| Day Percent Change: -1.58% Day Change: -0.84 | |
| Week Change: 1.16% Year-to-date Change: 40.1% | |
| MCY Links: Profile News Message Board | |
| Charts:- Daily , Weekly | |
| Add MCY to Watchlist: View: Get Complete MCY Trend Analysis ➞ | |
| Too many stocks? View smallcap stocks filtered by marketcap & sector |
| Marketcap: All SmallCap Stocks (default-no microcap), Large, Mid-Range, Small & MicroCap |
| Sector: Tech, Finance, Energy, Staples, Retail, Industrial, Materials, Utilities & Medical |
|
Best Stocks Today 12Stocks.com |
© 2024 12Stocks.com Terms & Conditions Privacy Contact Us
All Information Provided Only For Education And Not To Be Used For Investing or Trading. See Terms & Conditions


One More Thing ... Get Best Stocks Delivered Daily!
Never Ever Miss A Move With Our Top Ten Stocks Lists
Find Best Stocks In Any Market - Bull or Bear Market
Take A Peek At Our Top Ten Stocks Lists: Daily, Weekly, Year-to-Date & Top Trends
Find Best Stocks In Any Market - Bull or Bear Market
Take A Peek At Our Top Ten Stocks Lists: Daily, Weekly, Year-to-Date & Top Trends
Smallcap Stocks With Best Up Trends [0-bearish to 100-bullish]: Allegheny [100], Brinker [100], Day One[100], Heartland Financial[100], Carpenter [100], LTC Properties[100], California Water[100], Semtech [100], Impinj [100], Sensient [100], Costamare [100]
Best Smallcap Stocks Year-to-Date:
Janux [431.32%], Viking [327.24%], Longboard [248.2%], Alpine Immune[239.15%], Super Micro[202.31%], Bakkt [200.9%], Avidity Biosciences[167.04%], Cullinan Oncology[164.88%], Arcutis Bio[157.12%], Vera [155.36%], Hippo [134.8%] Best Smallcap Stocks This Week:
Deciphera [72.49%], Cue Biopharma[39.19%], GrowGeneration [35.14%], Phibro Animal[31.15%], LendingTree [27.26%], Janux [20.3%], Seres [20.07%], Eyenovia [18.75%], P3 Health[18.22%], Heartland Financial[17.92%], Harmonic [16.96%] Best Smallcap Stocks Daily:
Cue Biopharma[33.80%], GrowGeneration [30.43%], LendingTree [29.13%], SES AI[17.04%], Allegheny [15.03%], AnaptysBio [14.58%], Harmonic [14.47%], LSB Industries[13.14%], P3 Health[12.09%], Clearwater Paper[10.69%], Brightcove [9.15%]