
 Login Sign Up


| |||||
 |  | ||||

| 12Stocks.com Market Intelligence |
Best SmallCap Stocks
|
| In a hurry? Small Cap Stock Lists: Performance Trends Table, Stock Charts
Sort Small Cap stocks: Daily, Weekly, Year-to-Date, Market Cap & Trends. Filter Small Cap stocks list by sector: Show all, Tech, Finance, Energy, Staples, Retail, Industrial, Materials, Utilities and HealthCare Filter Small Cap stocks list by size: All Large Medium Small and MicroCap |
| 12Stocks.com Small Cap Stocks Performances & Trends Daily | |||||||||
|
|  The overall Smart Investing & Trading Score is 49 (0-bearish to 100-bullish) which puts Small Cap index in short term neutral trend. The Smart Investing & Trading Score from previous trading session is 14 and hence an improvement of trend.
| ||||||||
Here are the Smart Investing & Trading Scores of the most requested small cap stocks at 12Stocks.com (click stock name for detailed review):
|


| 12Stocks.com: Investing in Smallcap Index with Stocks | |
|
The following table helps investors and traders sort through current performance and trends (as measured by Smart Investing & Trading Score) of various
stocks in the Smallcap Index. Quick View: Move mouse or cursor over stock symbol (ticker) to view short-term technical chart and over stock name to view long term chart. Click on  to add stock symbol to your watchlist and to add stock symbol to your watchlist and  to view watchlist. Click on any ticker or stock name for detailed market intelligence report for that stock. to view watchlist. Click on any ticker or stock name for detailed market intelligence report for that stock. |
12Stocks.com Performance of Stocks in Smallcap Index
| Ticker | Stock Name | Watchlist | Category | Recent Price | Smart Investing & Trading Score | Change % | YTD Change% |
| SGRY | Surgery Partners |   | Health Care | 25.00 | 28 | 1.50% | -21.85% |
| VIGL | Vigil Neuroscience | | Health Care | 2.60 | 28 | -1.89% | -24.34% |
| AVAH | Aveanna Healthcare | | Health Care | 2.23 | 28 | -1.11% | -17.07% |
| SLRN | Acelyrin | | Health Care | 4.25 | 28 | -0.12% | -42.40% |
| MTW | Manitowoc | | Industrials | 12.47 | 27 | 5.23% | -25.28% |
| PCT | PureCycle | | Industrials | 4.88 | 27 | 5.05% | 20.47% |
| NSSC | Napco Security | | Services & Goods | 41.75 | 27 | 3.86% | 21.90% |
| KLIC | Kulicke and | | Technology | 46.02 | 27 | 3.74% | -15.90% |
| MATX | Matson | | Transports | 109.11 | 27 | 3.44% | -0.45% |
| POWI | Power Integrations | | Technology | 67.97 | 27 | 3.38% | -17.22% |
| ACCO | ACCO Brands | | Consumer Staples | 4.92 | 27 | 3.36% | -19.08% |
| HGV | Hilton Grand | | Services & Goods | 43.12 | 27 | 3.36% | 7.32% |
| TTEC | TTEC | | Technology | 7.53 | 27 | 3.08% | -65.27% |
| VICR | Vicor | | Technology | 32.78 | 27 | 3.02% | -27.06% |
| QUAD | Quad/Graphics | | Services & Goods | 4.66 | 27 | 2.87% | -14.02% |
| INSE | Inspired Entertainment | | Services & Goods | 8.70 | 27 | 2.84% | -11.94% |
| TITN | Titan Machinery | | Services & Goods | 22.42 | 27 | 2.80% | -22.37% |
| PGC | Peapack-Gladstone Financial | | Financials | 22.97 | 27 | 2.64% | -22.97% |
| SCPH | sc | | Health Care | 4.66 | 27 | 2.64% | -25.68% |
| SHEN | Shenandoah Tele | | Technology | 13.25 | 27 | 2.55% | -38.71% |
| DHC | Diversified Healthcare | | Financials | 2.42 | 27 | 2.54% | -35.29% |
| WTI | W&T Offshore | | Energy | 2.28 | 27 | 2.24% | -30.06% |
| UFPI | Universal Forest | | Industrials | 115.49 | 27 | 2.20% | -8.01% |
| SCLX | Scilex Holding | | Health Care | 0.86 | 27 | 1.68% | -56.14% |
| CEVA | CEVA | | Technology | 20.13 | 27 | 1.62% | -11.36% |


| Too many stocks? View smallcap stocks filtered by marketcap & sector |
| Marketcap: All SmallCap Stocks (default-no microcap), Large, Mid-Range, Small |
| Smallcap Sector: Tech, Finance, Energy, Staples, Retail, Industrial, Materials, & Medical |
|
Get the most comprehensive stock market coverage daily at 12Stocks.com ➞ Best Stocks Today ➞ Best Stocks Weekly ➞ Best Stocks Year-to-Date ➞ Best Stocks Trends ➞  Best Stocks Today 12Stocks.com Best Nasdaq Stocks ➞ Best S&P 500 Stocks ➞ Best Tech Stocks ➞ Best Biotech Stocks ➞ |
| Detailed Overview of SmallCap Stocks |
| SmallCap Technical Overview, Leaders & Laggards, Top SmallCap ETF Funds & Detailed SmallCap Stocks List, Charts, Trends & More |
| Smallcap: Technical Analysis, Trends & YTD Performance | |
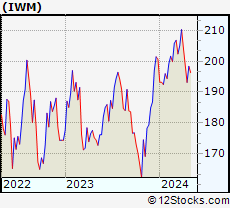
| SmallCap segment as represented by
IWM, an exchange-traded fund [ETF], holds basket of thousands of smallcap stocks from across all major sectors of the US stock market. The smallcap index (contains stocks like Riverbed & Sotheby's) is down by -0.39% and is currently underperforming the overall market by -6.01% year-to-date. Below is a quick view of technical charts and trends: | |
 IWM Weekly Chart |
|
| Long Term Trend: Not Good | |
| Medium Term Trend: Good | |
 IWM Daily Chart |
|
| Short Term Trend: Deteriorating | |
| Overall Trend Score: 49 | |
| YTD Performance: -0.39% | |
| **Trend Scores & Views Are Only For Educational Purposes And Not For Investing | |
| 12Stocks.com: Top Performing Small Cap Index Stocks | ||||||||||||||||||||||||||||||||||||||||||||||||
 The top performing Small Cap Index stocks year to date are
Now, more recently, over last week, the top performing Small Cap Index stocks on the move are


|
||||||||||||||||||||||||||||||||||||||||||||||||
| 12Stocks.com: Investing in Smallcap Index using Exchange Traded Funds | |
|
The following table shows list of key exchange traded funds (ETF) that
help investors track Smallcap index. The following list also includes leveraged ETF funds that track twice or thrice the daily returns of Smallcap indices. Short or inverse ETF funds move in the opposite direction to the index they track and are useful during market pullbacks or during bear markets. Quick View: Move mouse or cursor over ETF symbol (ticker) to view short-term technical chart and over ETF name to view long term chart. Click on ticker or stock name for detailed view. Click on to add stock symbol to your watchlist and to view watchlist. |
12Stocks.com List of ETFs that track Smallcap Index
| Ticker | ETF Name | Watchlist | Recent Price | Smart Investing & Trading Score | Change % | Week % | Year-to-date % |
| IWM | iShares Russell 2000 | | 199.92 | 49 | 1.84 | 0.77 | -0.39% |
| IJR | iShares Core S&P Small-Cap | | 106.33 | 50 | 1.52 | 0.64 | -1.77% |
| VTWO | Vanguard Russell 2000 ETF | | 80.85 | 7 | 1.88 | 0.79 | -0.31% |
| IWN | iShares Russell 2000 Value | | 152.88 | 57 | 2.04 | 1.15 | -1.58% |
| IWO | iShares Russell 2000 Growth | | 254.34 | 17 | 1.91 | 0.49 | 0.84% |
| IJS | iShares S&P Small-Cap 600 Value | | 98.02 | 13 | 1.68 | 0.85 | -4.9% |
| IJT | iShares S&P Small-Cap 600 Growth | | 126.72 | 20 | 1.42 | 0.5 | 1.26% |
| XSLV | PowerShares S&P SmallCap Low Volatil ETF | | 43.14 | 42 | 0.72 | 0.98 | -2.29% |
| SDD | ProShares UltraShort SmallCap600 | | 19.31 | 61 | -2.02 | -0.21 | 4.79% |
| SMLV | SPDR SSGA US Small Cap Low Volatil ETF | | 108.83 | 44 | 1.30 | 1.22 | -3.27% |
| SAA | ProShares Ultra SmallCap600 | | 22.93 | 32 | 1.56 | -0.46 | -8.08% |
| SBB | ProShares Short SmallCap600 | | 16.37 | 71 | -1.14 | -0.09 | 2.76% |
| 12Stocks.com: Charts, Trends, Fundamental Data and Performances of SmallCap Stocks | |
|
We now take in-depth look at all SmallCap stocks including charts, multi-period performances and overall trends (as measured by Smart Investing & Trading Score). One can sort SmallCap stocks (click link to choose) by Daily, Weekly and by Year-to-Date performances. Also, one can sort by size of the company or by market capitalization. |
| Select Your Default Chart Type: | |||||
| |||||
| Click on stock symbol or name for detailed view. Click on to add stock symbol to your watchlist and to view watchlist. Quick View: Move mouse or cursor over "Daily" to quickly view daily technical stock chart and over "Weekly" to view weekly technical stock chart. | |||||

 | SGRY Surgery Partners, Inc. |
| Sector: Health Care | |
| SubSector: Hospitals | |
| MarketCap: 328.446 Millions | |
| Recent Price: 25.00 Smart Investing & Trading Score: 28 | |
| Day Percent Change: 1.50% Day Change: 0.37 | |
| Week Change: 1.83% Year-to-date Change: -21.9% | |
| SGRY Links: Profile News Message Board | |
| Charts:- Daily , Weekly | |
| Add SGRY to Watchlist: View: Get Complete SGRY Trend Analysis ➞ | |
 | VIGL Vigil Neuroscience, Inc. |
| Sector: Health Care | |
| SubSector: Biotechnology | |
| MarketCap: 339 Millions | |
| Recent Price: 2.60 Smart Investing & Trading Score: 28 | |
| Day Percent Change: -1.89% Day Change: -0.05 | |
| Week Change: -4.24% Year-to-date Change: -24.3% | |
| VIGL Links: Profile News Message Board | |
| Charts:- Daily , Weekly | |
| Add VIGL to Watchlist: View: Get Complete VIGL Trend Analysis ➞ | |
 | AVAH Aveanna Healthcare Holdings Inc. |
| Sector: Health Care | |
| SubSector: Medical Care Facilities | |
| MarketCap: 305 Millions | |
| Recent Price: 2.23 Smart Investing & Trading Score: 28 | |
| Day Percent Change: -1.11% Day Change: -0.02 | |
| Week Change: 1.59% Year-to-date Change: -17.1% | |
| AVAH Links: Profile News Message Board | |
| Charts:- Daily , Weekly | |
| Add AVAH to Watchlist: View: Get Complete AVAH Trend Analysis ➞ | |
 | SLRN Acelyrin, Inc. |
| Sector: Health Care | |
| SubSector: Biotechnology | |
| MarketCap: 2030 Millions | |
| Recent Price: 4.25 Smart Investing & Trading Score: 28 | |
| Day Percent Change: -0.12% Day Change: 0.00 | |
| Week Change: 0.12% Year-to-date Change: -42.4% | |
| SLRN Links: Profile News Message Board | |
| Charts:- Daily , Weekly | |
| Add SLRN to Watchlist: View: Get Complete SLRN Trend Analysis ➞ | |
 | MTW The Manitowoc Company, Inc. |
| Sector: Industrials | |
| SubSector: Farm & Construction Machinery | |
| MarketCap: 373.707 Millions | |
| Recent Price: 12.47 Smart Investing & Trading Score: 27 | |
| Day Percent Change: 5.23% Day Change: 0.62 | |
| Week Change: -1.34% Year-to-date Change: -25.3% | |
| MTW Links: Profile News Message Board | |
| Charts:- Daily , Weekly | |
| Add MTW to Watchlist: View: Get Complete MTW Trend Analysis ➞ | |
 | PCT PureCycle Technologies, Inc. |
| Sector: Industrials | |
| SubSector: Pollution & Treatment Controls | |
| MarketCap: 1610 Millions | |
| Recent Price: 4.88 Smart Investing & Trading Score: 27 | |
| Day Percent Change: 5.05% Day Change: 0.23 | |
| Week Change: -1.91% Year-to-date Change: 20.5% | |
| PCT Links: Profile News Message Board | |
| Charts:- Daily , Weekly | |
| Add PCT to Watchlist: View: Get Complete PCT Trend Analysis ➞ | |
 | NSSC Napco Security Technologies, Inc. |
| Sector: Services & Goods | |
| SubSector: Security & Protection Services | |
| MarketCap: 339.103 Millions | |
| Recent Price: 41.75 Smart Investing & Trading Score: 27 | |
| Day Percent Change: 3.86% Day Change: 1.55 | |
| Week Change: -4.81% Year-to-date Change: 21.9% | |
| NSSC Links: Profile News Message Board | |
| Charts:- Daily , Weekly | |
| Add NSSC to Watchlist: View: Get Complete NSSC Trend Analysis ➞ | |
 | KLIC Kulicke and Soffa Industries, Inc. |
| Sector: Technology | |
| SubSector: Semiconductor Equipment & Materials | |
| MarketCap: 1336.68 Millions | |
| Recent Price: 46.02 Smart Investing & Trading Score: 27 | |
| Day Percent Change: 3.74% Day Change: 1.66 | |
| Week Change: -2.13% Year-to-date Change: -15.9% | |
| KLIC Links: Profile News Message Board | |
| Charts:- Daily , Weekly | |
| Add KLIC to Watchlist: View: Get Complete KLIC Trend Analysis ➞ | |
 | MATX Matson, Inc. |
| Sector: Transports | |
| SubSector: Shipping | |
| MarketCap: 1509.94 Millions | |
| Recent Price: 109.11 Smart Investing & Trading Score: 27 | |
| Day Percent Change: 3.44% Day Change: 3.63 | |
| Week Change: 0.16% Year-to-date Change: -0.5% | |
| MATX Links: Profile News Message Board | |
| Charts:- Daily , Weekly | |
| Add MATX to Watchlist: View: Get Complete MATX Trend Analysis ➞ | |
 | POWI Power Integrations, Inc. |
| Sector: Technology | |
| SubSector: Semiconductor - Integrated Circuits | |
| MarketCap: 2612.1 Millions | |
| Recent Price: 67.97 Smart Investing & Trading Score: 27 | |
| Day Percent Change: 3.38% Day Change: 2.22 | |
| Week Change: 1.04% Year-to-date Change: -17.2% | |
| POWI Links: Profile News Message Board | |
| Charts:- Daily , Weekly | |
| Add POWI to Watchlist: View: Get Complete POWI Trend Analysis ➞ | |
 | ACCO ACCO Brands Corporation |
| Sector: Consumer Staples | |
| SubSector: Office Supplies | |
| MarketCap: 448.2 Millions | |
| Recent Price: 4.92 Smart Investing & Trading Score: 27 | |
| Day Percent Change: 3.36% Day Change: 0.16 | |
| Week Change: 1.86% Year-to-date Change: -19.1% | |
| ACCO Links: Profile News Message Board | |
| Charts:- Daily , Weekly | |
| Add ACCO to Watchlist: View: Get Complete ACCO Trend Analysis ➞ | |
 | HGV Hilton Grand Vacations Inc. |
| Sector: Services & Goods | |
| SubSector: Resorts & Casinos | |
| MarketCap: 1333.04 Millions | |
| Recent Price: 43.12 Smart Investing & Trading Score: 27 | |
| Day Percent Change: 3.36% Day Change: 1.40 | |
| Week Change: -2.75% Year-to-date Change: 7.3% | |
| HGV Links: Profile News Message Board | |
| Charts:- Daily , Weekly | |
| Add HGV to Watchlist: View: Get Complete HGV Trend Analysis ➞ | |
 | TTEC TTEC Holdings, Inc. |
| Sector: Technology | |
| SubSector: Information Technology Services | |
| MarketCap: 1528.48 Millions | |
| Recent Price: 7.53 Smart Investing & Trading Score: 27 | |
| Day Percent Change: 3.08% Day Change: 0.23 | |
| Week Change: -2.53% Year-to-date Change: -65.3% | |
| TTEC Links: Profile News Message Board | |
| Charts:- Daily , Weekly | |
| Add TTEC to Watchlist: View: Get Complete TTEC Trend Analysis ➞ | |
 | VICR Vicor Corporation |
| Sector: Technology | |
| SubSector: Diversified Electronics | |
| MarketCap: 1526.76 Millions | |
| Recent Price: 32.78 Smart Investing & Trading Score: 27 | |
| Day Percent Change: 3.02% Day Change: 0.96 | |
| Week Change: -4.74% Year-to-date Change: -27.1% | |
| VICR Links: Profile News Message Board | |
| Charts:- Daily , Weekly | |
| Add VICR to Watchlist: View: Get Complete VICR Trend Analysis ➞ | |
 | QUAD Quad/Graphics, Inc. |
| Sector: Services & Goods | |
| SubSector: Business Services | |
| MarketCap: 205.182 Millions | |
| Recent Price: 4.66 Smart Investing & Trading Score: 27 | |
| Day Percent Change: 2.87% Day Change: 0.13 | |
| Week Change: 3.1% Year-to-date Change: -14.0% | |
| QUAD Links: Profile News Message Board | |
| Charts:- Daily , Weekly | |
| Add QUAD to Watchlist: View: Get Complete QUAD Trend Analysis ➞ | |
 | INSE Inspired Entertainment, Inc. |
| Sector: Services & Goods | |
| SubSector: Gaming Activities | |
| MarketCap: 80.9289 Millions | |
| Recent Price: 8.70 Smart Investing & Trading Score: 27 | |
| Day Percent Change: 2.84% Day Change: 0.24 | |
| Week Change: -1.25% Year-to-date Change: -11.9% | |
| INSE Links: Profile News Message Board | |
| Charts:- Daily , Weekly | |
| Add INSE to Watchlist: View: Get Complete INSE Trend Analysis ➞ | |
 | TITN Titan Machinery Inc. |
| Sector: Services & Goods | |
| SubSector: Industrial Equipment Wholesale | |
| MarketCap: 208.958 Millions | |
| Recent Price: 22.42 Smart Investing & Trading Score: 27 | |
| Day Percent Change: 2.80% Day Change: 0.61 | |
| Week Change: -1.23% Year-to-date Change: -22.4% | |
| TITN Links: Profile News Message Board | |
| Charts:- Daily , Weekly | |
| Add TITN to Watchlist: View: Get Complete TITN Trend Analysis ➞ | |
 | PGC Peapack-Gladstone Financial Corporation |
| Sector: Financials | |
| SubSector: Regional - Northeast Banks | |
| MarketCap: 284.399 Millions | |
| Recent Price: 22.97 Smart Investing & Trading Score: 27 | |
| Day Percent Change: 2.64% Day Change: 0.59 | |
| Week Change: 1.01% Year-to-date Change: -23.0% | |
| PGC Links: Profile News Message Board | |
| Charts:- Daily , Weekly | |
| Add PGC to Watchlist: View: Get Complete PGC Trend Analysis ➞ | |
 | SCPH scPharmaceuticals Inc. |
| Sector: Health Care | |
| SubSector: Biotechnology | |
| MarketCap: 136.185 Millions | |
| Recent Price: 4.66 Smart Investing & Trading Score: 27 | |
| Day Percent Change: 2.64% Day Change: 0.12 | |
| Week Change: 3.79% Year-to-date Change: -25.7% | |
| SCPH Links: Profile News Message Board | |
| Charts:- Daily , Weekly | |
| Add SCPH to Watchlist: View: Get Complete SCPH Trend Analysis ➞ | |
 | SHEN Shenandoah Telecommunications Company |
| Sector: Technology | |
| SubSector: Telecom Services - Domestic | |
| MarketCap: 2329.67 Millions | |
| Recent Price: 13.25 Smart Investing & Trading Score: 27 | |
| Day Percent Change: 2.55% Day Change: 0.33 | |
| Week Change: -1.05% Year-to-date Change: -38.7% | |
| SHEN Links: Profile News Message Board | |
| Charts:- Daily , Weekly | |
| Add SHEN to Watchlist: View: Get Complete SHEN Trend Analysis ➞ | |
 | DHC Diversified Healthcare Trust |
| Sector: Financials | |
| SubSector: REIT - Healthcare Facilities | |
| MarketCap: 814.114 Millions | |
| Recent Price: 2.42 Smart Investing & Trading Score: 27 | |
| Day Percent Change: 2.54% Day Change: 0.06 | |
| Week Change: -0.41% Year-to-date Change: -35.3% | |
| DHC Links: Profile News Message Board | |
| Charts:- Daily , Weekly | |
| Add DHC to Watchlist: View: Get Complete DHC Trend Analysis ➞ | |
 | WTI W&T Offshore, Inc. |
| Sector: Energy | |
| SubSector: Oil & Gas Drilling & Exploration | |
| MarketCap: 244.539 Millions | |
| Recent Price: 2.28 Smart Investing & Trading Score: 27 | |
| Day Percent Change: 2.24% Day Change: 0.05 | |
| Week Change: -2.98% Year-to-date Change: -30.1% | |
| WTI Links: Profile News Message Board | |
| Charts:- Daily , Weekly | |
| Add WTI to Watchlist: View: Get Complete WTI Trend Analysis ➞ | |
 | UFPI Universal Forest Products, Inc. |
| Sector: Industrials | |
| SubSector: Lumber, Wood Production | |
| MarketCap: 2263.38 Millions | |
| Recent Price: 115.49 Smart Investing & Trading Score: 27 | |
| Day Percent Change: 2.20% Day Change: 2.49 | |
| Week Change: 1.63% Year-to-date Change: -8.0% | |
| UFPI Links: Profile News Message Board | |
| Charts:- Daily , Weekly | |
| Add UFPI to Watchlist: View: Get Complete UFPI Trend Analysis ➞ | |
 | SCLX Scilex Holding Company |
| Sector: Health Care | |
| SubSector: Drug Manufacturers - General | |
| MarketCap: 927 Millions | |
| Recent Price: 0.86 Smart Investing & Trading Score: 27 | |
| Day Percent Change: 1.68% Day Change: 0.01 | |
| Week Change: -3.73% Year-to-date Change: -56.1% | |
| SCLX Links: Profile News Message Board | |
| Charts:- Daily , Weekly | |
| Add SCLX to Watchlist: View: Get Complete SCLX Trend Analysis ➞ | |
 | CEVA CEVA, Inc. |
| Sector: Technology | |
| SubSector: Semiconductor - Specialized | |
| MarketCap: 587.06 Millions | |
| Recent Price: 20.13 Smart Investing & Trading Score: 27 | |
| Day Percent Change: 1.62% Day Change: 0.32 | |
| Week Change: 0.75% Year-to-date Change: -11.4% | |
| CEVA Links: Profile News Message Board | |
| Charts:- Daily , Weekly | |
| Add CEVA to Watchlist: View: Get Complete CEVA Trend Analysis ➞ | |
| Too many stocks? View smallcap stocks filtered by marketcap & sector |
| Marketcap: All SmallCap Stocks (default-no microcap), Large, Mid-Range, Small & MicroCap |
| Sector: Tech, Finance, Energy, Staples, Retail, Industrial, Materials, Utilities & Medical |
|
Best Stocks Today 12Stocks.com |
© 2024 12Stocks.com Terms & Conditions Privacy Contact Us
All Information Provided Only For Education And Not To Be Used For Investing or Trading. See Terms & Conditions


One More Thing ... Get Best Stocks Delivered Daily!
Never Ever Miss A Move With Our Top Ten Stocks Lists
Find Best Stocks In Any Market - Bull or Bear Market
Take A Peek At Our Top Ten Stocks Lists: Daily, Weekly, Year-to-Date & Top Trends
Find Best Stocks In Any Market - Bull or Bear Market
Take A Peek At Our Top Ten Stocks Lists: Daily, Weekly, Year-to-Date & Top Trends
Smallcap Stocks With Best Up Trends [0-bearish to 100-bullish]: Emergent BioSolutions[100], Aspen Aerogels[100], Perdoceo Education[100], Gannett Co[100], Pitney Bowes[100], Benchmark Electronics[100], Origin Materials[100], FormFactor [100], Lantheus [100], Q2 [100], Blueprint Medicines[100]
Best Smallcap Stocks Year-to-Date:
Janux [440.16%], Viking [307.09%], Longboard [273.98%], Alpine Immune[239.23%], Bakkt [187.89%], Avidity Biosciences[182.96%], Vera [170.74%], Cullinan Oncology[169.74%], Super Micro[168.25%], Arcutis Bio[166.25%], Y-mAbs [152.93%] Best Smallcap Stocks This Week:
Deciphera [73.24%], Emergent BioSolutions[71.88%], Eyenovia [48.36%], Aspen Aerogels[48.14%], P3 Health[38.51%], Carvana Co[38.18%], Cue Biopharma[37.73%], Origin Materials[36.24%], TransMedics Group[35.14%], Seres [34.55%], Enovix [32.07%] Best Smallcap Stocks Daily:
Emergent BioSolutions[70.98%], Aspen Aerogels[56.70%], Carvana Co[33.77%], Perdoceo Education[31.46%], Enovix [31.06%], Office Properties[28.00%], Gannett Co[26.97%], Sunnova Energy[25.21%], Pitney Bowes[24.70%], Pulmonx [21.37%], CommScope Holding[20.95%]