
 Login Sign Up


| |||||
 |  | ||||

| 12Stocks.com Market Intelligence |
Best SmallCap Stocks
|
| In a hurry? Small Cap Stock Lists: Performance Trends Table, Stock Charts
Sort Small Cap stocks: Daily, Weekly, Year-to-Date, Market Cap & Trends. Filter Small Cap stocks list by sector: Show all, Tech, Finance, Energy, Staples, Retail, Industrial, Materials, Utilities and HealthCare Filter Small Cap stocks list by size: All Large Medium Small and MicroCap |
| 12Stocks.com Small Cap Stocks Performances & Trends Daily | |||||||||
|
|  The overall Smart Investing & Trading Score is 41 (0-bearish to 100-bullish) which puts Small Cap index in short term neutral trend. The Smart Investing & Trading Score from previous trading session is 88 and hence a deterioration of trend.
| ||||||||
Here are the Smart Investing & Trading Scores of the most requested small cap stocks at 12Stocks.com (click stock name for detailed review):
|


| 12Stocks.com: Investing in Smallcap Index with Stocks | |
|
The following table helps investors and traders sort through current performance and trends (as measured by Smart Investing & Trading Score) of various
stocks in the Smallcap Index. Quick View: Move mouse or cursor over stock symbol (ticker) to view short-term technical chart and over stock name to view long term chart. Click on  to add stock symbol to your watchlist and to add stock symbol to your watchlist and  to view watchlist. Click on any ticker or stock name for detailed market intelligence report for that stock. to view watchlist. Click on any ticker or stock name for detailed market intelligence report for that stock. |
12Stocks.com Performance of Stocks in Smallcap Index
| Ticker | Stock Name | Watchlist | Category | Recent Price | Smart Investing & Trading Score | Change % | YTD Change% |
| PDFS | PDF Solutions |   | Technology | 30.08 | 15 | -3.84% | -6.41% |
| STNE | StoneCo | | Technology | 15.60 | 15 | -3.64% | -13.48% |
| GNW | Genworth Financial | | Financials | 5.93 | 15 | -2.63% | -11.23% |
| ESRT | Empire State | | Financials | 9.10 | 15 | -2.05% | -6.09% |
| MFA | MFA Financial | | Financials | 10.59 | 15 | -1.58% | -6.03% |
| BUSE | First Busey | | Financials | 22.34 | 15 | -0.98% | -9.99% |
| HGV | Hilton Grand | | Services & Goods | 41.64 | 13 | -4.28% | 3.63% |
| NE | Noble | | Energy | 44.38 | 13 | -4.23% | -7.85% |
| KOP | Koppers | | Materials | 51.28 | 13 | -4.10% | 0.12% |
| CALM | Cal-Maine Foods | | Consumer Staples | 55.33 | 13 | -4.04% | -3.59% |
| GATX | GATX | | Transports | 122.36 | 13 | -2.80% | 1.78% |
| SXC | SunCoke Energy | | Materials | 10.31 | 13 | -2.55% | -4.00% |
| CODI | Compass Diversified | | Industrials | 21.97 | 13 | -2.49% | -2.14% |
| WTS | Watts Water | | Industrials | 198.46 | 13 | -1.66% | -4.74% |
| EVTC | EVERTEC | | Technology | 37.53 | 13 | -2.14% | -8.33% |
| LKFN | Lakeland Financial | | Financials | 58.77 | 13 | -0.66% | -9.81% |
| AUR | Aurora Innovation | | Technology | 2.77 | 12 | -9.02% | -37.00% |
| COGT | Cogint | | Technology | 6.50 | 12 | -3.13% | 10.54% |
| SFNC | Simmons First | | Financials | 17.09 | 12 | -2.40% | -13.86% |
| EEX | Emerald Holding | | Services & Goods | 5.75 | 10 | 1.77% | -3.85% |
| CABA | Cabaletta Bio | | Health Care | 10.65 | 10 | 1.57% | -53.11% |
| MKTW | MarketWise | | Technology | 1.57 | 10 | 0.64% | -41.85% |
| CCNE | CNB Financial | | Financials | 19.00 | 10 | 0.32% | -15.89% |
| TSBK | Timberland Bancorp | | Financials | 24.62 | 10 | 0.08% | -21.74% |
| RYAM | Rayonier Advanced | | Materials | 3.73 | 10 | -9.69% | -7.90% |


| Too many stocks? View smallcap stocks filtered by marketcap & sector |
| Marketcap: All SmallCap Stocks (default-no microcap), Large, Mid-Range, Small |
| Smallcap Sector: Tech, Finance, Energy, Staples, Retail, Industrial, Materials, & Medical |
|
Get the most comprehensive stock market coverage daily at 12Stocks.com ➞ Best Stocks Today ➞ Best Stocks Weekly ➞ Best Stocks Year-to-Date ➞ Best Stocks Trends ➞  Best Stocks Today 12Stocks.com Best Nasdaq Stocks ➞ Best S&P 500 Stocks ➞ Best Tech Stocks ➞ Best Biotech Stocks ➞ |
| Detailed Overview of SmallCap Stocks |
| SmallCap Technical Overview, Leaders & Laggards, Top SmallCap ETF Funds & Detailed SmallCap Stocks List, Charts, Trends & More |
| Smallcap: Technical Analysis, Trends & YTD Performance | |
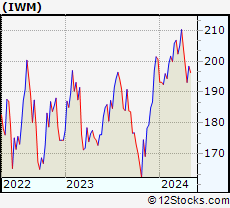
| SmallCap segment as represented by
IWM, an exchange-traded fund [ETF], holds basket of thousands of smallcap stocks from across all major sectors of the US stock market. The smallcap index (contains stocks like Riverbed & Sotheby's) is down by -2.4% and is currently underperforming the overall market by -7.2% year-to-date. Below is a quick view of technical charts and trends: | |
 IWM Weekly Chart |
|
| Long Term Trend: Good | |
| Medium Term Trend: Not Good | |
 IWM Daily Chart |
|
| Short Term Trend: Not Good | |
| Overall Trend Score: 41 | |
| YTD Performance: -2.4% | |
| **Trend Scores & Views Are Only For Educational Purposes And Not For Investing | |
| 12Stocks.com: Top Performing Small Cap Index Stocks | ||||||||||||||||||||||||||||||||||||||||||||||||
 The top performing Small Cap Index stocks year to date are
Now, more recently, over last week, the top performing Small Cap Index stocks on the move are


|
||||||||||||||||||||||||||||||||||||||||||||||||
| 12Stocks.com: Investing in Smallcap Index using Exchange Traded Funds | |
|
The following table shows list of key exchange traded funds (ETF) that
help investors track Smallcap index. The following list also includes leveraged ETF funds that track twice or thrice the daily returns of Smallcap indices. Short or inverse ETF funds move in the opposite direction to the index they track and are useful during market pullbacks or during bear markets. Quick View: Move mouse or cursor over ETF symbol (ticker) to view short-term technical chart and over ETF name to view long term chart. Click on ticker or stock name for detailed view. Click on to add stock symbol to your watchlist and to view watchlist. |
12Stocks.com List of ETFs that track Smallcap Index
| Ticker | ETF Name | Watchlist | Recent Price | Smart Investing & Trading Score | Change % | Week % | Year-to-date % |
| IWM | iShares Russell 2000 | | 195.90 | 41 | -2.03 | -1.26 | -2.4% |
| IJR | iShares Core S&P Small-Cap | | 104.39 | 40 | -1.90 | -1.19 | -3.57% |
| VTWO | Vanguard Russell 2000 ETF | | 79.16 | 41 | -2.01 | -1.32 | -2.39% |
| IWN | iShares Russell 2000 Value | | 149.04 | 25 | -1.98 | -1.39 | -4.05% |
| IWO | iShares Russell 2000 Growth | | 250.32 | 41 | -2.12 | -1.09 | -0.75% |
| IJS | iShares S&P Small-Cap 600 Value | | 96.08 | 22 | -1.91 | -1.14 | -6.78% |
| IJT | iShares S&P Small-Cap 600 Growth | | 124.60 | 53 | -1.86 | -1.18 | -0.43% |
| XSLV | PowerShares S&P SmallCap Low Volatil ETF | | 42.54 | 55 | -0.77 | -0.42 | -3.65% |
| SMLV | SPDR SSGA US Small Cap Low Volatil ETF | | 106.26 | 20 | -1.40 | -1.17 | -5.56% |
| SDD | ProShares UltraShort SmallCap600 | | 19.57 | 37 | 2.51 | 1.14 | 6.21% |
| SAA | ProShares Ultra SmallCap600 | | 22.60 | 33 | -2.88 | -1.91 | -9.42% |
| SBB | ProShares Short SmallCap600 | | 16.55 | 48 | 1.66 | 1.01 | 3.89% |
| 12Stocks.com: Charts, Trends, Fundamental Data and Performances of SmallCap Stocks | |
|
We now take in-depth look at all SmallCap stocks including charts, multi-period performances and overall trends (as measured by Smart Investing & Trading Score). One can sort SmallCap stocks (click link to choose) by Daily, Weekly and by Year-to-Date performances. Also, one can sort by size of the company or by market capitalization. |
| Select Your Default Chart Type: | |||||
| |||||
| Click on stock symbol or name for detailed view. Click on to add stock symbol to your watchlist and to view watchlist. Quick View: Move mouse or cursor over "Daily" to quickly view daily technical stock chart and over "Weekly" to view weekly technical stock chart. | |||||

 | PDFS PDF Solutions, Inc. |
| Sector: Technology | |
| SubSector: Technical & System Software | |
| MarketCap: 345.1 Millions | |
| Recent Price: 30.08 Smart Investing & Trading Score: 15 | |
| Day Percent Change: -3.84% Day Change: -1.20 | |
| Week Change: -3.09% Year-to-date Change: -6.4% | |
| PDFS Links: Profile News Message Board | |
| Charts:- Daily , Weekly | |
| Add PDFS to Watchlist: View: Get Complete PDFS Trend Analysis ➞ | |
 | STNE StoneCo Ltd. |
| Sector: Technology | |
| SubSector: Application Software | |
| MarketCap: 7347.82 Millions | |
| Recent Price: 15.60 Smart Investing & Trading Score: 15 | |
| Day Percent Change: -3.64% Day Change: -0.59 | |
| Week Change: -4.59% Year-to-date Change: -13.5% | |
| STNE Links: Profile News Message Board | |
| Charts:- Daily , Weekly | |
| Add STNE to Watchlist: View: Get Complete STNE Trend Analysis ➞ | |
 | GNW Genworth Financial, Inc. |
| Sector: Financials | |
| SubSector: Life Insurance | |
| MarketCap: 1719.76 Millions | |
| Recent Price: 5.93 Smart Investing & Trading Score: 15 | |
| Day Percent Change: -2.63% Day Change: -0.16 | |
| Week Change: -1% Year-to-date Change: -11.2% | |
| GNW Links: Profile News Message Board | |
| Charts:- Daily , Weekly | |
| Add GNW to Watchlist: View: Get Complete GNW Trend Analysis ➞ | |
 | ESRT Empire State Realty Trust, Inc. |
| Sector: Financials | |
| SubSector: REIT - Diversified | |
| MarketCap: 1632.13 Millions | |
| Recent Price: 9.10 Smart Investing & Trading Score: 15 | |
| Day Percent Change: -2.05% Day Change: -0.19 | |
| Week Change: -1.19% Year-to-date Change: -6.1% | |
| ESRT Links: Profile News Message Board | |
| Charts:- Daily , Weekly | |
| Add ESRT to Watchlist: View: Get Complete ESRT Trend Analysis ➞ | |
 | MFA MFA Financial, Inc. |
| Sector: Financials | |
| SubSector: Mortgage Investment | |
| MarketCap: 1869.69 Millions | |
| Recent Price: 10.59 Smart Investing & Trading Score: 15 | |
| Day Percent Change: -1.58% Day Change: -0.17 | |
| Week Change: -1.3% Year-to-date Change: -6.0% | |
| MFA Links: Profile News Message Board | |
| Charts:- Daily , Weekly | |
| Add MFA to Watchlist: View: Get Complete MFA Trend Analysis ➞ | |
 | BUSE First Busey Corporation |
| Sector: Financials | |
| SubSector: Regional - Midwest Banks | |
| MarketCap: 876.97 Millions | |
| Recent Price: 22.34 Smart Investing & Trading Score: 15 | |
| Day Percent Change: -0.98% Day Change: -0.22 | |
| Week Change: -2.02% Year-to-date Change: -10.0% | |
| BUSE Links: Profile News Message Board | |
| Charts:- Daily , Weekly | |
| Add BUSE to Watchlist: View: Get Complete BUSE Trend Analysis ➞ | |
 | HGV Hilton Grand Vacations Inc. |
| Sector: Services & Goods | |
| SubSector: Resorts & Casinos | |
| MarketCap: 1333.04 Millions | |
| Recent Price: 41.64 Smart Investing & Trading Score: 13 | |
| Day Percent Change: -4.28% Day Change: -1.86 | |
| Week Change: -6.09% Year-to-date Change: 3.6% | |
| HGV Links: Profile News Message Board | |
| Charts:- Daily , Weekly | |
| Add HGV to Watchlist: View: Get Complete HGV Trend Analysis ➞ | |
 | NE Noble Corporation Plc |
| Sector: Energy | |
| SubSector: Oil & Gas Drilling | |
| MarketCap: 5520 Millions | |
| Recent Price: 44.38 Smart Investing & Trading Score: 13 | |
| Day Percent Change: -4.23% Day Change: -1.96 | |
| Week Change: -4.13% Year-to-date Change: -7.9% | |
| NE Links: Profile News Message Board | |
| Charts:- Daily , Weekly | |
| Add NE to Watchlist: View: Get Complete NE Trend Analysis ➞ | |
 | KOP Koppers Holdings Inc. |
| Sector: Materials | |
| SubSector: Specialty Chemicals | |
| MarketCap: 232.657 Millions | |
| Recent Price: 51.28 Smart Investing & Trading Score: 13 | |
| Day Percent Change: -4.10% Day Change: -2.19 | |
| Week Change: -2.75% Year-to-date Change: 0.1% | |
| KOP Links: Profile News Message Board | |
| Charts:- Daily , Weekly | |
| Add KOP to Watchlist: View: Get Complete KOP Trend Analysis ➞ | |
 | CALM Cal-Maine Foods, Inc. |
| Sector: Consumer Staples | |
| SubSector: Food - Major Diversified | |
| MarketCap: 2177.13 Millions | |
| Recent Price: 55.33 Smart Investing & Trading Score: 13 | |
| Day Percent Change: -4.04% Day Change: -2.33 | |
| Week Change: -2.71% Year-to-date Change: -3.6% | |
| CALM Links: Profile News Message Board | |
| Charts:- Daily , Weekly | |
| Add CALM to Watchlist: View: Get Complete CALM Trend Analysis ➞ | |
 | GATX GATX Corporation |
| Sector: Transports | |
| SubSector: Rental & Leasing Services | |
| MarketCap: 2080.34 Millions | |
| Recent Price: 122.36 Smart Investing & Trading Score: 13 | |
| Day Percent Change: -2.80% Day Change: -3.53 | |
| Week Change: -4.04% Year-to-date Change: 1.8% | |
| GATX Links: Profile News Message Board | |
| Charts:- Daily , Weekly | |
| Add GATX to Watchlist: View: Get Complete GATX Trend Analysis ➞ | |
 | SXC SunCoke Energy, Inc. |
| Sector: Materials | |
| SubSector: Nonmetallic Mineral Mining | |
| MarketCap: 306.5 Millions | |
| Recent Price: 10.31 Smart Investing & Trading Score: 13 | |
| Day Percent Change: -2.55% Day Change: -0.27 | |
| Week Change: -2.46% Year-to-date Change: -4.0% | |
| SXC Links: Profile News Message Board | |
| Charts:- Daily , Weekly | |
| Add SXC to Watchlist: View: Get Complete SXC Trend Analysis ➞ | |
 | CODI Compass Diversified Holdings LLC |
| Sector: Industrials | |
| SubSector: Conglomerates | |
| MarketCap: 803.348 Millions | |
| Recent Price: 21.97 Smart Investing & Trading Score: 13 | |
| Day Percent Change: -2.49% Day Change: -0.56 | |
| Week Change: -2.87% Year-to-date Change: -2.1% | |
| CODI Links: Profile News Message Board | |
| Charts:- Daily , Weekly | |
| Add CODI to Watchlist: View: Get Complete CODI Trend Analysis ➞ | |
 | WTS Watts Water Technologies, Inc. |
| Sector: Industrials | |
| SubSector: Industrial Equipment & Components | |
| MarketCap: 2903.29 Millions | |
| Recent Price: 198.46 Smart Investing & Trading Score: 13 | |
| Day Percent Change: -1.66% Day Change: -3.34 | |
| Week Change: -1.51% Year-to-date Change: -4.7% | |
| WTS Links: Profile News Message Board | |
| Charts:- Daily , Weekly | |
| Add WTS to Watchlist: View: Get Complete WTS Trend Analysis ➞ | |
 | EVTC EVERTEC, Inc. |
| Sector: Technology | |
| SubSector: Business Software & Services | |
| MarketCap: 1646.08 Millions | |
| Recent Price: 37.53 Smart Investing & Trading Score: 13 | |
| Day Percent Change: -2.14% Day Change: -0.82 | |
| Week Change: -2.34% Year-to-date Change: -8.3% | |
| EVTC Links: Profile News Message Board | |
| Charts:- Daily , Weekly | |
| Add EVTC to Watchlist: View: Get Complete EVTC Trend Analysis ➞ | |
 | LKFN Lakeland Financial Corporation |
| Sector: Financials | |
| SubSector: Regional - Midwest Banks | |
| MarketCap: 903.27 Millions | |
| Recent Price: 58.77 Smart Investing & Trading Score: 13 | |
| Day Percent Change: -0.66% Day Change: -0.39 | |
| Week Change: -1.67% Year-to-date Change: -9.8% | |
| LKFN Links: Profile News Message Board | |
| Charts:- Daily , Weekly | |
| Add LKFN to Watchlist: View: Get Complete LKFN Trend Analysis ➞ | |
 | AUR Aurora Innovation, Inc. |
| Sector: Technology | |
| SubSector: Information Technology Services | |
| MarketCap: 3220 Millions | |
| Recent Price: 2.77 Smart Investing & Trading Score: 12 | |
| Day Percent Change: -9.02% Day Change: -0.27 | |
| Week Change: -7.96% Year-to-date Change: -37.0% | |
| AUR Links: Profile News Message Board | |
| Charts:- Daily , Weekly | |
| Add AUR to Watchlist: View: Get Complete AUR Trend Analysis ➞ | |
 | COGT Cogint, Inc. |
| Sector: Technology | |
| SubSector: Business Software & Services | |
| MarketCap: 214.55 Millions | |
| Recent Price: 6.50 Smart Investing & Trading Score: 12 | |
| Day Percent Change: -3.13% Day Change: -0.21 | |
| Week Change: 7.97% Year-to-date Change: 10.5% | |
| COGT Links: Profile News Message Board | |
| Charts:- Daily , Weekly | |
| Add COGT to Watchlist: View: Get Complete COGT Trend Analysis ➞ | |
 | SFNC Simmons First National Corporation |
| Sector: Financials | |
| SubSector: Money Center Banks | |
| MarketCap: 2125.49 Millions | |
| Recent Price: 17.09 Smart Investing & Trading Score: 12 | |
| Day Percent Change: -2.40% Day Change: -0.42 | |
| Week Change: -2.34% Year-to-date Change: -13.9% | |
| SFNC Links: Profile News Message Board | |
| Charts:- Daily , Weekly | |
| Add SFNC to Watchlist: View: Get Complete SFNC Trend Analysis ➞ | |
 | EEX Emerald Holding, Inc. |
| Sector: Services & Goods | |
| SubSector: Business Services | |
| MarketCap: 252.682 Millions | |
| Recent Price: 5.75 Smart Investing & Trading Score: 10 | |
| Day Percent Change: 1.77% Day Change: 0.10 | |
| Week Change: -1.88% Year-to-date Change: -3.9% | |
| EEX Links: Profile News Message Board | |
| Charts:- Daily , Weekly | |
| Add EEX to Watchlist: View: Get Complete EEX Trend Analysis ➞ | |
 | CABA Cabaletta Bio, Inc. |
| Sector: Health Care | |
| SubSector: Biotechnology | |
| MarketCap: 222.085 Millions | |
| Recent Price: 10.65 Smart Investing & Trading Score: 10 | |
| Day Percent Change: 1.57% Day Change: 0.16 | |
| Week Change: -3.32% Year-to-date Change: -53.1% | |
| CABA Links: Profile News Message Board | |
| Charts:- Daily , Weekly | |
| Add CABA to Watchlist: View: Get Complete CABA Trend Analysis ➞ | |
 | MKTW MarketWise, Inc. |
| Sector: Technology | |
| SubSector: Software - Application | |
| MarketCap: 646 Millions | |
| Recent Price: 1.57 Smart Investing & Trading Score: 10 | |
| Day Percent Change: 0.64% Day Change: 0.01 | |
| Week Change: -2.18% Year-to-date Change: -41.9% | |
| MKTW Links: Profile News Message Board | |
| Charts:- Daily , Weekly | |
| Add MKTW to Watchlist: View: Get Complete MKTW Trend Analysis ➞ | |
 | CCNE CNB Financial Corporation |
| Sector: Financials | |
| SubSector: Regional - Northeast Banks | |
| MarketCap: 286.599 Millions | |
| Recent Price: 19.00 Smart Investing & Trading Score: 10 | |
| Day Percent Change: 0.32% Day Change: 0.06 | |
| Week Change: -0.37% Year-to-date Change: -15.9% | |
| CCNE Links: Profile News Message Board | |
| Charts:- Daily , Weekly | |
| Add CCNE to Watchlist: View: Get Complete CCNE Trend Analysis ➞ | |
 | TSBK Timberland Bancorp, Inc. |
| Sector: Financials | |
| SubSector: Savings & Loans | |
| MarketCap: 155.03 Millions | |
| Recent Price: 24.62 Smart Investing & Trading Score: 10 | |
| Day Percent Change: 0.08% Day Change: 0.02 | |
| Week Change: -2.5% Year-to-date Change: -21.7% | |
| TSBK Links: Profile News Message Board | |
| Charts:- Daily , Weekly | |
| Add TSBK to Watchlist: View: Get Complete TSBK Trend Analysis ➞ | |
 | RYAM Rayonier Advanced Materials Inc. |
| Sector: Materials | |
| SubSector: Chemicals - Major Diversified | |
| MarketCap: 116.736 Millions | |
| Recent Price: 3.73 Smart Investing & Trading Score: 10 | |
| Day Percent Change: -9.69% Day Change: -0.40 | |
| Week Change: -4.11% Year-to-date Change: -7.9% | |
| RYAM Links: Profile News Message Board | |
| Charts:- Daily , Weekly | |
| Add RYAM to Watchlist: View: Get Complete RYAM Trend Analysis ➞ | |
| Too many stocks? View smallcap stocks filtered by marketcap & sector |
| Marketcap: All SmallCap Stocks (default-no microcap), Large, Mid-Range, Small & MicroCap |
| Sector: Tech, Finance, Energy, Staples, Retail, Industrial, Materials, Utilities & Medical |
|
Best Stocks Today 12Stocks.com |
© 2024 12Stocks.com Terms & Conditions Privacy Contact Us
All Information Provided Only For Education And Not To Be Used For Investing or Trading. See Terms & Conditions


One More Thing ... Get Best Stocks Delivered Daily!
Never Ever Miss A Move With Our Top Ten Stocks Lists
Find Best Stocks In Any Market - Bull or Bear Market
Take A Peek At Our Top Ten Stocks Lists: Daily, Weekly, Year-to-Date & Top Trends
Find Best Stocks In Any Market - Bull or Bear Market
Take A Peek At Our Top Ten Stocks Lists: Daily, Weekly, Year-to-Date & Top Trends
Smallcap Stocks With Best Up Trends [0-bearish to 100-bullish]: GrowGeneration [100], LendingTree [100], SES AI[100], Allegheny [100], AnaptysBio [100], LSB Industries[100], Clearwater Paper[100], Brinker [100], TPI Composites[100], Innovative Industrial[100], Day One[100]
Best Smallcap Stocks Year-to-Date:
Janux [431.32%], Viking [327.62%], Longboard [248.61%], Alpine Immune[239.23%], Super Micro[202.12%], Bakkt [200.9%], Avidity Biosciences[166.92%], Cullinan Oncology[164.93%], Arcutis Bio[157.59%], Vera [155.36%], Hippo [134.8%] Best Smallcap Stocks This Week:
Deciphera [72.49%], Cue Biopharma[39.19%], GrowGeneration [34.68%], Phibro Animal[31.19%], LendingTree [27.36%], Janux [20.3%], Seres [20.07%], Eyenovia [19.55%], P3 Health[18.22%], Heartland Financial[17.89%], Harmonic [16.74%] Best Smallcap Stocks Daily:
Cue Biopharma[33.80%], GrowGeneration [30.00%], LendingTree [29.24%], SES AI[17.04%], Allegheny [15.03%], AnaptysBio [14.27%], Harmonic [14.26%], LSB Industries[13.14%], P3 Health[12.09%], Clearwater Paper[10.69%], Seres [8.98%]