
 Login Sign Up


| |||||
 |  | ||||

| 12Stocks.com Market Intelligence |
Best SmallCap Stocks
|
| In a hurry? Small Cap Stock Lists: Performance Trends Table, Stock Charts
Sort Small Cap stocks: Daily, Weekly, Year-to-Date, Market Cap & Trends. Filter Small Cap stocks list by sector: Show all, Tech, Finance, Energy, Staples, Retail, Industrial, Materials, Utilities and HealthCare Filter Small Cap stocks list by size: All Large Medium Small and MicroCap |
| 12Stocks.com Small Cap Stocks Performances & Trends Daily | |||||||||
|
|  The overall Smart Investing & Trading Score is 88 (0-bearish to 100-bullish) which puts Small Cap index in short term bullish trend. The Smart Investing & Trading Score from previous trading session is 56 and hence an improvement of trend.
| ||||||||
Here are the Smart Investing & Trading Scores of the most requested small cap stocks at 12Stocks.com (click stock name for detailed review):
|


| 12Stocks.com: Investing in Smallcap Index with Stocks | |
|
The following table helps investors and traders sort through current performance and trends (as measured by Smart Investing & Trading Score) of various
stocks in the Smallcap Index. Quick View: Move mouse or cursor over stock symbol (ticker) to view short-term technical chart and over stock name to view long term chart. Click on  to add stock symbol to your watchlist and to add stock symbol to your watchlist and  to view watchlist. Click on any ticker or stock name for detailed market intelligence report for that stock. to view watchlist. Click on any ticker or stock name for detailed market intelligence report for that stock. |
12Stocks.com Performance of Stocks in Smallcap Index
| Ticker | Stock Name | Watchlist | Category | Recent Price | Smart Investing & Trading Score | Change % | YTD Change% |
| FBMS | First Bancshares |   | Financials | 23.97 | 42 | 0.27% | -18.29% |
| ATRC | AtriCure | | Health Care | 23.23 | 42 | 0.26% | -34.91% |
| RDFN | Redfin | | Technology | 5.63 | 42 | 0.18% | -45.45% |
| NATH | Nathan s | | Services & Goods | 64.70 | 42 | 0.12% | -17.06% |
| PFS | Provident Financial | | Financials | 15.10 | 42 | 0.07% | -16.25% |
| WLFC | Willis Lease | | Transports | 49.05 | 42 | 0.00% | 0.35% |
| NWFL | Norwood Financial | | Financials | 24.37 | 42 | 0.00% | -25.95% |
| FRBA | First Bank | | Financials | 12.14 | 42 | 0.00% | -17.41% |
| SSTI | ShotSpotter | | Technology | 13.46 | 42 | -1.54% | -47.30% |
| FBIZ | First Business | | Financials | 33.73 | 42 | -1.49% | -15.89% |
| FNKO | Funko | | Consumer Staples | 6.11 | 42 | -1.45% | -20.96% |
| SFBS | ServisFirst Bancshares | | Financials | 59.95 | 42 | -1.32% | -10.03% |
| RLGT | Radiant Logistics | | Transports | 5.07 | 42 | -1.27% | -23.72% |
| BIGC | BigCommerce | | Technology | 5.83 | 42 | -1.19% | -40.14% |
| SYBT | Stock Yards | | Financials | 45.63 | 42 | -1.13% | -11.38% |
| INFU | InfuSystem | | Health Care | 8.03 | 42 | -1.11% | -23.81% |
| BANR | Banner | | Financials | 44.87 | 42 | -1.08% | -16.22% |
| VBTX | Veritex | | Financials | 19.99 | 42 | -0.89% | -14.10% |
| HBNC | Horizon Bancorp | | Financials | 11.57 | 42 | -0.77% | -19.15% |
| UCBI | United Community | | Financials | 25.79 | 42 | -0.73% | -11.86% |
| MRTN | Marten Transport | | Transports | 16.84 | 42 | -0.59% | -19.73% |
| BUSE | First Busey | | Financials | 22.66 | 42 | -0.59% | -8.68% |
| BHLB | Berkshire Hills | | Financials | 21.98 | 42 | -0.57% | -11.50% |
| SRDX | Surmodics | | Health Care | 26.04 | 42 | -0.50% | -28.36% |
| VICR | Vicor | | Technology | 34.28 | 42 | -0.38% | -23.72% |


| Too many stocks? View smallcap stocks filtered by marketcap & sector |
| Marketcap: All SmallCap Stocks (default-no microcap), Large, Mid-Range, Small |
| Smallcap Sector: Tech, Finance, Energy, Staples, Retail, Industrial, Materials, & Medical |
|
Get the most comprehensive stock market coverage daily at 12Stocks.com ➞ Best Stocks Today ➞ Best Stocks Weekly ➞ Best Stocks Year-to-Date ➞ Best Stocks Trends ➞  Best Stocks Today 12Stocks.com Best Nasdaq Stocks ➞ Best S&P 500 Stocks ➞ Best Tech Stocks ➞ Best Biotech Stocks ➞ |
| Detailed Overview of SmallCap Stocks |
| SmallCap Technical Overview, Leaders & Laggards, Top SmallCap ETF Funds & Detailed SmallCap Stocks List, Charts, Trends & More |
| Smallcap: Technical Analysis, Trends & YTD Performance | |
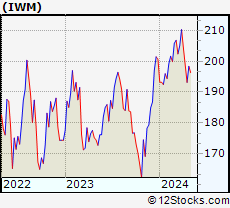
| SmallCap segment as represented by
IWM, an exchange-traded fund [ETF], holds basket of thousands of smallcap stocks from across all major sectors of the US stock market. The smallcap index (contains stocks like Riverbed & Sotheby's) is down by -0.36% and is currently underperforming the overall market by -6.65% year-to-date. Below is a quick view of technical charts and trends: | |
 IWM Weekly Chart |
|
| Long Term Trend: Very Good | |
| Medium Term Trend: Good | |
 IWM Daily Chart |
|
| Short Term Trend: Very Good | |
| Overall Trend Score: 88 | |
| YTD Performance: -0.36% | |
| **Trend Scores & Views Are Only For Educational Purposes And Not For Investing | |
| 12Stocks.com: Top Performing Small Cap Index Stocks | ||||||||||||||||||||||||||||||||||||||||||||||||
 The top performing Small Cap Index stocks year to date are
Now, more recently, over last week, the top performing Small Cap Index stocks on the move are


|
||||||||||||||||||||||||||||||||||||||||||||||||
| 12Stocks.com: Investing in Smallcap Index using Exchange Traded Funds | |
|
The following table shows list of key exchange traded funds (ETF) that
help investors track Smallcap index. The following list also includes leveraged ETF funds that track twice or thrice the daily returns of Smallcap indices. Short or inverse ETF funds move in the opposite direction to the index they track and are useful during market pullbacks or during bear markets. Quick View: Move mouse or cursor over ETF symbol (ticker) to view short-term technical chart and over ETF name to view long term chart. Click on ticker or stock name for detailed view. Click on to add stock symbol to your watchlist and to view watchlist. |
12Stocks.com List of ETFs that track Smallcap Index
| Ticker | ETF Name | Watchlist | Recent Price | Smart Investing & Trading Score | Change % | Week % | Year-to-date % |
| IWM | iShares Russell 2000 | | 199.98 | 88 | 0.80 | 0.8 | -0.36% |
| VTWO | Vanguard Russell 2000 ETF | | 80.77 | 88 | 0.69 | 0.69 | -0.41% |
| IWN | iShares Russell 2000 Value | | 152.09 | 93 | 0.63 | 0.63 | -2.09% |
| IJR | iShares Core S&P Small-Cap | | 106.37 | 93 | 0.68 | 0.68 | -1.74% |
| IWO | iShares Russell 2000 Growth | | 255.17 | 78 | 0.82 | 0.82 | 1.17% |
| IJS | iShares S&P Small-Cap 600 Value | | 97.96 | 70 | 0.79 | 0.79 | -4.96% |
| XSLV | PowerShares S&P SmallCap Low Volatil ETF | | 42.97 | 80 | 0.59 | 0.59 | -2.67% |
| IJT | iShares S&P Small-Cap 600 Growth | | 126.09 | 88 | 0.00 | 0 | 0.76% |
| SAA | ProShares Ultra SmallCap600 | | 23.27 | 88 | 1.00 | 1 | -6.73% |
| SBB | ProShares Short SmallCap600 | | 16.28 | 8 | -0.64 | -0.64 | 2.2% |
| SMLV | SPDR SSGA US Small Cap Low Volatil ETF | | 107.62 | 75 | 0.10 | 0.1 | -4.35% |
| SDD | ProShares UltraShort SmallCap600 | | 19.09 | 15 | -1.34 | -1.34 | 3.6% |
| 12Stocks.com: Charts, Trends, Fundamental Data and Performances of SmallCap Stocks | |
|
We now take in-depth look at all SmallCap stocks including charts, multi-period performances and overall trends (as measured by Smart Investing & Trading Score). One can sort SmallCap stocks (click link to choose) by Daily, Weekly and by Year-to-Date performances. Also, one can sort by size of the company or by market capitalization. |
| Select Your Default Chart Type: | |||||
| |||||
| Click on stock symbol or name for detailed view. Click on to add stock symbol to your watchlist and to view watchlist. Quick View: Move mouse or cursor over "Daily" to quickly view daily technical stock chart and over "Weekly" to view weekly technical stock chart. | |||||

 | FBMS The First Bancshares, Inc. |
| Sector: Financials | |
| SubSector: Regional - Southeast Banks | |
| MarketCap: 359.535 Millions | |
| Recent Price: 23.97 Smart Investing & Trading Score: 42 | |
| Day Percent Change: 0.27% Day Change: 0.07 | |
| Week Change: 0.27% Year-to-date Change: -18.3% | |
| FBMS Links: Profile News Message Board | |
| Charts:- Daily , Weekly | |
| Add FBMS to Watchlist: View: Get Complete FBMS Trend Analysis ➞ | |
 | ATRC AtriCure, Inc. |
| Sector: Health Care | |
| SubSector: Medical Instruments & Supplies | |
| MarketCap: 1158.7 Millions | |
| Recent Price: 23.23 Smart Investing & Trading Score: 42 | |
| Day Percent Change: 0.26% Day Change: 0.06 | |
| Week Change: 0.26% Year-to-date Change: -34.9% | |
| ATRC Links: Profile News Message Board | |
| Charts:- Daily , Weekly | |
| Add ATRC to Watchlist: View: Get Complete ATRC Trend Analysis ➞ | |
 | RDFN Redfin Corporation |
| Sector: Technology | |
| SubSector: Internet Information Providers | |
| MarketCap: 1356.2 Millions | |
| Recent Price: 5.63 Smart Investing & Trading Score: 42 | |
| Day Percent Change: 0.18% Day Change: 0.01 | |
| Week Change: 0.18% Year-to-date Change: -45.5% | |
| RDFN Links: Profile News Message Board | |
| Charts:- Daily , Weekly | |
| Add RDFN to Watchlist: View: Get Complete RDFN Trend Analysis ➞ | |
 | NATH Nathan s Famous, Inc. |
| Sector: Services & Goods | |
| SubSector: Restaurants | |
| MarketCap: 211.77 Millions | |
| Recent Price: 64.70 Smart Investing & Trading Score: 42 | |
| Day Percent Change: 0.12% Day Change: 0.08 | |
| Week Change: 0.12% Year-to-date Change: -17.1% | |
| NATH Links: Profile News Message Board | |
| Charts:- Daily , Weekly | |
| Add NATH to Watchlist: View: Get Complete NATH Trend Analysis ➞ | |
 | PFS Provident Financial Services, Inc. |
| Sector: Financials | |
| SubSector: Savings & Loans | |
| MarketCap: 829.73 Millions | |
| Recent Price: 15.10 Smart Investing & Trading Score: 42 | |
| Day Percent Change: 0.07% Day Change: 0.01 | |
| Week Change: 0.07% Year-to-date Change: -16.3% | |
| PFS Links: Profile News Message Board | |
| Charts:- Daily , Weekly | |
| Add PFS to Watchlist: View: Get Complete PFS Trend Analysis ➞ | |
 | WLFC Willis Lease Finance Corporation |
| Sector: Transports | |
| SubSector: Rental & Leasing Services | |
| MarketCap: 122.044 Millions | |
| Recent Price: 49.05 Smart Investing & Trading Score: 42 | |
| Day Percent Change: 0.00% Day Change: 0.00 | |
| Week Change: 0% Year-to-date Change: 0.4% | |
| WLFC Links: Profile News Message Board | |
| Charts:- Daily , Weekly | |
| Add WLFC to Watchlist: View: Get Complete WLFC Trend Analysis ➞ | |
 | NWFL Norwood Financial Corp. |
| Sector: Financials | |
| SubSector: Regional - Northeast Banks | |
| MarketCap: 201.899 Millions | |
| Recent Price: 24.37 Smart Investing & Trading Score: 42 | |
| Day Percent Change: 0.00% Day Change: 0.00 | |
| Week Change: 0% Year-to-date Change: -26.0% | |
| NWFL Links: Profile News Message Board | |
| Charts:- Daily , Weekly | |
| Add NWFL to Watchlist: View: Get Complete NWFL Trend Analysis ➞ | |
 | FRBA First Bank |
| Sector: Financials | |
| SubSector: Regional - Mid-Atlantic Banks | |
| MarketCap: 124.859 Millions | |
| Recent Price: 12.14 Smart Investing & Trading Score: 42 | |
| Day Percent Change: 0.00% Day Change: 0.00 | |
| Week Change: 0% Year-to-date Change: -17.4% | |
| FRBA Links: Profile News Message Board | |
| Charts:- Daily , Weekly | |
| Add FRBA to Watchlist: View: Get Complete FRBA Trend Analysis ➞ | |
 | SSTI ShotSpotter, Inc. |
| Sector: Technology | |
| SubSector: Application Software | |
| MarketCap: 353.062 Millions | |
| Recent Price: 13.46 Smart Investing & Trading Score: 42 | |
| Day Percent Change: -1.54% Day Change: -0.21 | |
| Week Change: -1.54% Year-to-date Change: -47.3% | |
| SSTI Links: Profile News Message Board | |
| Charts:- Daily , Weekly | |
| Add SSTI to Watchlist: View: Get Complete SSTI Trend Analysis ➞ | |
 | FBIZ First Business Financial Services, Inc. |
| Sector: Financials | |
| SubSector: Regional - Midwest Banks | |
| MarketCap: 144.97 Millions | |
| Recent Price: 33.73 Smart Investing & Trading Score: 42 | |
| Day Percent Change: -1.49% Day Change: -0.51 | |
| Week Change: -1.49% Year-to-date Change: -15.9% | |
| FBIZ Links: Profile News Message Board | |
| Charts:- Daily , Weekly | |
| Add FBIZ to Watchlist: View: Get Complete FBIZ Trend Analysis ➞ | |
 | FNKO Funko, Inc. |
| Sector: Consumer Staples | |
| SubSector: Toys & Games | |
| MarketCap: 246.38 Millions | |
| Recent Price: 6.11 Smart Investing & Trading Score: 42 | |
| Day Percent Change: -1.45% Day Change: -0.09 | |
| Week Change: -1.45% Year-to-date Change: -21.0% | |
| FNKO Links: Profile News Message Board | |
| Charts:- Daily , Weekly | |
| Add FNKO to Watchlist: View: Get Complete FNKO Trend Analysis ➞ | |
 | SFBS ServisFirst Bancshares, Inc. |
| Sector: Financials | |
| SubSector: Foreign Money Center Banks | |
| MarketCap: 1596.71 Millions | |
| Recent Price: 59.95 Smart Investing & Trading Score: 42 | |
| Day Percent Change: -1.32% Day Change: -0.80 | |
| Week Change: -1.32% Year-to-date Change: -10.0% | |
| SFBS Links: Profile News Message Board | |
| Charts:- Daily , Weekly | |
| Add SFBS to Watchlist: View: Get Complete SFBS Trend Analysis ➞ | |
 | RLGT Radiant Logistics, Inc. |
| Sector: Transports | |
| SubSector: Air Delivery & Freight Services | |
| MarketCap: 180.868 Millions | |
| Recent Price: 5.07 Smart Investing & Trading Score: 42 | |
| Day Percent Change: -1.27% Day Change: -0.06 | |
| Week Change: -1.27% Year-to-date Change: -23.7% | |
| RLGT Links: Profile News Message Board | |
| Charts:- Daily , Weekly | |
| Add RLGT to Watchlist: View: Get Complete RLGT Trend Analysis ➞ | |
 | BIGC BigCommerce Holdings, Inc. |
| Sector: Technology | |
| SubSector: Software Application | |
| MarketCap: 47587 Millions | |
| Recent Price: 5.83 Smart Investing & Trading Score: 42 | |
| Day Percent Change: -1.19% Day Change: -0.07 | |
| Week Change: -1.19% Year-to-date Change: -40.1% | |
| BIGC Links: Profile News Message Board | |
| Charts:- Daily , Weekly | |
| Add BIGC to Watchlist: View: Get Complete BIGC Trend Analysis ➞ | |
 | SYBT Stock Yards Bancorp, Inc. |
| Sector: Financials | |
| SubSector: Regional - Southeast Banks | |
| MarketCap: 629.235 Millions | |
| Recent Price: 45.63 Smart Investing & Trading Score: 42 | |
| Day Percent Change: -1.13% Day Change: -0.52 | |
| Week Change: -1.13% Year-to-date Change: -11.4% | |
| SYBT Links: Profile News Message Board | |
| Charts:- Daily , Weekly | |
| Add SYBT to Watchlist: View: Get Complete SYBT Trend Analysis ➞ | |
 | INFU InfuSystem Holdings Inc. |
| Sector: Health Care | |
| SubSector: Medical Instruments & Supplies | |
| MarketCap: 136.76 Millions | |
| Recent Price: 8.03 Smart Investing & Trading Score: 42 | |
| Day Percent Change: -1.11% Day Change: -0.09 | |
| Week Change: -1.11% Year-to-date Change: -23.8% | |
| INFU Links: Profile News Message Board | |
| Charts:- Daily , Weekly | |
| Add INFU to Watchlist: View: Get Complete INFU Trend Analysis ➞ | |
 | BANR Banner Corporation |
| Sector: Financials | |
| SubSector: Regional - Mid-Atlantic Banks | |
| MarketCap: 1187.09 Millions | |
| Recent Price: 44.87 Smart Investing & Trading Score: 42 | |
| Day Percent Change: -1.08% Day Change: -0.49 | |
| Week Change: -1.08% Year-to-date Change: -16.2% | |
| BANR Links: Profile News Message Board | |
| Charts:- Daily , Weekly | |
| Add BANR to Watchlist: View: Get Complete BANR Trend Analysis ➞ | |
 | VBTX Veritex Holdings, Inc. |
| Sector: Financials | |
| SubSector: Regional - Southwest Banks | |
| MarketCap: 625.165 Millions | |
| Recent Price: 19.99 Smart Investing & Trading Score: 42 | |
| Day Percent Change: -0.89% Day Change: -0.18 | |
| Week Change: -0.89% Year-to-date Change: -14.1% | |
| VBTX Links: Profile News Message Board | |
| Charts:- Daily , Weekly | |
| Add VBTX to Watchlist: View: Get Complete VBTX Trend Analysis ➞ | |
 | HBNC Horizon Bancorp, Inc. |
| Sector: Financials | |
| SubSector: Regional - Northeast Banks | |
| MarketCap: 405.999 Millions | |
| Recent Price: 11.57 Smart Investing & Trading Score: 42 | |
| Day Percent Change: -0.77% Day Change: -0.09 | |
| Week Change: -0.77% Year-to-date Change: -19.2% | |
| HBNC Links: Profile News Message Board | |
| Charts:- Daily , Weekly | |
| Add HBNC to Watchlist: View: Get Complete HBNC Trend Analysis ➞ | |
 | UCBI United Community Banks, Inc. |
| Sector: Financials | |
| SubSector: Regional - Mid-Atlantic Banks | |
| MarketCap: 1593.99 Millions | |
| Recent Price: 25.79 Smart Investing & Trading Score: 42 | |
| Day Percent Change: -0.73% Day Change: -0.19 | |
| Week Change: -0.73% Year-to-date Change: -11.9% | |
| UCBI Links: Profile News Message Board | |
| Charts:- Daily , Weekly | |
| Add UCBI to Watchlist: View: Get Complete UCBI Trend Analysis ➞ | |
 | MRTN Marten Transport, Ltd. |
| Sector: Transports | |
| SubSector: Trucking | |
| MarketCap: 1012.15 Millions | |
| Recent Price: 16.84 Smart Investing & Trading Score: 42 | |
| Day Percent Change: -0.59% Day Change: -0.10 | |
| Week Change: -0.59% Year-to-date Change: -19.7% | |
| MRTN Links: Profile News Message Board | |
| Charts:- Daily , Weekly | |
| Add MRTN to Watchlist: View: Get Complete MRTN Trend Analysis ➞ | |
 | BUSE First Busey Corporation |
| Sector: Financials | |
| SubSector: Regional - Midwest Banks | |
| MarketCap: 876.97 Millions | |
| Recent Price: 22.66 Smart Investing & Trading Score: 42 | |
| Day Percent Change: -0.59% Day Change: -0.14 | |
| Week Change: -0.59% Year-to-date Change: -8.7% | |
| BUSE Links: Profile News Message Board | |
| Charts:- Daily , Weekly | |
| Add BUSE to Watchlist: View: Get Complete BUSE Trend Analysis ➞ | |
 | BHLB Berkshire Hills Bancorp, Inc. |
| Sector: Financials | |
| SubSector: Savings & Loans | |
| MarketCap: 686.33 Millions | |
| Recent Price: 21.98 Smart Investing & Trading Score: 42 | |
| Day Percent Change: -0.57% Day Change: -0.13 | |
| Week Change: -0.57% Year-to-date Change: -11.5% | |
| BHLB Links: Profile News Message Board | |
| Charts:- Daily , Weekly | |
| Add BHLB to Watchlist: View: Get Complete BHLB Trend Analysis ➞ | |
 | SRDX Surmodics, Inc. |
| Sector: Health Care | |
| SubSector: Diagnostic Substances | |
| MarketCap: 388.171 Millions | |
| Recent Price: 26.04 Smart Investing & Trading Score: 42 | |
| Day Percent Change: -0.50% Day Change: -0.13 | |
| Week Change: -0.5% Year-to-date Change: -28.4% | |
| SRDX Links: Profile News Message Board | |
| Charts:- Daily , Weekly | |
| Add SRDX to Watchlist: View: Get Complete SRDX Trend Analysis ➞ | |
 | VICR Vicor Corporation |
| Sector: Technology | |
| SubSector: Diversified Electronics | |
| MarketCap: 1526.76 Millions | |
| Recent Price: 34.28 Smart Investing & Trading Score: 42 | |
| Day Percent Change: -0.38% Day Change: -0.13 | |
| Week Change: -0.38% Year-to-date Change: -23.7% | |
| VICR Links: Profile News Message Board | |
| Charts:- Daily , Weekly | |
| Add VICR to Watchlist: View: Get Complete VICR Trend Analysis ➞ | |
| Too many stocks? View smallcap stocks filtered by marketcap & sector |
| Marketcap: All SmallCap Stocks (default-no microcap), Large, Mid-Range, Small & MicroCap |
| Sector: Tech, Finance, Energy, Staples, Retail, Industrial, Materials, Utilities & Medical |
|
Best Stocks Today 12Stocks.com |
© 2024 12Stocks.com Terms & Conditions Privacy Contact Us
All Information Provided Only For Education And Not To Be Used For Investing or Trading. See Terms & Conditions


One More Thing ... Get Best Stocks Delivered Daily!
Never Ever Miss A Move With Our Top Ten Stocks Lists
Find Best Stocks In Any Market - Bull or Bear Market
Take A Peek At Our Top Ten Stocks Lists: Daily, Weekly, Year-to-Date & Top Trends
Find Best Stocks In Any Market - Bull or Bear Market
Take A Peek At Our Top Ten Stocks Lists: Daily, Weekly, Year-to-Date & Top Trends
Smallcap Stocks With Best Up Trends [0-bearish to 100-bullish]: Bakkt [100], Deciphera [100], Phibro Animal[100], Heartland Financial[100], Sight Sciences[100], PTC [100], TPI Composites[100], Cullinan Oncology[100], Fulton Financial[100], Xencor [100], Richardson Electronics[100]
Best Smallcap Stocks Year-to-Date:
Janux [413.54%], Bakkt [355.16%], Viking [305.7%], Alpine Immune[239.57%], Longboard [237.23%], Super Micro[213.88%], Avidity Biosciences[175.17%], Arcutis Bio[170.43%], Cullinan Oncology[169.84%], Vera [164.02%], Hippo [137.76%] Best Smallcap Stocks This Week:
Deciphera [71.95%], Phibro Animal[28.32%], Vaxxinity [20.15%], Heartland Financial[18.56%], Janux [16.28%], Acrivon [16.08%], Velo3D [14.96%], MultiPlan [14.93%], Amprius [14.37%], Codexis [13.72%], ESS Tech[13.67%] Best Smallcap Stocks Daily:
Bakkt [2439.40%], Deciphera [71.95%], Phibro Animal[28.32%], Vaxxinity [20.15%], Heartland Financial[18.56%], Janux [16.28%], Acrivon [16.08%], Velo3D [14.96%], MultiPlan [14.93%], Amprius [14.37%], Codexis [13.72%]