
 Login Sign Up


| |||||
 |  | ||||

| 12Stocks.com Market Intelligence |
Best SmallCap Stocks
|
| In a hurry? Small Cap Stock Lists: Performance Trends Table, Stock Charts
Sort Small Cap stocks: Daily, Weekly, Year-to-Date, Market Cap & Trends. Filter Small Cap stocks list by sector: Show all, Tech, Finance, Energy, Staples, Retail, Industrial, Materials, Utilities and HealthCare Filter Small Cap stocks list by size: All Large Medium Small and MicroCap |
| 12Stocks.com Small Cap Stocks Performances & Trends Daily | |||||||||
|
|  The overall Smart Investing & Trading Score is 69 (0-bearish to 100-bullish) which puts Small Cap index in short term neutral to bullish trend. The Smart Investing & Trading Score from previous trading session is 49 and hence an improvement of trend.
| ||||||||
Here are the Smart Investing & Trading Scores of the most requested small cap stocks at 12Stocks.com (click stock name for detailed review):
|


| 12Stocks.com: Investing in Smallcap Index with Stocks | |
|
The following table helps investors and traders sort through current performance and trends (as measured by Smart Investing & Trading Score) of various
stocks in the Smallcap Index. Quick View: Move mouse or cursor over stock symbol (ticker) to view short-term technical chart and over stock name to view long term chart. Click on  to add stock symbol to your watchlist and to add stock symbol to your watchlist and  to view watchlist. Click on any ticker or stock name for detailed market intelligence report for that stock. to view watchlist. Click on any ticker or stock name for detailed market intelligence report for that stock. |
12Stocks.com Performance of Stocks in Smallcap Index
| Ticker | Stock Name | Watchlist | Category | Recent Price | Smart Investing & Trading Score | Change % | YTD Change% |
| MORF | Morphic Holding |   | Health Care | 29.90 | 74 | 4.14% | 3.53% |
| PRTA | Prothena | | Health Care | 22.93 | 74 | 4.04% | -36.90% |
| LUNA | Luna Innovations | | Technology | 3.06 | 74 | 36.00% | -53.98% |
| EXPI | eXp World | | Financials | 11.62 | 74 | 3.29% | -25.13% |
| CMTG | Claros Mortgage | | Financials | 9.24 | 74 | 3.13% | -33.41% |
| ARDX | Ardelyx | | Health Care | 8.72 | 74 | 28.42% | 40.65% |
| BANC | Banc of California | | Financials | 14.63 | 74 | 2.88% | 8.94% |
| PFIS | Peoples Financial | | Financials | 39.60 | 74 | 2.86% | -18.69% |
| EBTC | Enterprise Bancorp | | Financials | 25.32 | 74 | 2.47% | -21.51% |
| FNKO | Funko | | Consumer Staples | 6.57 | 74 | 2.34% | -15.01% |
| AMBA | Ambarella | | Technology | 47.85 | 74 | 2.05% | -21.93% |
| BFLY | Butterfly | | Health Care | 1.04 | 74 | 17.42% | -7.52% |
| CDXS | Codexis | | Health Care | 3.92 | 74 | 17.37% | 28.52% |
| VIR | Vir | | Health Care | 10.39 | 74 | 13.18% | 3.28% |
| FOSL | Fossil Group | | Consumer Staples | 1.01 | 74 | 11.78% | -30.82% |
| FOXF | Fox Factory | | Consumer Staples | 43.52 | 74 | 10.40% | -35.51% |
| APPS | Digital Turbine | | Technology | 2.06 | 74 | 1.98% | -69.97% |
| DHX | DHI Group | | Services & Goods | 2.66 | 74 | 1.92% | 2.70% |
| MLYS | Mineralys | | Health Care | 13.15 | 74 | 1.78% | 50.86% |
| BLFY | Blue Foundry | | Financials | 9.13 | 74 | 1.67% | -5.19% |
| NFBK | Northfield Bancorp | | Financials | 9.01 | 74 | 1.58% | -28.38% |
| USPH | U.S. Physical | | Health Care | 105.20 | 74 | 1.51% | 12.95% |
| WSBF | Waterstone Financial | | Financials | 12.25 | 74 | 1.49% | -13.73% |
| PCYO | Pure Cycle | | Utilities | 9.91 | 74 | 1.33% | -5.35% |
| IPI | Intrepid Potash | | Materials | 20.78 | 74 | 1.32% | -13.02% |


| Too many stocks? View smallcap stocks filtered by marketcap & sector |
| Marketcap: All SmallCap Stocks (default-no microcap), Large, Mid-Range, Small |
| Smallcap Sector: Tech, Finance, Energy, Staples, Retail, Industrial, Materials, & Medical |
|
Get the most comprehensive stock market coverage daily at 12Stocks.com ➞ Best Stocks Today ➞ Best Stocks Weekly ➞ Best Stocks Year-to-Date ➞ Best Stocks Trends ➞  Best Stocks Today 12Stocks.com Best Nasdaq Stocks ➞ Best S&P 500 Stocks ➞ Best Tech Stocks ➞ Best Biotech Stocks ➞ |
| Detailed Overview of SmallCap Stocks |
| SmallCap Technical Overview, Leaders & Laggards, Top SmallCap ETF Funds & Detailed SmallCap Stocks List, Charts, Trends & More |
| Smallcap: Technical Analysis, Trends & YTD Performance | |
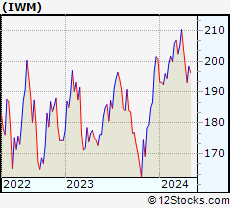
| SmallCap segment as represented by
IWM, an exchange-traded fund [ETF], holds basket of thousands of smallcap stocks from across all major sectors of the US stock market. The smallcap index (contains stocks like Riverbed & Sotheby's) is up by 0.59% and is currently underperforming the overall market by -6.29% year-to-date. Below is a quick view of technical charts and trends: | |
 IWM Weekly Chart |
|
| Long Term Trend: Not Good | |
| Medium Term Trend: Very Good | |
 IWM Daily Chart |
|
| Short Term Trend: Very Good | |
| Overall Trend Score: 69 | |
| YTD Performance: 0.59% | |
| **Trend Scores & Views Are Only For Educational Purposes And Not For Investing | |
| 12Stocks.com: Top Performing Small Cap Index Stocks | ||||||||||||||||||||||||||||||||||||||||||||||||
 The top performing Small Cap Index stocks year to date are
Now, more recently, over last week, the top performing Small Cap Index stocks on the move are


|
||||||||||||||||||||||||||||||||||||||||||||||||
| 12Stocks.com: Investing in Smallcap Index using Exchange Traded Funds | |
|
The following table shows list of key exchange traded funds (ETF) that
help investors track Smallcap index. The following list also includes leveraged ETF funds that track twice or thrice the daily returns of Smallcap indices. Short or inverse ETF funds move in the opposite direction to the index they track and are useful during market pullbacks or during bear markets. Quick View: Move mouse or cursor over ETF symbol (ticker) to view short-term technical chart and over ETF name to view long term chart. Click on ticker or stock name for detailed view. Click on to add stock symbol to your watchlist and to view watchlist. |
12Stocks.com List of ETFs that track Smallcap Index
| Ticker | ETF Name | Watchlist | Recent Price | Smart Investing & Trading Score | Change % | Week % | Year-to-date % |
| IWM | iShares Russell 2000 | | 201.90 | 69 | 0.99 | 1.77 | 0.59% |
| IJR | iShares Core S&P Small-Cap | | 107.13 | 82 | 0.75 | 1.4 | -1.03% |
| VTWO | Vanguard Russell 2000 ETF | | 81.61 | 69 | 0.94 | 1.73 | 0.63% |
| IWN | iShares Russell 2000 Value | | 154.21 | 100 | 0.87 | 2.03 | -0.72% |
| IJS | iShares S&P Small-Cap 600 Value | | 98.72 | 64 | 0.71 | 1.57 | -4.22% |
| IWO | iShares Russell 2000 Growth | | 256.87 | 57 | 0.99 | 1.49 | 1.84% |
| IJT | iShares S&P Small-Cap 600 Growth | | 127.76 | 95 | 0.82 | 1.32 | 2.09% |
| XSLV | PowerShares S&P SmallCap Low Volatil ETF | | 43.22 | 87 | 0.19 | 1.17 | -2.11% |
| SBB | ProShares Short SmallCap600 | | 16.16 | 13 | -1.28 | -1.37 | 1.44% |
| SDD | ProShares UltraShort SmallCap600 | | 18.84 | 23 | -2.41 | -2.61 | 2.27% |
| SAA | ProShares Ultra SmallCap600 | | 23.59 | 69 | 2.86 | 2.39 | -5.45% |
| SMLV | SPDR SSGA US Small Cap Low Volatil ETF | | 109.69 | 87 | 0.78 | 2.01 | -2.52% |
| 12Stocks.com: Charts, Trends, Fundamental Data and Performances of SmallCap Stocks | |
|
We now take in-depth look at all SmallCap stocks including charts, multi-period performances and overall trends (as measured by Smart Investing & Trading Score). One can sort SmallCap stocks (click link to choose) by Daily, Weekly and by Year-to-Date performances. Also, one can sort by size of the company or by market capitalization. |
| Select Your Default Chart Type: | |||||
| |||||
| Click on stock symbol or name for detailed view. Click on to add stock symbol to your watchlist and to view watchlist. Quick View: Move mouse or cursor over "Daily" to quickly view daily technical stock chart and over "Weekly" to view weekly technical stock chart. | |||||

 | MORF Morphic Holding, Inc. |
| Sector: Health Care | |
| SubSector: Biotechnology | |
| MarketCap: 484.885 Millions | |
| Recent Price: 29.90 Smart Investing & Trading Score: 74 | |
| Day Percent Change: 4.14% Day Change: 1.19 | |
| Week Change: 6.52% Year-to-date Change: 3.5% | |
| MORF Links: Profile News Message Board | |
| Charts:- Daily , Weekly | |
| Add MORF to Watchlist: View: Get Complete MORF Trend Analysis ➞ | |
 | PRTA Prothena Corporation plc |
| Sector: Health Care | |
| SubSector: Biotechnology | |
| MarketCap: 357.985 Millions | |
| Recent Price: 22.93 Smart Investing & Trading Score: 74 | |
| Day Percent Change: 4.04% Day Change: 0.89 | |
| Week Change: 9.87% Year-to-date Change: -36.9% | |
| PRTA Links: Profile News Message Board | |
| Charts:- Daily , Weekly | |
| Add PRTA to Watchlist: View: Get Complete PRTA Trend Analysis ➞ | |
 | LUNA Luna Innovations Incorporated |
| Sector: Technology | |
| SubSector: Scientific & Technical Instruments | |
| MarketCap: 166.353 Millions | |
| Recent Price: 3.06 Smart Investing & Trading Score: 74 | |
| Day Percent Change: 36.00% Day Change: 0.81 | |
| Week Change: 53.77% Year-to-date Change: -54.0% | |
| LUNA Links: Profile News Message Board | |
| Charts:- Daily , Weekly | |
| Add LUNA to Watchlist: View: Get Complete LUNA Trend Analysis ➞ | |
 | EXPI eXp World Holdings, Inc. |
| Sector: Financials | |
| SubSector: Property Management | |
| MarketCap: 448.042 Millions | |
| Recent Price: 11.62 Smart Investing & Trading Score: 74 | |
| Day Percent Change: 3.29% Day Change: 0.37 | |
| Week Change: 14.82% Year-to-date Change: -25.1% | |
| EXPI Links: Profile News Message Board | |
| Charts:- Daily , Weekly | |
| Add EXPI to Watchlist: View: Get Complete EXPI Trend Analysis ➞ | |
 | CMTG Claros Mortgage Trust, Inc. |
| Sector: Financials | |
| SubSector: REIT - Mortgage | |
| MarketCap: 1610 Millions | |
| Recent Price: 9.24 Smart Investing & Trading Score: 74 | |
| Day Percent Change: 3.13% Day Change: 0.28 | |
| Week Change: 6.08% Year-to-date Change: -33.4% | |
| CMTG Links: Profile News Message Board | |
| Charts:- Daily , Weekly | |
| Add CMTG to Watchlist: View: Get Complete CMTG Trend Analysis ➞ | |
 | ARDX Ardelyx, Inc. |
| Sector: Health Care | |
| SubSector: Biotechnology | |
| MarketCap: 541.985 Millions | |
| Recent Price: 8.72 Smart Investing & Trading Score: 74 | |
| Day Percent Change: 28.42% Day Change: 1.93 | |
| Week Change: 35.83% Year-to-date Change: 40.7% | |
| ARDX Links: Profile News Message Board | |
| Charts:- Daily , Weekly | |
| Add ARDX to Watchlist: View: Get Complete ARDX Trend Analysis ➞ | |
 | BANC Banc of California, Inc. |
| Sector: Financials | |
| SubSector: Regional - Pacific Banks | |
| MarketCap: 459.929 Millions | |
| Recent Price: 14.63 Smart Investing & Trading Score: 74 | |
| Day Percent Change: 2.88% Day Change: 0.41 | |
| Week Change: 2.16% Year-to-date Change: 8.9% | |
| BANC Links: Profile News Message Board | |
| Charts:- Daily , Weekly | |
| Add BANC to Watchlist: View: Get Complete BANC Trend Analysis ➞ | |
 | PFIS Peoples Financial Services Corp. |
| Sector: Financials | |
| SubSector: Regional - Northeast Banks | |
| MarketCap: 305.499 Millions | |
| Recent Price: 39.60 Smart Investing & Trading Score: 74 | |
| Day Percent Change: 2.86% Day Change: 1.10 | |
| Week Change: 3.45% Year-to-date Change: -18.7% | |
| PFIS Links: Profile News Message Board | |
| Charts:- Daily , Weekly | |
| Add PFIS to Watchlist: View: Get Complete PFIS Trend Analysis ➞ | |
 | EBTC Enterprise Bancorp, Inc. |
| Sector: Financials | |
| SubSector: Savings & Loans | |
| MarketCap: 304.53 Millions | |
| Recent Price: 25.32 Smart Investing & Trading Score: 74 | |
| Day Percent Change: 2.47% Day Change: 0.61 | |
| Week Change: 1.69% Year-to-date Change: -21.5% | |
| EBTC Links: Profile News Message Board | |
| Charts:- Daily , Weekly | |
| Add EBTC to Watchlist: View: Get Complete EBTC Trend Analysis ➞ | |
 | FNKO Funko, Inc. |
| Sector: Consumer Staples | |
| SubSector: Toys & Games | |
| MarketCap: 246.38 Millions | |
| Recent Price: 6.57 Smart Investing & Trading Score: 74 | |
| Day Percent Change: 2.34% Day Change: 0.15 | |
| Week Change: 5.97% Year-to-date Change: -15.0% | |
| FNKO Links: Profile News Message Board | |
| Charts:- Daily , Weekly | |
| Add FNKO to Watchlist: View: Get Complete FNKO Trend Analysis ➞ | |
 | AMBA Ambarella, Inc. |
| Sector: Technology | |
| SubSector: Semiconductor Equipment & Materials | |
| MarketCap: 1509.38 Millions | |
| Recent Price: 47.85 Smart Investing & Trading Score: 74 | |
| Day Percent Change: 2.05% Day Change: 0.96 | |
| Week Change: 11.05% Year-to-date Change: -21.9% | |
| AMBA Links: Profile News Message Board | |
| Charts:- Daily , Weekly | |
| Add AMBA to Watchlist: View: Get Complete AMBA Trend Analysis ➞ | |
 | BFLY Butterfly Network, Inc. |
| Sector: Health Care | |
| SubSector: Medical Devices | |
| MarketCap: 461 Millions | |
| Recent Price: 1.04 Smart Investing & Trading Score: 74 | |
| Day Percent Change: 17.42% Day Change: 0.15 | |
| Week Change: 34.18% Year-to-date Change: -7.5% | |
| BFLY Links: Profile News Message Board | |
| Charts:- Daily , Weekly | |
| Add BFLY to Watchlist: View: Get Complete BFLY Trend Analysis ➞ | |
 | CDXS Codexis, Inc. |
| Sector: Health Care | |
| SubSector: Biotechnology | |
| MarketCap: 592.185 Millions | |
| Recent Price: 3.92 Smart Investing & Trading Score: 74 | |
| Day Percent Change: 17.37% Day Change: 0.58 | |
| Week Change: 47.37% Year-to-date Change: 28.5% | |
| CDXS Links: Profile News Message Board | |
| Charts:- Daily , Weekly | |
| Add CDXS to Watchlist: View: Get Complete CDXS Trend Analysis ➞ | |
 | VIR Vir Biotechnology, Inc. |
| Sector: Health Care | |
| SubSector: Biotechnology | |
| MarketCap: 3916.75 Millions | |
| Recent Price: 10.39 Smart Investing & Trading Score: 74 | |
| Day Percent Change: 13.18% Day Change: 1.21 | |
| Week Change: 26.25% Year-to-date Change: 3.3% | |
| VIR Links: Profile News Message Board | |
| Charts:- Daily , Weekly | |
| Add VIR to Watchlist: View: Get Complete VIR Trend Analysis ➞ | |
 | FOSL Fossil Group, Inc. |
| Sector: Consumer Staples | |
| SubSector: Textile - Apparel Footwear & Accessories | |
| MarketCap: 215.87 Millions | |
| Recent Price: 1.01 Smart Investing & Trading Score: 74 | |
| Day Percent Change: 11.78% Day Change: 0.11 | |
| Week Change: 27.69% Year-to-date Change: -30.8% | |
| FOSL Links: Profile News Message Board | |
| Charts:- Daily , Weekly | |
| Add FOSL to Watchlist: View: Get Complete FOSL Trend Analysis ➞ | |
 | FOXF Fox Factory Holding Corp. |
| Sector: Consumer Staples | |
| SubSector: Recreational Vehicles | |
| MarketCap: 2093.29 Millions | |
| Recent Price: 43.52 Smart Investing & Trading Score: 74 | |
| Day Percent Change: 10.40% Day Change: 4.10 | |
| Week Change: 7.59% Year-to-date Change: -35.5% | |
| FOXF Links: Profile News Message Board | |
| Charts:- Daily , Weekly | |
| Add FOXF to Watchlist: View: Get Complete FOXF Trend Analysis ➞ | |
 | APPS Digital Turbine, Inc. |
| Sector: Technology | |
| SubSector: Application Software | |
| MarketCap: 437.262 Millions | |
| Recent Price: 2.06 Smart Investing & Trading Score: 74 | |
| Day Percent Change: 1.98% Day Change: 0.04 | |
| Week Change: 13.19% Year-to-date Change: -70.0% | |
| APPS Links: Profile News Message Board | |
| Charts:- Daily , Weekly | |
| Add APPS to Watchlist: View: Get Complete APPS Trend Analysis ➞ | |
 | DHX DHI Group, Inc. |
| Sector: Services & Goods | |
| SubSector: Staffing & Outsourcing Services | |
| MarketCap: 144.728 Millions | |
| Recent Price: 2.66 Smart Investing & Trading Score: 74 | |
| Day Percent Change: 1.92% Day Change: 0.05 | |
| Week Change: 4.72% Year-to-date Change: 2.7% | |
| DHX Links: Profile News Message Board | |
| Charts:- Daily , Weekly | |
| Add DHX to Watchlist: View: Get Complete DHX Trend Analysis ➞ | |
 | MLYS Mineralys Therapeutics, Inc. |
| Sector: Health Care | |
| SubSector: Biotechnology | |
| MarketCap: 719 Millions | |
| Recent Price: 13.15 Smart Investing & Trading Score: 74 | |
| Day Percent Change: 1.78% Day Change: 0.23 | |
| Week Change: 10.92% Year-to-date Change: 50.9% | |
| MLYS Links: Profile News Message Board | |
| Charts:- Daily , Weekly | |
| Add MLYS to Watchlist: View: Get Complete MLYS Trend Analysis ➞ | |
 | BLFY Blue Foundry Bancorp |
| Sector: Financials | |
| SubSector: Banks - Regional | |
| MarketCap: 264 Millions | |
| Recent Price: 9.13 Smart Investing & Trading Score: 74 | |
| Day Percent Change: 1.67% Day Change: 0.15 | |
| Week Change: 3.99% Year-to-date Change: -5.2% | |
| BLFY Links: Profile News Message Board | |
| Charts:- Daily , Weekly | |
| Add BLFY to Watchlist: View: Get Complete BLFY Trend Analysis ➞ | |
 | NFBK Northfield Bancorp, Inc. (Staten Island, NY) |
| Sector: Financials | |
| SubSector: Regional - Northeast Banks | |
| MarketCap: 540.699 Millions | |
| Recent Price: 9.01 Smart Investing & Trading Score: 74 | |
| Day Percent Change: 1.58% Day Change: 0.14 | |
| Week Change: 5.75% Year-to-date Change: -28.4% | |
| NFBK Links: Profile News Message Board | |
| Charts:- Daily , Weekly | |
| Add NFBK to Watchlist: View: Get Complete NFBK Trend Analysis ➞ | |
 | USPH U.S. Physical Therapy, Inc. |
| Sector: Health Care | |
| SubSector: Specialized Health Services | |
| MarketCap: 793.556 Millions | |
| Recent Price: 105.20 Smart Investing & Trading Score: 74 | |
| Day Percent Change: 1.51% Day Change: 1.56 | |
| Week Change: 4.56% Year-to-date Change: 13.0% | |
| USPH Links: Profile News Message Board | |
| Charts:- Daily , Weekly | |
| Add USPH to Watchlist: View: Get Complete USPH Trend Analysis ➞ | |
 | WSBF Waterstone Financial, Inc. |
| Sector: Financials | |
| SubSector: Savings & Loans | |
| MarketCap: 371.93 Millions | |
| Recent Price: 12.25 Smart Investing & Trading Score: 74 | |
| Day Percent Change: 1.49% Day Change: 0.18 | |
| Week Change: 3.9% Year-to-date Change: -13.7% | |
| WSBF Links: Profile News Message Board | |
| Charts:- Daily , Weekly | |
| Add WSBF to Watchlist: View: Get Complete WSBF Trend Analysis ➞ | |
 | PCYO Pure Cycle Corporation |
| Sector: Utilities | |
| SubSector: Water Utilities | |
| MarketCap: 247.102 Millions | |
| Recent Price: 9.91 Smart Investing & Trading Score: 74 | |
| Day Percent Change: 1.33% Day Change: 0.13 | |
| Week Change: 4.32% Year-to-date Change: -5.4% | |
| PCYO Links: Profile News Message Board | |
| Charts:- Daily , Weekly | |
| Add PCYO to Watchlist: View: Get Complete PCYO Trend Analysis ➞ | |
 | IPI Intrepid Potash, Inc. |
| Sector: Materials | |
| SubSector: Agricultural Chemicals | |
| MarketCap: 160.329 Millions | |
| Recent Price: 20.78 Smart Investing & Trading Score: 74 | |
| Day Percent Change: 1.32% Day Change: 0.27 | |
| Week Change: 6.4% Year-to-date Change: -13.0% | |
| IPI Links: Profile News Message Board | |
| Charts:- Daily , Weekly | |
| Add IPI to Watchlist: View: Get Complete IPI Trend Analysis ➞ | |
| Too many stocks? View smallcap stocks filtered by marketcap & sector |
| Marketcap: All SmallCap Stocks (default-no microcap), Large, Mid-Range, Small & MicroCap |
| Sector: Tech, Finance, Energy, Staples, Retail, Industrial, Materials, Utilities & Medical |
|
Best Stocks Today 12Stocks.com |
© 2024 12Stocks.com Terms & Conditions Privacy Contact Us
All Information Provided Only For Education And Not To Be Used For Investing or Trading. See Terms & Conditions


One More Thing ... Get Best Stocks Delivered Daily!
Never Ever Miss A Move With Our Top Ten Stocks Lists
Find Best Stocks In Any Market - Bull or Bear Market
Take A Peek At Our Top Ten Stocks Lists: Daily, Weekly, Year-to-Date & Top Trends
Find Best Stocks In Any Market - Bull or Bear Market
Take A Peek At Our Top Ten Stocks Lists: Daily, Weekly, Year-to-Date & Top Trends
Smallcap Stocks With Best Up Trends [0-bearish to 100-bullish]: Twist Bioscience[100], WideOpenWest [100], Joint [100], FTC Solar[100], Origin Materials[100], Alignment Healthcare[100], Clarus [100], IES [100], Emergent BioSolutions[100], Enovix [100], El Pollo[100]
Best Smallcap Stocks Year-to-Date:
Janux [482.74%], Viking [313.59%], Longboard [272.5%], Alpine Immune[239.29%], Bakkt [199.55%], Avidity Biosciences[192.48%], Vera [189.47%], Cullinan Oncology[176.9%], Super Micro[175.35%], Y-mAbs [151.47%], Sana [149.33%] Best Smallcap Stocks This Week:
Emergent BioSolutions[102.6%], Deciphera [73.24%], Origin Materials[66.52%], Eyenovia [60.78%], Cue Biopharma[56.04%], Aspen Aerogels[55.96%], Enovix [54.02%], Luna Innovations[53.77%], Codexis [47.37%], Carvana Co[44.31%], Office Properties[42.79%] Best Smallcap Stocks Daily:
Luna Innovations[36.00%], Twist Bioscience[28.74%], Ardelyx [28.42%], WideOpenWest [28.23%], 2U [26.63%], Joint [25.35%], FTC Solar[25.09%], Origin Materials[22.23%], Alignment Healthcare[21.97%], Clarus [18.67%], Aurora Innovation[18.09%]