
 Login Sign Up


| |||||
 |  | ||||

| 12Stocks.com Market Intelligence |
Best SmallCap Stocks
|
| In a hurry? Small Cap Stock Lists: Performance Trends Table, Stock Charts
Sort Small Cap stocks: Daily, Weekly, Year-to-Date, Market Cap & Trends. Filter Small Cap stocks list by sector: Show all, Tech, Finance, Energy, Staples, Retail, Industrial, Materials, Utilities and HealthCare Filter Small Cap stocks list by size: All Large Medium Small and MicroCap |
| 12Stocks.com Small Cap Stocks Performances & Trends Daily | |||||||||
|
|  The overall Smart Investing & Trading Score is 69 (0-bearish to 100-bullish) which puts Small Cap index in short term neutral to bullish trend. The Smart Investing & Trading Score from previous trading session is 49 and hence an improvement of trend.
| ||||||||
Here are the Smart Investing & Trading Scores of the most requested small cap stocks at 12Stocks.com (click stock name for detailed review):
|


| 12Stocks.com: Investing in Smallcap Index with Stocks | |
|
The following table helps investors and traders sort through current performance and trends (as measured by Smart Investing & Trading Score) of various
stocks in the Smallcap Index. Quick View: Move mouse or cursor over stock symbol (ticker) to view short-term technical chart and over stock name to view long term chart. Click on  to add stock symbol to your watchlist and to add stock symbol to your watchlist and  to view watchlist. Click on any ticker or stock name for detailed market intelligence report for that stock. to view watchlist. Click on any ticker or stock name for detailed market intelligence report for that stock. |
12Stocks.com Performance of Stocks in Smallcap Index
| Ticker | Stock Name | Watchlist | Category | Recent Price | Smart Investing & Trading Score | Change % | YTD Change% |
| NTCT | NetScout Systems |   | Technology | 20.09 | 74 | -0.84% | -8.47% |
| SBGI | Slair Broadcast | | Services & Goods | 13.21 | 74 | -0.68% | 1.38% |
| HRMY | Harmony Biosciences | | Health Care | 31.52 | 74 | -0.54% | -2.38% |
| MOFG | MidWestOne Financial | | Financials | 21.35 | 74 | -0.47% | -20.66% |
| PCRX | Pacira BioSciences | | Health Care | 27.21 | 74 | -0.40% | -19.35% |
| BGS | B&G Foods | | Consumer Staples | 11.39 | 74 | -0.09% | 8.48% |
| GWRS | Global Water | | Utilities | 12.76 | 74 | -0.08% | -2.45% |
| CCBG | Capital City | | Financials | 27.47 | 74 | -0.07% | -6.66% |
| BBSI | Barrett Business | | Services & Goods | 123.38 | 73 | 3.26% | 6.55% |
| TSBK | Timberland Bancorp | | Financials | 26.10 | 73 | 0.35% | -17.04% |
| SOI | Solaris Oilfield | | Energy | 9.01 | 73 | 0.33% | 13.19% |
| ATI | Allegheny | | Industrials | 58.16 | 73 | 0.19% | 27.91% |
| MLP | Maui Land | | Financials | 20.12 | 73 | 0.00% | 26.62% |
| ALDX | Aldeyra | | Health Care | 4.16 | 73 | -1.19% | 18.52% |
| CARG | CarGurus | | Services & Goods | 22.75 | 73 | -0.70% | -5.84% |
| PNRG | PrimeEnergy Resources | | Energy | 103.45 | 73 | -0.34% | -2.73% |
| TMHC | Taylor Morrison | | Industrials | 57.20 | 73 | 1.69% | 7.22% |
| CVCO | Cavco Industries | | Industrials | 377.30 | 73 | 1.42% | 8.85% |
| GPI | Group 1 | | Services & Goods | 295.04 | 73 | 0.86% | -3.18% |
| AEL | American Equity | | Financials | 56.47 | 73 | 0.00% | 1.20% |
| TARO | Taro Pharmaceutical | | Health Care | 42.45 | 73 | -0.14% | 1.60% |
| VCEL | Vericel | | Health Care | 47.83 | 73 | -0.10% | 34.32% |
| RELY | Remitly Global | | Technology | 14.91 | 71 | -3.18% | -23.22% |
| PROK | ProKidney | | Health Care | 2.13 | 71 | -2.06% | 22.35% |
| REX | REX American | | Industrials | 57.13 | 71 | 2.75% | 20.78% |


| Too many stocks? View smallcap stocks filtered by marketcap & sector |
| Marketcap: All SmallCap Stocks (default-no microcap), Large, Mid-Range, Small |
| Smallcap Sector: Tech, Finance, Energy, Staples, Retail, Industrial, Materials, & Medical |
|
Get the most comprehensive stock market coverage daily at 12Stocks.com ➞ Best Stocks Today ➞ Best Stocks Weekly ➞ Best Stocks Year-to-Date ➞ Best Stocks Trends ➞  Best Stocks Today 12Stocks.com Best Nasdaq Stocks ➞ Best S&P 500 Stocks ➞ Best Tech Stocks ➞ Best Biotech Stocks ➞ |
| Detailed Overview of SmallCap Stocks |
| SmallCap Technical Overview, Leaders & Laggards, Top SmallCap ETF Funds & Detailed SmallCap Stocks List, Charts, Trends & More |
| Smallcap: Technical Analysis, Trends & YTD Performance | |
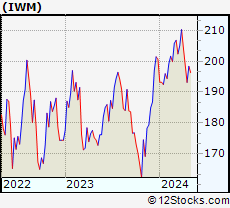
| SmallCap segment as represented by
IWM, an exchange-traded fund [ETF], holds basket of thousands of smallcap stocks from across all major sectors of the US stock market. The smallcap index (contains stocks like Riverbed & Sotheby's) is up by 0.59% and is currently underperforming the overall market by -6.29% year-to-date. Below is a quick view of technical charts and trends: | |
 IWM Weekly Chart |
|
| Long Term Trend: Not Good | |
| Medium Term Trend: Very Good | |
 IWM Daily Chart |
|
| Short Term Trend: Very Good | |
| Overall Trend Score: 69 | |
| YTD Performance: 0.59% | |
| **Trend Scores & Views Are Only For Educational Purposes And Not For Investing | |
| 12Stocks.com: Top Performing Small Cap Index Stocks | ||||||||||||||||||||||||||||||||||||||||||||||||
 The top performing Small Cap Index stocks year to date are
Now, more recently, over last week, the top performing Small Cap Index stocks on the move are


|
||||||||||||||||||||||||||||||||||||||||||||||||
| 12Stocks.com: Investing in Smallcap Index using Exchange Traded Funds | |
|
The following table shows list of key exchange traded funds (ETF) that
help investors track Smallcap index. The following list also includes leveraged ETF funds that track twice or thrice the daily returns of Smallcap indices. Short or inverse ETF funds move in the opposite direction to the index they track and are useful during market pullbacks or during bear markets. Quick View: Move mouse or cursor over ETF symbol (ticker) to view short-term technical chart and over ETF name to view long term chart. Click on ticker or stock name for detailed view. Click on to add stock symbol to your watchlist and to view watchlist. |
12Stocks.com List of ETFs that track Smallcap Index
| Ticker | ETF Name | Watchlist | Recent Price | Smart Investing & Trading Score | Change % | Week % | Year-to-date % |
| IWM | iShares Russell 2000 | | 201.90 | 69 | 0.99 | 1.77 | 0.59% |
| IJR | iShares Core S&P Small-Cap | | 107.13 | 82 | 0.75 | 1.4 | -1.03% |
| VTWO | Vanguard Russell 2000 ETF | | 81.61 | 69 | 0.94 | 1.73 | 0.63% |
| IWN | iShares Russell 2000 Value | | 154.21 | 100 | 0.87 | 2.03 | -0.72% |
| IJS | iShares S&P Small-Cap 600 Value | | 98.72 | 64 | 0.71 | 1.57 | -4.22% |
| IWO | iShares Russell 2000 Growth | | 256.87 | 57 | 0.99 | 1.49 | 1.84% |
| IJT | iShares S&P Small-Cap 600 Growth | | 127.76 | 95 | 0.82 | 1.32 | 2.09% |
| XSLV | PowerShares S&P SmallCap Low Volatil ETF | | 43.22 | 87 | 0.19 | 1.17 | -2.11% |
| SBB | ProShares Short SmallCap600 | | 16.16 | 13 | -1.28 | -1.37 | 1.44% |
| SDD | ProShares UltraShort SmallCap600 | | 18.84 | 23 | -2.41 | -2.61 | 2.27% |
| SAA | ProShares Ultra SmallCap600 | | 23.59 | 69 | 2.86 | 2.39 | -5.45% |
| SMLV | SPDR SSGA US Small Cap Low Volatil ETF | | 109.69 | 87 | 0.78 | 2.01 | -2.52% |
| 12Stocks.com: Charts, Trends, Fundamental Data and Performances of SmallCap Stocks | |
|
We now take in-depth look at all SmallCap stocks including charts, multi-period performances and overall trends (as measured by Smart Investing & Trading Score). One can sort SmallCap stocks (click link to choose) by Daily, Weekly and by Year-to-Date performances. Also, one can sort by size of the company or by market capitalization. |
| Select Your Default Chart Type: | |||||
| |||||
| Click on stock symbol or name for detailed view. Click on to add stock symbol to your watchlist and to view watchlist. Quick View: Move mouse or cursor over "Daily" to quickly view daily technical stock chart and over "Weekly" to view weekly technical stock chart. | |||||

 | NTCT NetScout Systems, Inc. |
| Sector: Technology | |
| SubSector: Business Software & Services | |
| MarketCap: 1657.28 Millions | |
| Recent Price: 20.09 Smart Investing & Trading Score: 74 | |
| Day Percent Change: -0.84% Day Change: -0.17 | |
| Week Change: 0.95% Year-to-date Change: -8.5% | |
| NTCT Links: Profile News Message Board | |
| Charts:- Daily , Weekly | |
| Add NTCT to Watchlist: View: Get Complete NTCT Trend Analysis ➞ | |
 | SBGI Sinclair Broadcast Group, Inc. |
| Sector: Services & Goods | |
| SubSector: Broadcasting - TV | |
| MarketCap: 1461.73 Millions | |
| Recent Price: 13.21 Smart Investing & Trading Score: 74 | |
| Day Percent Change: -0.68% Day Change: -0.09 | |
| Week Change: 8.99% Year-to-date Change: 1.4% | |
| SBGI Links: Profile News Message Board | |
| Charts:- Daily , Weekly | |
| Add SBGI to Watchlist: View: Get Complete SBGI Trend Analysis ➞ | |
 | HRMY Harmony Biosciences Holdings, Inc. |
| Sector: Health Care | |
| SubSector: Biotechnology | |
| MarketCap: 24487 Millions | |
| Recent Price: 31.52 Smart Investing & Trading Score: 74 | |
| Day Percent Change: -0.54% Day Change: -0.17 | |
| Week Change: 7.5% Year-to-date Change: -2.4% | |
| HRMY Links: Profile News Message Board | |
| Charts:- Daily , Weekly | |
| Add HRMY to Watchlist: View: Get Complete HRMY Trend Analysis ➞ | |
 | MOFG MidWestOne Financial Group, Inc. |
| Sector: Financials | |
| SubSector: Regional - Southwest Banks | |
| MarketCap: 345.265 Millions | |
| Recent Price: 21.35 Smart Investing & Trading Score: 74 | |
| Day Percent Change: -0.47% Day Change: -0.10 | |
| Week Change: 4.61% Year-to-date Change: -20.7% | |
| MOFG Links: Profile News Message Board | |
| Charts:- Daily , Weekly | |
| Add MOFG to Watchlist: View: Get Complete MOFG Trend Analysis ➞ | |
 | PCRX Pacira BioSciences, Inc. |
| Sector: Health Care | |
| SubSector: Drugs - Generic | |
| MarketCap: 1403.95 Millions | |
| Recent Price: 27.21 Smart Investing & Trading Score: 74 | |
| Day Percent Change: -0.40% Day Change: -0.11 | |
| Week Change: 3.34% Year-to-date Change: -19.4% | |
| PCRX Links: Profile News Message Board | |
| Charts:- Daily , Weekly | |
| Add PCRX to Watchlist: View: Get Complete PCRX Trend Analysis ➞ | |
 | BGS B&G Foods, Inc. |
| Sector: Consumer Staples | |
| SubSector: Processed & Packaged Goods | |
| MarketCap: 1456.08 Millions | |
| Recent Price: 11.39 Smart Investing & Trading Score: 74 | |
| Day Percent Change: -0.09% Day Change: -0.01 | |
| Week Change: 2.98% Year-to-date Change: 8.5% | |
| BGS Links: Profile News Message Board | |
| Charts:- Daily , Weekly | |
| Add BGS to Watchlist: View: Get Complete BGS Trend Analysis ➞ | |
 | GWRS Global Water Resources, Inc. |
| Sector: Utilities | |
| SubSector: Water Utilities | |
| MarketCap: 253.502 Millions | |
| Recent Price: 12.76 Smart Investing & Trading Score: 74 | |
| Day Percent Change: -0.08% Day Change: -0.01 | |
| Week Change: 4.68% Year-to-date Change: -2.5% | |
| GWRS Links: Profile News Message Board | |
| Charts:- Daily , Weekly | |
| Add GWRS to Watchlist: View: Get Complete GWRS Trend Analysis ➞ | |
 | CCBG Capital City Bank Group, Inc. |
| Sector: Financials | |
| SubSector: Regional - Mid-Atlantic Banks | |
| MarketCap: 314.459 Millions | |
| Recent Price: 27.47 Smart Investing & Trading Score: 74 | |
| Day Percent Change: -0.07% Day Change: -0.02 | |
| Week Change: 1.67% Year-to-date Change: -6.7% | |
| CCBG Links: Profile News Message Board | |
| Charts:- Daily , Weekly | |
| Add CCBG to Watchlist: View: Get Complete CCBG Trend Analysis ➞ | |
 | BBSI Barrett Business Services, Inc. |
| Sector: Services & Goods | |
| SubSector: Staffing & Outsourcing Services | |
| MarketCap: 262.028 Millions | |
| Recent Price: 123.38 Smart Investing & Trading Score: 73 | |
| Day Percent Change: 3.26% Day Change: 3.89 | |
| Week Change: 1.32% Year-to-date Change: 6.6% | |
| BBSI Links: Profile News Message Board | |
| Charts:- Daily , Weekly | |
| Add BBSI to Watchlist: View: Get Complete BBSI Trend Analysis ➞ | |
 | TSBK Timberland Bancorp, Inc. |
| Sector: Financials | |
| SubSector: Savings & Loans | |
| MarketCap: 155.03 Millions | |
| Recent Price: 26.10 Smart Investing & Trading Score: 73 | |
| Day Percent Change: 0.35% Day Change: 0.09 | |
| Week Change: 3.37% Year-to-date Change: -17.0% | |
| TSBK Links: Profile News Message Board | |
| Charts:- Daily , Weekly | |
| Add TSBK to Watchlist: View: Get Complete TSBK Trend Analysis ➞ | |
 | SOI Solaris Oilfield Infrastructure, Inc. |
| Sector: Energy | |
| SubSector: Oil & Gas Equipment & Services | |
| MarketCap: 267.361 Millions | |
| Recent Price: 9.01 Smart Investing & Trading Score: 73 | |
| Day Percent Change: 0.33% Day Change: 0.03 | |
| Week Change: -6.54% Year-to-date Change: 13.2% | |
| SOI Links: Profile News Message Board | |
| Charts:- Daily , Weekly | |
| Add SOI to Watchlist: View: Get Complete SOI Trend Analysis ➞ | |
 | ATI Allegheny Technologies Incorporated |
| Sector: Industrials | |
| SubSector: Metal Fabrication | |
| MarketCap: 913.35 Millions | |
| Recent Price: 58.16 Smart Investing & Trading Score: 73 | |
| Day Percent Change: 0.19% Day Change: 0.11 | |
| Week Change: 12.39% Year-to-date Change: 27.9% | |
| ATI Links: Profile News Message Board | |
| Charts:- Daily , Weekly | |
| Add ATI to Watchlist: View: Get Complete ATI Trend Analysis ➞ | |
 | MLP Maui Land & Pineapple Company, Inc. |
| Sector: Financials | |
| SubSector: Real Estate Development | |
| MarketCap: 186.619 Millions | |
| Recent Price: 20.12 Smart Investing & Trading Score: 73 | |
| Day Percent Change: 0.00% Day Change: 0.00 | |
| Week Change: 1.56% Year-to-date Change: 26.6% | |
| MLP Links: Profile News Message Board | |
| Charts:- Daily , Weekly | |
| Add MLP to Watchlist: View: Get Complete MLP Trend Analysis ➞ | |
 | ALDX Aldeyra Therapeutics, Inc. |
| Sector: Health Care | |
| SubSector: Biotechnology | |
| MarketCap: 61.2785 Millions | |
| Recent Price: 4.16 Smart Investing & Trading Score: 73 | |
| Day Percent Change: -1.19% Day Change: -0.05 | |
| Week Change: 5.85% Year-to-date Change: 18.5% | |
| ALDX Links: Profile News Message Board | |
| Charts:- Daily , Weekly | |
| Add ALDX to Watchlist: View: Get Complete ALDX Trend Analysis ➞ | |
 | CARG CarGurus, Inc. |
| Sector: Services & Goods | |
| SubSector: Auto Dealerships | |
| MarketCap: 2099.31 Millions | |
| Recent Price: 22.75 Smart Investing & Trading Score: 73 | |
| Day Percent Change: -0.70% Day Change: -0.16 | |
| Week Change: -2.02% Year-to-date Change: -5.8% | |
| CARG Links: Profile News Message Board | |
| Charts:- Daily , Weekly | |
| Add CARG to Watchlist: View: Get Complete CARG Trend Analysis ➞ | |
 | PNRG PrimeEnergy Resources Corporation |
| Sector: Energy | |
| SubSector: Independent Oil & Gas | |
| MarketCap: 112.593 Millions | |
| Recent Price: 103.45 Smart Investing & Trading Score: 73 | |
| Day Percent Change: -0.34% Day Change: -0.35 | |
| Week Change: 1.45% Year-to-date Change: -2.7% | |
| PNRG Links: Profile News Message Board | |
| Charts:- Daily , Weekly | |
| Add PNRG to Watchlist: View: Get Complete PNRG Trend Analysis ➞ | |
 | TMHC Taylor Morrison Home Corporation |
| Sector: Industrials | |
| SubSector: Residential Construction | |
| MarketCap: 1336.76 Millions | |
| Recent Price: 57.20 Smart Investing & Trading Score: 73 | |
| Day Percent Change: 1.69% Day Change: 0.95 | |
| Week Change: -0.63% Year-to-date Change: 7.2% | |
| TMHC Links: Profile News Message Board | |
| Charts:- Daily , Weekly | |
| Add TMHC to Watchlist: View: Get Complete TMHC Trend Analysis ➞ | |
 | CVCO Cavco Industries, Inc. |
| Sector: Industrials | |
| SubSector: Residential Construction | |
| MarketCap: 1375.86 Millions | |
| Recent Price: 377.30 Smart Investing & Trading Score: 73 | |
| Day Percent Change: 1.42% Day Change: 5.28 | |
| Week Change: 1.26% Year-to-date Change: 8.9% | |
| CVCO Links: Profile News Message Board | |
| Charts:- Daily , Weekly | |
| Add CVCO to Watchlist: View: Get Complete CVCO Trend Analysis ➞ | |
 | GPI Group 1 Automotive, Inc. |
| Sector: Services & Goods | |
| SubSector: Auto Dealerships | |
| MarketCap: 921.021 Millions | |
| Recent Price: 295.04 Smart Investing & Trading Score: 73 | |
| Day Percent Change: 0.86% Day Change: 2.51 | |
| Week Change: -1.77% Year-to-date Change: -3.2% | |
| GPI Links: Profile News Message Board | |
| Charts:- Daily , Weekly | |
| Add GPI to Watchlist: View: Get Complete GPI Trend Analysis ➞ | |
 | AEL American Equity Investment Life Holding Company |
| Sector: Financials | |
| SubSector: Life Insurance | |
| MarketCap: 1304.46 Millions | |
| Recent Price: 56.47 Smart Investing & Trading Score: 73 | |
| Day Percent Change: 0.00% Day Change: 0.00 | |
| Week Change: 0.28% Year-to-date Change: 1.2% | |
| AEL Links: Profile News Message Board | |
| Charts:- Daily , Weekly | |
| Add AEL to Watchlist: View: Get Complete AEL Trend Analysis ➞ | |
 | TARO Taro Pharmaceutical Industries Ltd. |
| Sector: Health Care | |
| SubSector: Drug Manufacturers - Other | |
| MarketCap: 2379.33 Millions | |
| Recent Price: 42.45 Smart Investing & Trading Score: 73 | |
| Day Percent Change: -0.14% Day Change: -0.06 | |
| Week Change: 0.12% Year-to-date Change: 1.6% | |
| TARO Links: Profile News Message Board | |
| Charts:- Daily , Weekly | |
| Add TARO to Watchlist: View: Get Complete TARO Trend Analysis ➞ | |
 | VCEL Vericel Corporation |
| Sector: Health Care | |
| SubSector: Biotechnology | |
| MarketCap: 391.885 Millions | |
| Recent Price: 47.83 Smart Investing & Trading Score: 73 | |
| Day Percent Change: -0.10% Day Change: -0.05 | |
| Week Change: 3.87% Year-to-date Change: 34.3% | |
| VCEL Links: Profile News Message Board | |
| Charts:- Daily , Weekly | |
| Add VCEL to Watchlist: View: Get Complete VCEL Trend Analysis ➞ | |
 | RELY Remitly Global, Inc. |
| Sector: Technology | |
| SubSector: Software - Infrastructure | |
| MarketCap: 3320 Millions | |
| Recent Price: 14.91 Smart Investing & Trading Score: 71 | |
| Day Percent Change: -3.18% Day Change: -0.49 | |
| Week Change: -17.44% Year-to-date Change: -23.2% | |
| RELY Links: Profile News Message Board | |
| Charts:- Daily , Weekly | |
| Add RELY to Watchlist: View: Get Complete RELY Trend Analysis ➞ | |
 | PROK ProKidney Corp. |
| Sector: Health Care | |
| SubSector: Biotechnology | |
| MarketCap: 2470 Millions | |
| Recent Price: 2.13 Smart Investing & Trading Score: 71 | |
| Day Percent Change: -2.06% Day Change: -0.05 | |
| Week Change: 0.95% Year-to-date Change: 22.4% | |
| PROK Links: Profile News Message Board | |
| Charts:- Daily , Weekly | |
| Add PROK to Watchlist: View: Get Complete PROK Trend Analysis ➞ | |
 | REX REX American Resources Corporation |
| Sector: Industrials | |
| SubSector: Conglomerates | |
| MarketCap: 373.748 Millions | |
| Recent Price: 57.13 Smart Investing & Trading Score: 71 | |
| Day Percent Change: 2.75% Day Change: 1.53 | |
| Week Change: 0.16% Year-to-date Change: 20.8% | |
| REX Links: Profile News Message Board | |
| Charts:- Daily , Weekly | |
| Add REX to Watchlist: View: Get Complete REX Trend Analysis ➞ | |
| Too many stocks? View smallcap stocks filtered by marketcap & sector |
| Marketcap: All SmallCap Stocks (default-no microcap), Large, Mid-Range, Small & MicroCap |
| Sector: Tech, Finance, Energy, Staples, Retail, Industrial, Materials, Utilities & Medical |
|
Best Stocks Today 12Stocks.com |
© 2024 12Stocks.com Terms & Conditions Privacy Contact Us
All Information Provided Only For Education And Not To Be Used For Investing or Trading. See Terms & Conditions


One More Thing ... Get Best Stocks Delivered Daily!
Never Ever Miss A Move With Our Top Ten Stocks Lists
Find Best Stocks In Any Market - Bull or Bear Market
Take A Peek At Our Top Ten Stocks Lists: Daily, Weekly, Year-to-Date & Top Trends
Find Best Stocks In Any Market - Bull or Bear Market
Take A Peek At Our Top Ten Stocks Lists: Daily, Weekly, Year-to-Date & Top Trends
Smallcap Stocks With Best Up Trends [0-bearish to 100-bullish]: Twist Bioscience[100], WideOpenWest [100], Joint [100], FTC Solar[100], Origin Materials[100], Alignment Healthcare[100], Clarus [100], IES [100], Emergent BioSolutions[100], Enovix [100], El Pollo[100]
Best Smallcap Stocks Year-to-Date:
Janux [482.74%], Viking [313.59%], Longboard [272.5%], Alpine Immune[239.29%], Bakkt [199.55%], Avidity Biosciences[192.48%], Vera [189.47%], Cullinan Oncology[176.9%], Super Micro[175.35%], Y-mAbs [151.47%], Sana [149.33%] Best Smallcap Stocks This Week:
Emergent BioSolutions[102.6%], Deciphera [73.24%], Origin Materials[66.52%], Eyenovia [60.78%], Cue Biopharma[56.04%], Aspen Aerogels[55.96%], Enovix [54.02%], Luna Innovations[53.77%], Codexis [47.37%], Carvana Co[44.31%], Office Properties[42.79%] Best Smallcap Stocks Daily:
Luna Innovations[36.00%], Twist Bioscience[28.74%], Ardelyx [28.42%], WideOpenWest [28.23%], 2U [26.63%], Joint [25.35%], FTC Solar[25.09%], Origin Materials[22.23%], Alignment Healthcare[21.97%], Clarus [18.67%], Aurora Innovation[18.09%]