
 Login Sign Up


| |||||
 |  | ||||

| 12Stocks.com Market Intelligence |
Best SmallCap Stocks
|
| In a hurry? Small Cap Stock Lists: Performance Trends Table, Stock Charts
Sort Small Cap stocks: Daily, Weekly, Year-to-Date, Market Cap & Trends. Filter Small Cap stocks list by sector: Show all, Tech, Finance, Energy, Staples, Retail, Industrial, Materials, Utilities and HealthCare Filter Small Cap stocks list by size: All Large Medium Small and MicroCap |
| 12Stocks.com Small Cap Stocks Performances & Trends Daily | |||||||||
|
|  The overall Smart Investing & Trading Score is 70 (0-bearish to 100-bullish) which puts Small Cap index in short term neutral to bullish trend. The Smart Investing & Trading Score from previous trading session is 87 and hence a deterioration of trend.
| ||||||||
Here are the Smart Investing & Trading Scores of the most requested small cap stocks at 12Stocks.com (click stock name for detailed review):
|


| 12Stocks.com: Investing in Smallcap Index with Stocks | |
|
The following table helps investors and traders sort through current performance and trends (as measured by Smart Investing & Trading Score) of various
stocks in the Smallcap Index. Quick View: Move mouse or cursor over stock symbol (ticker) to view short-term technical chart and over stock name to view long term chart. Click on  to add stock symbol to your watchlist and to add stock symbol to your watchlist and  to view watchlist. Click on any ticker or stock name for detailed market intelligence report for that stock. to view watchlist. Click on any ticker or stock name for detailed market intelligence report for that stock. |
12Stocks.com Performance of Stocks in Smallcap Index
| Ticker | Stock Name | Watchlist | Category | Recent Price | Smart Investing & Trading Score | Change % | YTD Change% |
| CBT | Cabot |   | Materials | 101.07 | 100 | 0.00% | 21.04% |
| DSGN | Design | | Health Care | 4.69 | 100 | 0.00% | 76.65% |
| SMMT | Summit | | Health Care | 4.96 | 100 | -6.69% | 89.85% |
| COKE | Coca-Cola Consolidated | | Consumer Staples | 944.81 | 100 | -6.39% | 1.77% |
| EVER | EverQuote | | Financials | 23.82 | 100 | -5.81% | 94.61% |
| TPIC | TPI Composites | | Industrials | 3.84 | 100 | -4.71% | -7.25% |
| PRA | ProAssurance | | Financials | 14.72 | 100 | -2.90% | 6.74% |
| IDT | IDT | | Technology | 37.80 | 100 | -2.88% | 10.88% |
| VNDA | Vanda | | Health Care | 5.36 | 100 | -2.28% | 26.90% |
| NWPX | Northwest Pipe | | Materials | 35.61 | 100 | -1.66% | 17.68% |
| DJCO | Daily Journal | | Services & Goods | 373.55 | 100 | -1.66% | 9.60% |
| SPXC | SPX | | Industrials | 133.92 | 100 | -1.65% | 32.58% |
| MNKD | MannKind | | Health Care | 4.41 | 100 | -1.34% | 21.15% |
| CHEF | Chefs | | Consumer Staples | 38.26 | 100 | -1.23% | 29.99% |
| LMAT | LeMaitre Vascular | | Health Care | 74.97 | 100 | -1.22% | 32.09% |
| STHO | Star | | Financials | 12.98 | 100 | -1.07% | -13.44% |
| SLP | Simulations Plus | | Technology | 48.03 | 100 | -1.05% | 7.33% |
| ATSG | Air Transport | | Transports | 14.57 | 100 | -0.95% | -17.26% |
| EPAC | Enerpac Tool | | Industrials | 37.53 | 100 | -0.87% | 20.71% |
| SB | Safe Bulkers | | Transports | 5.43 | 100 | -0.55% | 38.17% |
| PMVP | PMV | | Health Care | 2.17 | 100 | -0.46% | -30.00% |
| VLGEA | Village Super | | Services & Goods | 29.33 | 100 | -0.41% | 11.82% |
| OEC | Orion Engineered | | Materials | 24.48 | 100 | -0.29% | -11.72% |
| TGTX | TG | | Health Care | 17.14 | 100 | -0.26% | 0.32% |
| MPX | Marine Products | | Consumer Staples | 12.09 | 100 | -0.25% | 6.05% |


| Too many stocks? View smallcap stocks filtered by marketcap & sector |
| Marketcap: All SmallCap Stocks (default-no microcap), Large, Mid-Range, Small |
| Smallcap Sector: Tech, Finance, Energy, Staples, Retail, Industrial, Materials, & Medical |
|
Get the most comprehensive stock market coverage daily at 12Stocks.com ➞ Best Stocks Today ➞ Best Stocks Weekly ➞ Best Stocks Year-to-Date ➞ Best Stocks Trends ➞  Best Stocks Today 12Stocks.com Best Nasdaq Stocks ➞ Best S&P 500 Stocks ➞ Best Tech Stocks ➞ Best Biotech Stocks ➞ |
| Detailed Overview of SmallCap Stocks |
| SmallCap Technical Overview, Leaders & Laggards, Top SmallCap ETF Funds & Detailed SmallCap Stocks List, Charts, Trends & More |
| Smallcap: Technical Analysis, Trends & YTD Performance | |
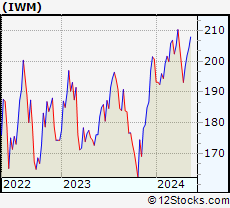
| SmallCap segment as represented by
IWM, an exchange-traded fund [ETF], holds basket of thousands of smallcap stocks from across all major sectors of the US stock market. The smallcap index (contains stocks like Riverbed & Sotheby's) is up by 1.53% and is currently underperforming the overall market by -6.51% year-to-date. Below is a quick view of technical charts and trends: | |
 IWM Weekly Chart |
|
| Long Term Trend: Deteriorating | |
| Medium Term Trend: Very Good | |
 IWM Daily Chart |
|
| Short Term Trend: Good | |
| Overall Trend Score: 70 | |
| YTD Performance: 1.53% | |
| **Trend Scores & Views Are Only For Educational Purposes And Not For Investing | |
| 12Stocks.com: Top Performing Small Cap Index Stocks | ||||||||||||||||||||||||||||||||||||||||||||||||
 The top performing Small Cap Index stocks year to date are
Now, more recently, over last week, the top performing Small Cap Index stocks on the move are


|
||||||||||||||||||||||||||||||||||||||||||||||||
| 12Stocks.com: Investing in Smallcap Index using Exchange Traded Funds | |
|
The following table shows list of key exchange traded funds (ETF) that
help investors track Smallcap index. The following list also includes leveraged ETF funds that track twice or thrice the daily returns of Smallcap indices. Short or inverse ETF funds move in the opposite direction to the index they track and are useful during market pullbacks or during bear markets. Quick View: Move mouse or cursor over ETF symbol (ticker) to view short-term technical chart and over ETF name to view long term chart. Click on ticker or stock name for detailed view. Click on to add stock symbol to your watchlist and to view watchlist. |
12Stocks.com List of ETFs that track Smallcap Index
| Ticker | ETF Name | Watchlist | Recent Price | Smart Investing & Trading Score | Change % | Week % | Year-to-date % |
| IWM | iShares Russell 2000 | | 203.78 | 70 | -0.58 | 0.93 | 1.53% |
| IJR | iShares Core S&P Small-Cap | | 108.26 | 58 | -0.33 | 1.05 | 0.01% |
| IWN | iShares Russell 2000 Value | | 155.37 | 76 | -0.17 | 0.75 | 0.03% |
| VTWO | Vanguard Russell 2000 ETF | | 82.40 | 57 | -0.53 | 0.97 | 1.6% |
| IWO | iShares Russell 2000 Growth | | 260.10 | 57 | -0.84 | 1.26 | 3.12% |
| IJS | iShares S&P Small-Cap 600 Value | | 99.80 | 40 | 0.12 | 1.09 | -3.17% |
| IJT | iShares S&P Small-Cap 600 Growth | | 129.03 | 71 | -0.62 | 0.99 | 3.11% |
| XSLV | PowerShares S&P SmallCap Low Volatil ETF | | 43.94 | 95 | -0.14 | 1.67 | -0.48% |
| SMLV | SPDR SSGA US Small Cap Low Volatil ETF | | 110.32 | 63 | -0.15 | 0.57 | -1.96% |
| SDD | ProShares UltraShort SmallCap600 | | 18.66 | 40 | 2.43 | -0.98 | 1.27% |
| SBB | ProShares Short SmallCap600 | | 16.08 | 25 | 0.69 | -0.5 | 0.94% |
| SAA | ProShares Ultra SmallCap600 | | 24.21 | 70 | -0.75 | 2.62 | -2.98% |
| 12Stocks.com: Charts, Trends, Fundamental Data and Performances of SmallCap Stocks | |
|
We now take in-depth look at all SmallCap stocks including charts, multi-period performances and overall trends (as measured by Smart Investing & Trading Score). One can sort SmallCap stocks (click link to choose) by Daily, Weekly and by Year-to-Date performances. Also, one can sort by size of the company or by market capitalization. |
| Select Your Default Chart Type: | |||||
| |||||
| Click on stock symbol or name for detailed view. Click on to add stock symbol to your watchlist and to view watchlist. Quick View: Move mouse or cursor over "Daily" to quickly view daily technical stock chart and over "Weekly" to view weekly technical stock chart. | |||||

 | CBT Cabot Corporation |
| Sector: Materials | |
| SubSector: Specialty Chemicals | |
| MarketCap: 1261.47 Millions | |
| Recent Price: 101.07 Smart Investing & Trading Score: 100 | |
| Day Percent Change: 0.00% Day Change: 0.00 | |
| Week Change: 7.4% Year-to-date Change: 21.0% | |
| CBT Links: Profile News Message Board | |
| Charts:- Daily , Weekly | |
| Add CBT to Watchlist: View: Get Complete CBT Trend Analysis ➞ | |
 | DSGN Design Therapeutics, Inc. |
| Sector: Health Care | |
| SubSector: Biotechnology | |
| MarketCap: 367 Millions | |
| Recent Price: 4.69 Smart Investing & Trading Score: 100 | |
| Day Percent Change: 0.00% Day Change: 0.00 | |
| Week Change: 23.42% Year-to-date Change: 76.7% | |
| DSGN Links: Profile News Message Board | |
| Charts:- Daily , Weekly | |
| Add DSGN to Watchlist: View: Get Complete DSGN Trend Analysis ➞ | |
 | SMMT Summit Therapeutics plc |
| Sector: Health Care | |
| SubSector: Biotechnology | |
| MarketCap: 156.985 Millions | |
| Recent Price: 4.96 Smart Investing & Trading Score: 100 | |
| Day Percent Change: -6.69% Day Change: -0.35 | |
| Week Change: 12.87% Year-to-date Change: 89.9% | |
| SMMT Links: Profile News Message Board | |
| Charts:- Daily , Weekly | |
| Add SMMT to Watchlist: View: Get Complete SMMT Trend Analysis ➞ | |
 | COKE Coca-Cola Consolidated, Inc. |
| Sector: Consumer Staples | |
| SubSector: Beverages - Soft Drinks | |
| MarketCap: 1392.2 Millions | |
| Recent Price: 944.81 Smart Investing & Trading Score: 100 | |
| Day Percent Change: -6.39% Day Change: -64.50 | |
| Week Change: 10.71% Year-to-date Change: 1.8% | |
| COKE Links: Profile News Message Board | |
| Charts:- Daily , Weekly | |
| Add COKE to Watchlist: View: Get Complete COKE Trend Analysis ➞ | |
 | EVER EverQuote, Inc. |
| Sector: Financials | |
| SubSector: Regional - Southeast Banks | |
| MarketCap: 767.135 Millions | |
| Recent Price: 23.82 Smart Investing & Trading Score: 100 | |
| Day Percent Change: -5.81% Day Change: -1.47 | |
| Week Change: 9.52% Year-to-date Change: 94.6% | |
| EVER Links: Profile News Message Board | |
| Charts:- Daily , Weekly | |
| Add EVER to Watchlist: View: Get Complete EVER Trend Analysis ➞ | |
 | TPIC TPI Composites, Inc. |
| Sector: Industrials | |
| SubSector: Diversified Machinery | |
| MarketCap: 451.016 Millions | |
| Recent Price: 3.84 Smart Investing & Trading Score: 100 | |
| Day Percent Change: -4.71% Day Change: -0.19 | |
| Week Change: 2.67% Year-to-date Change: -7.3% | |
| TPIC Links: Profile News Message Board | |
| Charts:- Daily , Weekly | |
| Add TPIC to Watchlist: View: Get Complete TPIC Trend Analysis ➞ | |
 | PRA ProAssurance Corporation |
| Sector: Financials | |
| SubSector: Accident & Health Insurance | |
| MarketCap: 1434.6 Millions | |
| Recent Price: 14.72 Smart Investing & Trading Score: 100 | |
| Day Percent Change: -2.90% Day Change: -0.44 | |
| Week Change: 6.44% Year-to-date Change: 6.7% | |
| PRA Links: Profile News Message Board | |
| Charts:- Daily , Weekly | |
| Add PRA to Watchlist: View: Get Complete PRA Trend Analysis ➞ | |
 | IDT IDT Corporation |
| Sector: Technology | |
| SubSector: Diversified Communication Services | |
| MarketCap: 130.064 Millions | |
| Recent Price: 37.80 Smart Investing & Trading Score: 100 | |
| Day Percent Change: -2.88% Day Change: -1.12 | |
| Week Change: -0.87% Year-to-date Change: 10.9% | |
| IDT Links: Profile News Message Board | |
| Charts:- Daily , Weekly | |
| Add IDT to Watchlist: View: Get Complete IDT Trend Analysis ➞ | |
 | VNDA Vanda Pharmaceuticals Inc. |
| Sector: Health Care | |
| SubSector: Biotechnology | |
| MarketCap: 464.585 Millions | |
| Recent Price: 5.36 Smart Investing & Trading Score: 100 | |
| Day Percent Change: -2.28% Day Change: -0.13 | |
| Week Change: 9.73% Year-to-date Change: 26.9% | |
| VNDA Links: Profile News Message Board | |
| Charts:- Daily , Weekly | |
| Add VNDA to Watchlist: View: Get Complete VNDA Trend Analysis ➞ | |
 | NWPX Northwest Pipe Company |
| Sector: Materials | |
| SubSector: Steel & Iron | |
| MarketCap: 245.788 Millions | |
| Recent Price: 35.61 Smart Investing & Trading Score: 100 | |
| Day Percent Change: -1.66% Day Change: -0.60 | |
| Week Change: 8.83% Year-to-date Change: 17.7% | |
| NWPX Links: Profile News Message Board | |
| Charts:- Daily , Weekly | |
| Add NWPX to Watchlist: View: Get Complete NWPX Trend Analysis ➞ | |
 | DJCO Daily Journal Corporation |
| Sector: Services & Goods | |
| SubSector: Publishing - Newspapers | |
| MarketCap: 306.822 Millions | |
| Recent Price: 373.55 Smart Investing & Trading Score: 100 | |
| Day Percent Change: -1.66% Day Change: -6.31 | |
| Week Change: 1.23% Year-to-date Change: 9.6% | |
| DJCO Links: Profile News Message Board | |
| Charts:- Daily , Weekly | |
| Add DJCO to Watchlist: View: Get Complete DJCO Trend Analysis ➞ | |
 | SPXC SPX Corporation |
| Sector: Industrials | |
| SubSector: Diversified Machinery | |
| MarketCap: 1415.56 Millions | |
| Recent Price: 133.92 Smart Investing & Trading Score: 100 | |
| Day Percent Change: -1.65% Day Change: -2.24 | |
| Week Change: 2.28% Year-to-date Change: 32.6% | |
| SPXC Links: Profile News Message Board | |
| Charts:- Daily , Weekly | |
| Add SPXC to Watchlist: View: Get Complete SPXC Trend Analysis ➞ | |
 | MNKD MannKind Corporation |
| Sector: Health Care | |
| SubSector: Biotechnology | |
| MarketCap: 250.885 Millions | |
| Recent Price: 4.41 Smart Investing & Trading Score: 100 | |
| Day Percent Change: -1.34% Day Change: -0.06 | |
| Week Change: 0.46% Year-to-date Change: 21.2% | |
| MNKD Links: Profile News Message Board | |
| Charts:- Daily , Weekly | |
| Add MNKD to Watchlist: View: Get Complete MNKD Trend Analysis ➞ | |
 | CHEF The Chefs Warehouse, Inc. |
| Sector: Consumer Staples | |
| SubSector: Food Wholesale | |
| MarketCap: 207.529 Millions | |
| Recent Price: 38.26 Smart Investing & Trading Score: 100 | |
| Day Percent Change: -1.23% Day Change: -0.47 | |
| Week Change: 1.26% Year-to-date Change: 30.0% | |
| CHEF Links: Profile News Message Board | |
| Charts:- Daily , Weekly | |
| Add CHEF to Watchlist: View: Get Complete CHEF Trend Analysis ➞ | |
 | LMAT LeMaitre Vascular, Inc. |
| Sector: Health Care | |
| SubSector: Medical Instruments & Supplies | |
| MarketCap: 522.16 Millions | |
| Recent Price: 74.97 Smart Investing & Trading Score: 100 | |
| Day Percent Change: -1.22% Day Change: -0.93 | |
| Week Change: 1.02% Year-to-date Change: 32.1% | |
| LMAT Links: Profile News Message Board | |
| Charts:- Daily , Weekly | |
| Add LMAT to Watchlist: View: Get Complete LMAT Trend Analysis ➞ | |
 | STHO Star Holdings |
| Sector: Financials | |
| SubSector: Financials Services | |
| MarketCap: 195 Millions | |
| Recent Price: 12.98 Smart Investing & Trading Score: 100 | |
| Day Percent Change: -1.07% Day Change: -0.14 | |
| Week Change: 4.76% Year-to-date Change: -13.4% | |
| STHO Links: Profile News Message Board | |
| Charts:- Daily , Weekly | |
| Add STHO to Watchlist: View: Get Complete STHO Trend Analysis ➞ | |
 | SLP Simulations Plus, Inc. |
| Sector: Technology | |
| SubSector: Business Software & Services | |
| MarketCap: 564.258 Millions | |
| Recent Price: 48.03 Smart Investing & Trading Score: 100 | |
| Day Percent Change: -1.05% Day Change: -0.51 | |
| Week Change: 2.85% Year-to-date Change: 7.3% | |
| SLP Links: Profile News Message Board | |
| Charts:- Daily , Weekly | |
| Add SLP to Watchlist: View: Get Complete SLP Trend Analysis ➞ | |
 | ATSG Air Transport Services Group, Inc. |
| Sector: Transports | |
| SubSector: Air Delivery & Freight Services | |
| MarketCap: 1111.68 Millions | |
| Recent Price: 14.57 Smart Investing & Trading Score: 100 | |
| Day Percent Change: -0.95% Day Change: -0.14 | |
| Week Change: 11.39% Year-to-date Change: -17.3% | |
| ATSG Links: Profile News Message Board | |
| Charts:- Daily , Weekly | |
| Add ATSG to Watchlist: View: Get Complete ATSG Trend Analysis ➞ | |
 | EPAC Enerpac Tool Group Corp. |
| Sector: Industrials | |
| SubSector: Diversified Machinery | |
| MarketCap: 1044.16 Millions | |
| Recent Price: 37.53 Smart Investing & Trading Score: 100 | |
| Day Percent Change: -0.87% Day Change: -0.33 | |
| Week Change: 1.9% Year-to-date Change: 20.7% | |
| EPAC Links: Profile News Message Board | |
| Charts:- Daily , Weekly | |
| Add EPAC to Watchlist: View: Get Complete EPAC Trend Analysis ➞ | |
 | SB Safe Bulkers, Inc. |
| Sector: Transports | |
| SubSector: Shipping | |
| MarketCap: 108.114 Millions | |
| Recent Price: 5.43 Smart Investing & Trading Score: 100 | |
| Day Percent Change: -0.55% Day Change: -0.03 | |
| Week Change: 4.62% Year-to-date Change: 38.2% | |
| SB Links: Profile News Message Board | |
| Charts:- Daily , Weekly | |
| Add SB to Watchlist: View: Get Complete SB Trend Analysis ➞ | |
 | PMVP PMV Pharmaceuticals, Inc. |
| Sector: Health Care | |
| SubSector: Biotechnology | |
| MarketCap: 20187 Millions | |
| Recent Price: 2.17 Smart Investing & Trading Score: 100 | |
| Day Percent Change: -0.46% Day Change: -0.01 | |
| Week Change: 9.87% Year-to-date Change: -30.0% | |
| PMVP Links: Profile News Message Board | |
| Charts:- Daily , Weekly | |
| Add PMVP to Watchlist: View: Get Complete PMVP Trend Analysis ➞ | |
 | VLGEA Village Super Market, Inc. |
| Sector: Services & Goods | |
| SubSector: Grocery Stores | |
| MarketCap: 222.375 Millions | |
| Recent Price: 29.33 Smart Investing & Trading Score: 100 | |
| Day Percent Change: -0.41% Day Change: -0.12 | |
| Week Change: 2.02% Year-to-date Change: 11.8% | |
| VLGEA Links: Profile News Message Board | |
| Charts:- Daily , Weekly | |
| Add VLGEA to Watchlist: View: Get Complete VLGEA Trend Analysis ➞ | |
 | OEC Orion Engineered Carbons S.A. |
| Sector: Materials | |
| SubSector: Specialty Chemicals | |
| MarketCap: 493.457 Millions | |
| Recent Price: 24.48 Smart Investing & Trading Score: 100 | |
| Day Percent Change: -0.29% Day Change: -0.07 | |
| Week Change: 3.73% Year-to-date Change: -11.7% | |
| OEC Links: Profile News Message Board | |
| Charts:- Daily , Weekly | |
| Add OEC to Watchlist: View: Get Complete OEC Trend Analysis ➞ | |
 | TGTX TG Therapeutics, Inc. |
| Sector: Health Care | |
| SubSector: Biotechnology | |
| MarketCap: 1022.85 Millions | |
| Recent Price: 17.14 Smart Investing & Trading Score: 100 | |
| Day Percent Change: -0.26% Day Change: -0.04 | |
| Week Change: 5.84% Year-to-date Change: 0.3% | |
| TGTX Links: Profile News Message Board | |
| Charts:- Daily , Weekly | |
| Add TGTX to Watchlist: View: Get Complete TGTX Trend Analysis ➞ | |
 | MPX Marine Products Corporation |
| Sector: Consumer Staples | |
| SubSector: Recreational Vehicles | |
| MarketCap: 316.059 Millions | |
| Recent Price: 12.09 Smart Investing & Trading Score: 100 | |
| Day Percent Change: -0.25% Day Change: -0.03 | |
| Week Change: 5.5% Year-to-date Change: 6.1% | |
| MPX Links: Profile News Message Board | |
| Charts:- Daily , Weekly | |
| Add MPX to Watchlist: View: Get Complete MPX Trend Analysis ➞ | |
| Too many stocks? View smallcap stocks filtered by marketcap & sector |
| Marketcap: All SmallCap Stocks (default-no microcap), Large, Mid-Range, Small & MicroCap |
| Sector: Tech, Finance, Energy, Staples, Retail, Industrial, Materials, Utilities & Medical |
|
Best Stocks Today 12Stocks.com |
© 2024 12Stocks.com Terms & Conditions Privacy Contact Us
All Information Provided Only For Education And Not To Be Used For Investing or Trading. See Terms & Conditions


One More Thing ... Get Best Stocks Delivered Daily!
Never Ever Miss A Move With Our Top Ten Stocks Lists
Find Best Stocks In Any Market - Bull or Bear Market
Take A Peek At Our Top Ten Stocks Lists: Daily, Weekly, Year-to-Date & Top Trends
Find Best Stocks In Any Market - Bull or Bear Market
Take A Peek At Our Top Ten Stocks Lists: Daily, Weekly, Year-to-Date & Top Trends
Smallcap Stocks With Best Up Trends [0-bearish to 100-bullish]: Cricut [100], DASAN Zhone[100], Latham Group[100], Hyster-Yale Materials[100], Myriad Genetics[100], Alpha and[100], Vigil Neuroscience[100], Hannon Armstrong[100], Ardmore Shipping[100], Inogen [100], Payoneer Global[100]
Best Smallcap Stocks Year-to-Date:
CareMax [580.41%], Janux [415.82%], Viking [329.77%], Bakkt [295.29%], Longboard [255.4%], Alpine Immune[239.73%], Vera [190.25%], Super Micro[189.4%], Avidity Biosciences[188.27%], Cullinan Oncology[172%], Arcutis Bio[147.06%] Best Smallcap Stocks This Week:
DASAN Zhone[64.32%], Innodata [55.88%], Perficient [52.92%], Cricut [42.32%], Vigil Neuroscience[39.52%], Thoughtworks Holding[36.89%], Latham Group[35.9%], Great Lakes[32.18%], Bakkt [31.96%], Outset Medical[31.95%], P3 Health[27.95%] Best Smallcap Stocks Daily:
Innodata [55.42%], Cricut [47.47%], DASAN Zhone[30.11%], Latham Group[24.08%], Hyster-Yale Materials[23.55%], iRobot [21.40%], Myriad Genetics[21.13%], Ameresco [21.13%], Bakkt [20.92%], Alpha and[20.78%], Vigil Neuroscience[18.97%]