
 Login Sign Up


| |||||
 |  | ||||

| 12Stocks.com Market Intelligence |
Best SmallCap Stocks
|
| In a hurry? Small Cap Stock Lists: Performance Trends Table, Stock Charts
Sort Small Cap stocks: Daily, Weekly, Year-to-Date, Market Cap & Trends. Filter Small Cap stocks list by sector: Show all, Tech, Finance, Energy, Staples, Retail, Industrial, Materials, Utilities and HealthCare Filter Small Cap stocks list by size: All Large Medium Small and MicroCap |
| 12Stocks.com Small Cap Stocks Performances & Trends Daily | |||||||||
|
|  The overall Smart Investing & Trading Score is 39 (0-bearish to 100-bullish) which puts Small Cap index in short term bearish to neutral trend. The Smart Investing & Trading Score from previous trading session is 41 and hence a deterioration of trend.
| ||||||||
Here are the Smart Investing & Trading Scores of the most requested small cap stocks at 12Stocks.com (click stock name for detailed review):
|


| 12Stocks.com: Investing in Smallcap Index with Stocks | |
|
The following table helps investors and traders sort through current performance and trends (as measured by Smart Investing & Trading Score) of various
stocks in the Smallcap Index. Quick View: Move mouse or cursor over stock symbol (ticker) to view short-term technical chart and over stock name to view long term chart. Click on  to add stock symbol to your watchlist and to add stock symbol to your watchlist and  to view watchlist. Click on any ticker or stock name for detailed market intelligence report for that stock. to view watchlist. Click on any ticker or stock name for detailed market intelligence report for that stock. |
12Stocks.com Performance of Stocks in Smallcap Index
| Ticker | Stock Name | Watchlist | Category | Recent Price | Smart Investing & Trading Score | Change % | YTD Change% |
| WTI | W&T Offshore |   | Energy | 2.23 | 10 | -0.89% | -31.60% |
| MRC | MRC Global | | Energy | 11.13 | 10 | -0.89% | 1.09% |
| CWH | Camping World | | Financials | 20.10 | 10 | -0.84% | -23.46% |
| IIIN | Insteel Industries | | Materials | 31.86 | 10 | -0.75% | -16.79% |
| VVI | Viad Corp | | Services & Goods | 34.26 | 10 | -0.64% | -5.36% |
| VERV | Verve | | Health Care | 5.98 | 10 | -0.58% | -57.15% |
| FLYW | Flywire | | Technology | 20.39 | 10 | -0.54% | -12.97% |
| NX | Quanex Building | | Industrials | 33.09 | 10 | -0.39% | 8.24% |
| NEWT | Newtek Business | | Services & Goods | 10.75 | 10 | -0.37% | -22.10% |
| SONO | Sonos | | Technology | 16.85 | 10 | -0.30% | -1.69% |
| JBT | John Bean | | Industrials | 88.84 | 10 | -0.28% | -10.67% |
| ALG | Alamo Group | | Industrials | 193.93 | 10 | -0.23% | -7.74% |
| APAM | Artisan Partners | | Financials | 40.84 | 10 | -0.22% | -7.56% |
| CNNE | Cannae | | Financials | 19.41 | 10 | -0.21% | -0.51% |
| CALM | Cal-Maine Foods | | Consumer Staples | 55.22 | 10 | -0.20% | -3.78% |
| BBUC | Brookfield Business | | Financials | 20.34 | 10 | -0.05% | -12.29% |
| ALTR | Altair Engineering | | Technology | 81.42 | 8 | 1.21% | -3.24% |
| KMT | Kennametal | | Industrials | 23.70 | 8 | 0.72% | -8.10% |
| MCS | Marcus | | Services & Goods | 13.11 | 8 | 0.54% | -10.08% |
| FLWS | 1-800-FLOWERS.COM | | Services & Goods | 9.06 | 8 | -0.11% | -15.96% |
| INFU | InfuSystem | | Health Care | 7.90 | 7 | 5.19% | -25.05% |
| RMNI | Rimini Street | | Technology | 2.77 | 7 | 4.14% | -15.29% |
| ALEC | Alector | | Health Care | 5.28 | 7 | 3.94% | -33.83% |
| BBAI | BigBear.ai | | Technology | 1.72 | 7 | 3.61% | -19.25% |
| PLPC | Preformed Line | | Industrials | 124.60 | 7 | 2.95% | -6.92% |


| Too many stocks? View smallcap stocks filtered by marketcap & sector |
| Marketcap: All SmallCap Stocks (default-no microcap), Large, Mid-Range, Small |
| Smallcap Sector: Tech, Finance, Energy, Staples, Retail, Industrial, Materials, & Medical |
|
Get the most comprehensive stock market coverage daily at 12Stocks.com ➞ Best Stocks Today ➞ Best Stocks Weekly ➞ Best Stocks Year-to-Date ➞ Best Stocks Trends ➞  Best Stocks Today 12Stocks.com Best Nasdaq Stocks ➞ Best S&P 500 Stocks ➞ Best Tech Stocks ➞ Best Biotech Stocks ➞ |
| Detailed Overview of SmallCap Stocks |
| SmallCap Technical Overview, Leaders & Laggards, Top SmallCap ETF Funds & Detailed SmallCap Stocks List, Charts, Trends & More |
| Smallcap: Technical Analysis, Trends & YTD Performance | |
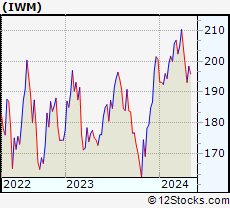
| SmallCap segment as represented by
IWM, an exchange-traded fund [ETF], holds basket of thousands of smallcap stocks from across all major sectors of the US stock market. The smallcap index (contains stocks like Riverbed & Sotheby's) is down by -2.19% and is currently underperforming the overall market by -6.73% year-to-date. Below is a quick view of technical charts and trends: | |
 IWM Weekly Chart |
|
| Long Term Trend: Not Good | |
| Medium Term Trend: Good | |
 IWM Daily Chart |
|
| Short Term Trend: Very Good | |
| Overall Trend Score: 39 | |
| YTD Performance: -2.19% | |
| **Trend Scores & Views Are Only For Educational Purposes And Not For Investing | |
| 12Stocks.com: Top Performing Small Cap Index Stocks | ||||||||||||||||||||||||||||||||||||||||||||||||
 The top performing Small Cap Index stocks year to date are
Now, more recently, over last week, the top performing Small Cap Index stocks on the move are


|
||||||||||||||||||||||||||||||||||||||||||||||||
| 12Stocks.com: Investing in Smallcap Index using Exchange Traded Funds | |
|
The following table shows list of key exchange traded funds (ETF) that
help investors track Smallcap index. The following list also includes leveraged ETF funds that track twice or thrice the daily returns of Smallcap indices. Short or inverse ETF funds move in the opposite direction to the index they track and are useful during market pullbacks or during bear markets. Quick View: Move mouse or cursor over ETF symbol (ticker) to view short-term technical chart and over ETF name to view long term chart. Click on ticker or stock name for detailed view. Click on to add stock symbol to your watchlist and to view watchlist. |
12Stocks.com List of ETFs that track Smallcap Index
| Ticker | ETF Name | Watchlist | Recent Price | Smart Investing & Trading Score | Change % | Week % | Year-to-date % |
| IWM | iShares Russell 2000 | | 196.31 | 39 | 0.21 | -1.05 | -2.19% |
| IJR | iShares Core S&P Small-Cap | | 104.75 | 22 | 0.34 | -0.85 | -3.23% |
| VTWO | Vanguard Russell 2000 ETF | | 79.37 | 14 | 0.27 | -1.06 | -2.13% |
| IWN | iShares Russell 2000 Value | | 149.91 | 22 | 0.58 | -0.81 | -3.49% |
| IJS | iShares S&P Small-Cap 600 Value | | 96.40 | 15 | 0.33 | -0.81 | -6.47% |
| IWO | iShares Russell 2000 Growth | | 249.70 | 7 | -0.25 | -1.34 | -1% |
| IJT | iShares S&P Small-Cap 600 Growth | | 124.90 | 15 | 0.24 | -0.94 | -0.19% |
| XSLV | PowerShares S&P SmallCap Low Volatil ETF | | 42.89 | 45 | 0.82 | 0.4 | -2.85% |
| SDD | ProShares UltraShort SmallCap600 | | 19.55 | 37 | -0.10 | 1.03 | 6.1% |
| SMLV | SPDR SSGA US Small Cap Low Volatil ETF | | 107.07 | 22 | 0.76 | -0.42 | -4.84% |
| SBB | ProShares Short SmallCap600 | | 16.50 | 27 | -0.30 | 0.7 | 3.58% |
| SAA | ProShares Ultra SmallCap600 | | 22.53 | 13 | -0.31 | -2.21 | -9.7% |
| 12Stocks.com: Charts, Trends, Fundamental Data and Performances of SmallCap Stocks | |
|
We now take in-depth look at all SmallCap stocks including charts, multi-period performances and overall trends (as measured by Smart Investing & Trading Score). One can sort SmallCap stocks (click link to choose) by Daily, Weekly and by Year-to-Date performances. Also, one can sort by size of the company or by market capitalization. |
| Select Your Default Chart Type: | |||||
| |||||
| Click on stock symbol or name for detailed view. Click on to add stock symbol to your watchlist and to view watchlist. Quick View: Move mouse or cursor over "Daily" to quickly view daily technical stock chart and over "Weekly" to view weekly technical stock chart. | |||||

 | WTI W&T Offshore, Inc. |
| Sector: Energy | |
| SubSector: Oil & Gas Drilling & Exploration | |
| MarketCap: 244.539 Millions | |
| Recent Price: 2.23 Smart Investing & Trading Score: 10 | |
| Day Percent Change: -0.89% Day Change: -0.02 | |
| Week Change: -5.11% Year-to-date Change: -31.6% | |
| WTI Links: Profile News Message Board | |
| Charts:- Daily , Weekly | |
| Add WTI to Watchlist: View: Get Complete WTI Trend Analysis ➞ | |
 | MRC MRC Global Inc. |
| Sector: Energy | |
| SubSector: Oil & Gas Equipment & Services | |
| MarketCap: 364.061 Millions | |
| Recent Price: 11.13 Smart Investing & Trading Score: 10 | |
| Day Percent Change: -0.89% Day Change: -0.10 | |
| Week Change: -4.05% Year-to-date Change: 1.1% | |
| MRC Links: Profile News Message Board | |
| Charts:- Daily , Weekly | |
| Add MRC to Watchlist: View: Get Complete MRC Trend Analysis ➞ | |
 | CWH Camping World Holdings, Inc. |
| Sector: Financials | |
| SubSector: REIT - Office | |
| MarketCap: 473.566 Millions | |
| Recent Price: 20.10 Smart Investing & Trading Score: 10 | |
| Day Percent Change: -0.84% Day Change: -0.17 | |
| Week Change: -6.29% Year-to-date Change: -23.5% | |
| CWH Links: Profile News Message Board | |
| Charts:- Daily , Weekly | |
| Add CWH to Watchlist: View: Get Complete CWH Trend Analysis ➞ | |
 | IIIN Insteel Industries, Inc. |
| Sector: Materials | |
| SubSector: Steel & Iron | |
| MarketCap: 269.488 Millions | |
| Recent Price: 31.86 Smart Investing & Trading Score: 10 | |
| Day Percent Change: -0.75% Day Change: -0.24 | |
| Week Change: -1.64% Year-to-date Change: -16.8% | |
| IIIN Links: Profile News Message Board | |
| Charts:- Daily , Weekly | |
| Add IIIN to Watchlist: View: Get Complete IIIN Trend Analysis ➞ | |
 | VVI Viad Corp |
| Sector: Services & Goods | |
| SubSector: Business Services | |
| MarketCap: 270.682 Millions | |
| Recent Price: 34.26 Smart Investing & Trading Score: 10 | |
| Day Percent Change: -0.64% Day Change: -0.22 | |
| Week Change: -2.48% Year-to-date Change: -5.4% | |
| VVI Links: Profile News Message Board | |
| Charts:- Daily , Weekly | |
| Add VVI to Watchlist: View: Get Complete VVI Trend Analysis ➞ | |
 | VERV Verve Therapeutics, Inc. |
| Sector: Health Care | |
| SubSector: Biotechnology | |
| MarketCap: 1200 Millions | |
| Recent Price: 5.98 Smart Investing & Trading Score: 10 | |
| Day Percent Change: -0.58% Day Change: -0.03 | |
| Week Change: -2.61% Year-to-date Change: -57.2% | |
| VERV Links: Profile News Message Board | |
| Charts:- Daily , Weekly | |
| Add VERV to Watchlist: View: Get Complete VERV Trend Analysis ➞ | |
 | FLYW Flywire Corporation |
| Sector: Technology | |
| SubSector: Software - Infrastructure | |
| MarketCap: 3390 Millions | |
| Recent Price: 20.39 Smart Investing & Trading Score: 10 | |
| Day Percent Change: -0.54% Day Change: -0.11 | |
| Week Change: -1.92% Year-to-date Change: -13.0% | |
| FLYW Links: Profile News Message Board | |
| Charts:- Daily , Weekly | |
| Add FLYW to Watchlist: View: Get Complete FLYW Trend Analysis ➞ | |
 | NX Quanex Building Products Corporation |
| Sector: Industrials | |
| SubSector: General Building Materials | |
| MarketCap: 315.453 Millions | |
| Recent Price: 33.09 Smart Investing & Trading Score: 10 | |
| Day Percent Change: -0.39% Day Change: -0.13 | |
| Week Change: -2.13% Year-to-date Change: 8.2% | |
| NX Links: Profile News Message Board | |
| Charts:- Daily , Weekly | |
| Add NX to Watchlist: View: Get Complete NX Trend Analysis ➞ | |
 | NEWT Newtek Business Services Corp. |
| Sector: Services & Goods | |
| SubSector: Business Services | |
| MarketCap: 243.982 Millions | |
| Recent Price: 10.75 Smart Investing & Trading Score: 10 | |
| Day Percent Change: -0.37% Day Change: -0.04 | |
| Week Change: -2.27% Year-to-date Change: -22.1% | |
| NEWT Links: Profile News Message Board | |
| Charts:- Daily , Weekly | |
| Add NEWT to Watchlist: View: Get Complete NEWT Trend Analysis ➞ | |
 | SONO Sonos, Inc. |
| Sector: Technology | |
| SubSector: Diversified Electronics | |
| MarketCap: 1047.96 Millions | |
| Recent Price: 16.85 Smart Investing & Trading Score: 10 | |
| Day Percent Change: -0.30% Day Change: -0.05 | |
| Week Change: -0.71% Year-to-date Change: -1.7% | |
| SONO Links: Profile News Message Board | |
| Charts:- Daily , Weekly | |
| Add SONO to Watchlist: View: Get Complete SONO Trend Analysis ➞ | |
 | JBT John Bean Technologies Corporation |
| Sector: Industrials | |
| SubSector: Diversified Machinery | |
| MarketCap: 2197.36 Millions | |
| Recent Price: 88.84 Smart Investing & Trading Score: 10 | |
| Day Percent Change: -0.28% Day Change: -0.25 | |
| Week Change: -2.16% Year-to-date Change: -10.7% | |
| JBT Links: Profile News Message Board | |
| Charts:- Daily , Weekly | |
| Add JBT to Watchlist: View: Get Complete JBT Trend Analysis ➞ | |
 | ALG Alamo Group Inc. |
| Sector: Industrials | |
| SubSector: Farm & Construction Machinery | |
| MarketCap: 964.107 Millions | |
| Recent Price: 193.93 Smart Investing & Trading Score: 10 | |
| Day Percent Change: -0.23% Day Change: -0.45 | |
| Week Change: -2.31% Year-to-date Change: -7.7% | |
| ALG Links: Profile News Message Board | |
| Charts:- Daily , Weekly | |
| Add ALG to Watchlist: View: Get Complete ALG Trend Analysis ➞ | |
 | APAM Artisan Partners Asset Management Inc. |
| Sector: Financials | |
| SubSector: Asset Management | |
| MarketCap: 1688.33 Millions | |
| Recent Price: 40.84 Smart Investing & Trading Score: 10 | |
| Day Percent Change: -0.22% Day Change: -0.09 | |
| Week Change: -2.67% Year-to-date Change: -7.6% | |
| APAM Links: Profile News Message Board | |
| Charts:- Daily , Weekly | |
| Add APAM to Watchlist: View: Get Complete APAM Trend Analysis ➞ | |
 | CNNE Cannae Holdings, Inc. |
| Sector: Financials | |
| SubSector: Asset Management | |
| MarketCap: 2625.53 Millions | |
| Recent Price: 19.41 Smart Investing & Trading Score: 10 | |
| Day Percent Change: -0.21% Day Change: -0.04 | |
| Week Change: -2.9% Year-to-date Change: -0.5% | |
| CNNE Links: Profile News Message Board | |
| Charts:- Daily , Weekly | |
| Add CNNE to Watchlist: View: Get Complete CNNE Trend Analysis ➞ | |
 | CALM Cal-Maine Foods, Inc. |
| Sector: Consumer Staples | |
| SubSector: Food - Major Diversified | |
| MarketCap: 2177.13 Millions | |
| Recent Price: 55.22 Smart Investing & Trading Score: 10 | |
| Day Percent Change: -0.20% Day Change: -0.11 | |
| Week Change: -2.9% Year-to-date Change: -3.8% | |
| CALM Links: Profile News Message Board | |
| Charts:- Daily , Weekly | |
| Add CALM to Watchlist: View: Get Complete CALM Trend Analysis ➞ | |
 | BBUC Brookfield Business Corporation |
| Sector: Financials | |
| SubSector: Asset Management | |
| MarketCap: 1810 Millions | |
| Recent Price: 20.34 Smart Investing & Trading Score: 10 | |
| Day Percent Change: -0.05% Day Change: -0.01 | |
| Week Change: -1.88% Year-to-date Change: -12.3% | |
| BBUC Links: Profile News Message Board | |
| Charts:- Daily , Weekly | |
| Add BBUC to Watchlist: View: Get Complete BBUC Trend Analysis ➞ | |
 | ALTR Altair Engineering Inc. |
| Sector: Technology | |
| SubSector: Semiconductor - Specialized | |
| MarketCap: 2072.2 Millions | |
| Recent Price: 81.42 Smart Investing & Trading Score: 8 | |
| Day Percent Change: 1.21% Day Change: 0.97 | |
| Week Change: -2.58% Year-to-date Change: -3.2% | |
| ALTR Links: Profile News Message Board | |
| Charts:- Daily , Weekly | |
| Add ALTR to Watchlist: View: Get Complete ALTR Trend Analysis ➞ | |
 | KMT Kennametal Inc. |
| Sector: Industrials | |
| SubSector: Machine Tools & Accessories | |
| MarketCap: 1486.48 Millions | |
| Recent Price: 23.70 Smart Investing & Trading Score: 8 | |
| Day Percent Change: 0.72% Day Change: 0.17 | |
| Week Change: -1.41% Year-to-date Change: -8.1% | |
| KMT Links: Profile News Message Board | |
| Charts:- Daily , Weekly | |
| Add KMT to Watchlist: View: Get Complete KMT Trend Analysis ➞ | |
 | MCS The Marcus Corporation |
| Sector: Services & Goods | |
| SubSector: Entertainment - Diversified | |
| MarketCap: 441.437 Millions | |
| Recent Price: 13.11 Smart Investing & Trading Score: 8 | |
| Day Percent Change: 0.54% Day Change: 0.07 | |
| Week Change: -1.8% Year-to-date Change: -10.1% | |
| MCS Links: Profile News Message Board | |
| Charts:- Daily , Weekly | |
| Add MCS to Watchlist: View: Get Complete MCS Trend Analysis ➞ | |
 | FLWS 1-800-FLOWERS.COM, Inc. |
| Sector: Services & Goods | |
| SubSector: Specialty Retail, Other | |
| MarketCap: 940 Millions | |
| Recent Price: 9.06 Smart Investing & Trading Score: 8 | |
| Day Percent Change: -0.11% Day Change: -0.01 | |
| Week Change: -2.37% Year-to-date Change: -16.0% | |
| FLWS Links: Profile News Message Board | |
| Charts:- Daily , Weekly | |
| Add FLWS to Watchlist: View: Get Complete FLWS Trend Analysis ➞ | |
 | INFU InfuSystem Holdings Inc. |
| Sector: Health Care | |
| SubSector: Medical Instruments & Supplies | |
| MarketCap: 136.76 Millions | |
| Recent Price: 7.90 Smart Investing & Trading Score: 7 | |
| Day Percent Change: 5.19% Day Change: 0.39 | |
| Week Change: -2.71% Year-to-date Change: -25.1% | |
| INFU Links: Profile News Message Board | |
| Charts:- Daily , Weekly | |
| Add INFU to Watchlist: View: Get Complete INFU Trend Analysis ➞ | |
 | RMNI Rimini Street, Inc. |
| Sector: Technology | |
| SubSector: Application Software | |
| MarketCap: 288.762 Millions | |
| Recent Price: 2.77 Smart Investing & Trading Score: 7 | |
| Day Percent Change: 4.14% Day Change: 0.11 | |
| Week Change: -1.07% Year-to-date Change: -15.3% | |
| RMNI Links: Profile News Message Board | |
| Charts:- Daily , Weekly | |
| Add RMNI to Watchlist: View: Get Complete RMNI Trend Analysis ➞ | |
 | ALEC Alector, Inc. |
| Sector: Health Care | |
| SubSector: Biotechnology | |
| MarketCap: 2719.35 Millions | |
| Recent Price: 5.28 Smart Investing & Trading Score: 7 | |
| Day Percent Change: 3.94% Day Change: 0.20 | |
| Week Change: 0.57% Year-to-date Change: -33.8% | |
| ALEC Links: Profile News Message Board | |
| Charts:- Daily , Weekly | |
| Add ALEC to Watchlist: View: Get Complete ALEC Trend Analysis ➞ | |
 | BBAI BigBear.ai Holdings, Inc. |
| Sector: Technology | |
| SubSector: Information Technology Services | |
| MarketCap: 339 Millions | |
| Recent Price: 1.72 Smart Investing & Trading Score: 7 | |
| Day Percent Change: 3.61% Day Change: 0.06 | |
| Week Change: -4.44% Year-to-date Change: -19.3% | |
| BBAI Links: Profile News Message Board | |
| Charts:- Daily , Weekly | |
| Add BBAI to Watchlist: View: Get Complete BBAI Trend Analysis ➞ | |
 | PLPC Preformed Line Products Company |
| Sector: Industrials | |
| SubSector: Industrial Electrical Equipment | |
| MarketCap: 221.779 Millions | |
| Recent Price: 124.60 Smart Investing & Trading Score: 7 | |
| Day Percent Change: 2.95% Day Change: 3.57 | |
| Week Change: -0.09% Year-to-date Change: -6.9% | |
| PLPC Links: Profile News Message Board | |
| Charts:- Daily , Weekly | |
| Add PLPC to Watchlist: View: Get Complete PLPC Trend Analysis ➞ | |
| Too many stocks? View smallcap stocks filtered by marketcap & sector |
| Marketcap: All SmallCap Stocks (default-no microcap), Large, Mid-Range, Small & MicroCap |
| Sector: Tech, Finance, Energy, Staples, Retail, Industrial, Materials, Utilities & Medical |
|
Best Stocks Today 12Stocks.com |
© 2024 12Stocks.com Terms & Conditions Privacy Contact Us
All Information Provided Only For Education And Not To Be Used For Investing or Trading. See Terms & Conditions


One More Thing ... Get Best Stocks Delivered Daily!
Never Ever Miss A Move With Our Top Ten Stocks Lists
Find Best Stocks In Any Market - Bull or Bear Market
Take A Peek At Our Top Ten Stocks Lists: Daily, Weekly, Year-to-Date & Top Trends
Find Best Stocks In Any Market - Bull or Bear Market
Take A Peek At Our Top Ten Stocks Lists: Daily, Weekly, Year-to-Date & Top Trends
Smallcap Stocks With Best Up Trends [0-bearish to 100-bullish]: Surmodics [100], Rocky Brands[100], TransMedics Group[100], LendingClub [100], A10 s[100], Carpenter [100], UFP [100], PROCEPT BioRobotics[100], Xencor [100], Trinity Industries[100], TPG RE[100]
Best Smallcap Stocks Year-to-Date:
Janux [441.55%], Viking [310.45%], Longboard [259.25%], Alpine Immune[239.26%], Avidity Biosciences[185.4%], Bakkt [182.96%], Cullinan Oncology[175.33%], Vera [173.32%], Arcutis Bio[173.07%], Super Micro[159.62%], Y-mAbs [141.35%] Best Smallcap Stocks This Week:
Deciphera [73.07%], Eyenovia [44.86%], Cue Biopharma[39.93%], Poseida [30.52%], Seres [30.3%], P3 Health[29.62%], Phibro Animal[28.75%], TransMedics Group[27.69%], Surmodics [27.24%], LendingTree [26.12%], Rocky Brands[24.58%] Best Smallcap Stocks Daily:
Surmodics [29.62%], Rocky Brands[28.06%], TransMedics Group[24.91%], Ventyx Biosciences[24.63%], Eyenovia [21.17%], LendingClub [19.68%], Summit [19.08%], Powell Industries[18.74%], MiMedx Group[18.34%], CareDx [18.04%], A10 s[17.69%]