
 Login Sign Up


| |||||
 |  | ||||

| 12Stocks.com Market Intelligence |
Best SmallCap Stocks
|
| In a hurry? Small Cap Stock Lists: Performance Trends Table, Stock Charts
Sort Small Cap stocks: Daily, Weekly, Year-to-Date, Market Cap & Trends. Filter Small Cap stocks list by sector: Show all, Tech, Finance, Energy, Staples, Retail, Industrial, Materials, Utilities and HealthCare Filter Small Cap stocks list by size: All Large Medium Small and MicroCap |
| 12Stocks.com Small Cap Stocks Performances & Trends Daily | |||||||||
|
|  The overall Smart Investing & Trading Score is 58 (0-bearish to 100-bullish) which puts Small Cap index in short term neutral trend. The Smart Investing & Trading Score from previous trading session is 63 and hence a deterioration of trend.
| ||||||||
Here are the Smart Investing & Trading Scores of the most requested small cap stocks at 12Stocks.com (click stock name for detailed review):
|


| 12Stocks.com: Investing in Smallcap Index with Stocks | |
|
The following table helps investors and traders sort through current performance and trends (as measured by Smart Investing & Trading Score) of various
stocks in the Smallcap Index. Quick View: Move mouse or cursor over stock symbol (ticker) to view short-term technical chart and over stock name to view long term chart. Click on  to add stock symbol to your watchlist and to add stock symbol to your watchlist and  to view watchlist. Click on any ticker or stock name for detailed market intelligence report for that stock. to view watchlist. Click on any ticker or stock name for detailed market intelligence report for that stock. |
12Stocks.com Performance of Stocks in Smallcap Index
| Ticker | Stock Name | Watchlist | Category | Recent Price | Smart Investing & Trading Score | Change % | YTD Change% |
| LRN | K12 |   | Services & Goods | 63.23 | 90 | 8.64% | 6.50% |
| VRNT | Verint Systems | | Technology | 31.04 | 90 | 2.27% | 14.84% |
| QNST | QuinStreet | | Technology | 17.65 | 90 | 1.82% | 37.68% |
| GOGL | Golden Ocean | | Transports | 13.59 | 90 | 1.57% | 39.24% |
| PBI | Pitney Bowes | | Consumer Staples | 4.24 | 90 | 0.95% | -3.64% |
| SWX | Southwest Gas | | Utilities | 75.25 | 90 | 0.94% | 18.78% |
| SKT | Tanger Factory | | Financials | 28.65 | 90 | 0.53% | 3.35% |
| GNK | Genco Shipping | | Transports | 21.22 | 90 | 0.47% | 27.91% |
| CBZ | CBIZ | | Services & Goods | 78.33 | 90 | 0.33% | 25.15% |
| TPB | Turning Point | | Consumer Staples | 28.13 | 90 | 0.25% | 6.88% |
| TRTX | TPG RE | | Financials | 7.84 | 90 | 0.00% | 20.62% |
| PI | Impinj | | Technology | 120.91 | 90 | -2.24% | 34.30% |
| MLAB | Mesa | | Technology | 104.47 | 90 | -2.02% | -0.29% |
| KIND | Nextdoor | | Services & Goods | 2.12 | 90 | -1.63% | 14.32% |
| VEL | Velocity Financial | | Financials | 16.87 | 90 | -1.58% | 1.50% |
| PLUS | ePlus | | Technology | 79.03 | 90 | -1.35% | -1.01% |
| ADMA | ADMA Biologics | | Health Care | 6.46 | 90 | -1.22% | 42.92% |
| SLG | SL Green | | Financials | 52.16 | 90 | -0.48% | 15.47% |
| OXM | Oxford Industries | | Consumer Staples | 107.25 | 90 | -0.48% | 7.25% |
| HI | Hillenbrand | | Industrials | 48.95 | 90 | -0.47% | 2.30% |
| KAR | KAR Auction | | Services & Goods | 17.50 | 90 | -0.34% | 18.16% |
| RNA | Avidity Biosciences | | Health Care | 25.11 | 90 | -0.14% | 177.71% |
| FIHL | Fidelis Insurance | | Financials | 19.59 | 90 | -0.13% | 55.01% |
| ELF | e.l.f. Beauty | | Consumer Staples | 176.98 | 90 | -0.01% | 22.61% |
| TH | Target Hospitality | | Industrials | 11.01 | 88 | 1.85% | 13.16% |


| Too many stocks? View smallcap stocks filtered by marketcap & sector |
| Marketcap: All SmallCap Stocks (default-no microcap), Large, Mid-Range, Small |
| Smallcap Sector: Tech, Finance, Energy, Staples, Retail, Industrial, Materials, & Medical |
|
Get the most comprehensive stock market coverage daily at 12Stocks.com ➞ Best Stocks Today ➞ Best Stocks Weekly ➞ Best Stocks Year-to-Date ➞ Best Stocks Trends ➞  Best Stocks Today 12Stocks.com Best Nasdaq Stocks ➞ Best S&P 500 Stocks ➞ Best Tech Stocks ➞ Best Biotech Stocks ➞ |
| Detailed Overview of SmallCap Stocks |
| SmallCap Technical Overview, Leaders & Laggards, Top SmallCap ETF Funds & Detailed SmallCap Stocks List, Charts, Trends & More |
| Smallcap: Technical Analysis, Trends & YTD Performance | |
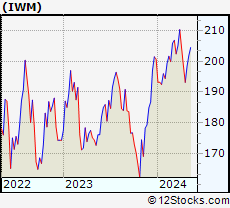
| SmallCap segment as represented by
IWM, an exchange-traded fund [ETF], holds basket of thousands of smallcap stocks from across all major sectors of the US stock market. The smallcap index (contains stocks like Riverbed & Sotheby's) is down by -1.51% and is currently underperforming the overall market by -7.17% year-to-date. Below is a quick view of technical charts and trends: | |
 IWM Weekly Chart |
|
| Long Term Trend: Good | |
| Medium Term Trend: Not Good | |
 IWM Daily Chart |
|
| Short Term Trend: Very Good | |
| Overall Trend Score: 58 | |
| YTD Performance: -1.51% | |
| **Trend Scores & Views Are Only For Educational Purposes And Not For Investing | |
| 12Stocks.com: Top Performing Small Cap Index Stocks | ||||||||||||||||||||||||||||||||||||||||||||||||
 The top performing Small Cap Index stocks year to date are
Now, more recently, over last week, the top performing Small Cap Index stocks on the move are


|
||||||||||||||||||||||||||||||||||||||||||||||||
| 12Stocks.com: Investing in Smallcap Index using Exchange Traded Funds | |
|
The following table shows list of key exchange traded funds (ETF) that
help investors track Smallcap index. The following list also includes leveraged ETF funds that track twice or thrice the daily returns of Smallcap indices. Short or inverse ETF funds move in the opposite direction to the index they track and are useful during market pullbacks or during bear markets. Quick View: Move mouse or cursor over ETF symbol (ticker) to view short-term technical chart and over ETF name to view long term chart. Click on ticker or stock name for detailed view. Click on to add stock symbol to your watchlist and to view watchlist. |
12Stocks.com List of ETFs that track Smallcap Index
| Ticker | ETF Name | Watchlist | Recent Price | Smart Investing & Trading Score | Change % | Week % | Year-to-date % |
| IWM | iShares Russell 2000 | | 197.68 | 58 | -0.45 | 2.35 | -1.51% |
| IJR | iShares Core S&P Small-Cap | | 105.71 | 85 | -0.24 | 2.41 | -2.35% |
| VTWO | Vanguard Russell 2000 ETF | | 79.93 | 63 | -0.45 | 2.37 | -1.44% |
| IWN | iShares Russell 2000 Value | | 151.28 | 75 | -0.30 | 2.37 | -2.61% |
| IWO | iShares Russell 2000 Growth | | 251.27 | 58 | -0.44 | 2.44 | -0.38% |
| IJS | iShares S&P Small-Cap 600 Value | | 97.71 | 60 | -0.43 | 2.2 | -5.2% |
| IJT | iShares S&P Small-Cap 600 Growth | | 125.37 | 70 | -0.28 | 2.59 | 0.18% |
| XSLV | PowerShares S&P SmallCap Low Volatil ETF | | 42.94 | 73 | -0.26 | 1.8 | -2.74% |
| SBB | ProShares Short SmallCap600 | | 16.37 | 33 | -0.02 | -2.79 | 2.76% |
| SMLV | SPDR SSGA US Small Cap Low Volatil ETF | | 108.43 | 73 | -0.31 | 2.21 | -3.63% |
| SAA | ProShares Ultra SmallCap600 | | 23.01 | 58 | -0.60 | 5.55 | -7.78% |
| SDD | ProShares UltraShort SmallCap600 | | 19.49 | 42 | 1.35 | -4.18 | 5.77% |
| 12Stocks.com: Charts, Trends, Fundamental Data and Performances of SmallCap Stocks | |
|
We now take in-depth look at all SmallCap stocks including charts, multi-period performances and overall trends (as measured by Smart Investing & Trading Score). One can sort SmallCap stocks (click link to choose) by Daily, Weekly and by Year-to-Date performances. Also, one can sort by size of the company or by market capitalization. |
| Select Your Default Chart Type: | |||||
| |||||
| Click on stock symbol or name for detailed view. Click on to add stock symbol to your watchlist and to view watchlist. Quick View: Move mouse or cursor over "Daily" to quickly view daily technical stock chart and over "Weekly" to view weekly technical stock chart. | |||||

 | LRN K12 Inc. |
| Sector: Services & Goods | |
| SubSector: Education & Training Services | |
| MarketCap: 549.606 Millions | |
| Recent Price: 63.23 Smart Investing & Trading Score: 90 | |
| Day Percent Change: 8.64% Day Change: 5.03 | |
| Week Change: 11.85% Year-to-date Change: 6.5% | |
| LRN Links: Profile News Message Board | |
| Charts:- Daily , Weekly | |
| Add LRN to Watchlist: View: Get Complete LRN Trend Analysis ➞ | |
 | VRNT Verint Systems Inc. |
| Sector: Technology | |
| SubSector: Business Software & Services | |
| MarketCap: 2902.18 Millions | |
| Recent Price: 31.04 Smart Investing & Trading Score: 90 | |
| Day Percent Change: 2.27% Day Change: 0.69 | |
| Week Change: 6.52% Year-to-date Change: 14.8% | |
| VRNT Links: Profile News Message Board | |
| Charts:- Daily , Weekly | |
| Add VRNT to Watchlist: View: Get Complete VRNT Trend Analysis ➞ | |
 | QNST QuinStreet, Inc. |
| Sector: Technology | |
| SubSector: Internet Software & Services | |
| MarketCap: 411.791 Millions | |
| Recent Price: 17.65 Smart Investing & Trading Score: 90 | |
| Day Percent Change: 1.82% Day Change: 0.31 | |
| Week Change: 5.06% Year-to-date Change: 37.7% | |
| QNST Links: Profile News Message Board | |
| Charts:- Daily , Weekly | |
| Add QNST to Watchlist: View: Get Complete QNST Trend Analysis ➞ | |
 | GOGL Golden Ocean Group Limited |
| Sector: Transports | |
| SubSector: Shipping | |
| MarketCap: 446.614 Millions | |
| Recent Price: 13.59 Smart Investing & Trading Score: 90 | |
| Day Percent Change: 1.57% Day Change: 0.21 | |
| Week Change: 4.78% Year-to-date Change: 39.2% | |
| GOGL Links: Profile News Message Board | |
| Charts:- Daily , Weekly | |
| Add GOGL to Watchlist: View: Get Complete GOGL Trend Analysis ➞ | |
 | PBI Pitney Bowes Inc. |
| Sector: Consumer Staples | |
| SubSector: Business Equipment | |
| MarketCap: 408.067 Millions | |
| Recent Price: 4.24 Smart Investing & Trading Score: 90 | |
| Day Percent Change: 0.95% Day Change: 0.04 | |
| Week Change: 6.27% Year-to-date Change: -3.6% | |
| PBI Links: Profile News Message Board | |
| Charts:- Daily , Weekly | |
| Add PBI to Watchlist: View: Get Complete PBI Trend Analysis ➞ | |
 | SWX Southwest Gas Holdings, Inc. |
| Sector: Utilities | |
| SubSector: Gas Utilities | |
| MarketCap: 3427.87 Millions | |
| Recent Price: 75.25 Smart Investing & Trading Score: 90 | |
| Day Percent Change: 0.94% Day Change: 0.70 | |
| Week Change: 2.41% Year-to-date Change: 18.8% | |
| SWX Links: Profile News Message Board | |
| Charts:- Daily , Weekly | |
| Add SWX to Watchlist: View: Get Complete SWX Trend Analysis ➞ | |
 | SKT Tanger Factory Outlet Centers, Inc. |
| Sector: Financials | |
| SubSector: REIT - Retail | |
| MarketCap: 720.214 Millions | |
| Recent Price: 28.65 Smart Investing & Trading Score: 90 | |
| Day Percent Change: 0.53% Day Change: 0.15 | |
| Week Change: 7.42% Year-to-date Change: 3.4% | |
| SKT Links: Profile News Message Board | |
| Charts:- Daily , Weekly | |
| Add SKT to Watchlist: View: Get Complete SKT Trend Analysis ➞ | |
 | GNK Genco Shipping & Trading Limited |
| Sector: Transports | |
| SubSector: Shipping | |
| MarketCap: 251.614 Millions | |
| Recent Price: 21.22 Smart Investing & Trading Score: 90 | |
| Day Percent Change: 0.47% Day Change: 0.10 | |
| Week Change: 3.26% Year-to-date Change: 27.9% | |
| GNK Links: Profile News Message Board | |
| Charts:- Daily , Weekly | |
| Add GNK to Watchlist: View: Get Complete GNK Trend Analysis ➞ | |
 | CBZ CBIZ, Inc. |
| Sector: Services & Goods | |
| SubSector: Business Services | |
| MarketCap: 1121.32 Millions | |
| Recent Price: 78.33 Smart Investing & Trading Score: 90 | |
| Day Percent Change: 0.33% Day Change: 0.26 | |
| Week Change: 4.55% Year-to-date Change: 25.2% | |
| CBZ Links: Profile News Message Board | |
| Charts:- Daily , Weekly | |
| Add CBZ to Watchlist: View: Get Complete CBZ Trend Analysis ➞ | |
 | TPB Turning Point Brands, Inc. |
| Sector: Consumer Staples | |
| SubSector: Tobacco Products, Other | |
| MarketCap: 381.97 Millions | |
| Recent Price: 28.13 Smart Investing & Trading Score: 90 | |
| Day Percent Change: 0.25% Day Change: 0.07 | |
| Week Change: 1.63% Year-to-date Change: 6.9% | |
| TPB Links: Profile News Message Board | |
| Charts:- Daily , Weekly | |
| Add TPB to Watchlist: View: Get Complete TPB Trend Analysis ➞ | |
 | TRTX TPG RE Finance Trust, Inc. |
| Sector: Financials | |
| SubSector: Mortgage Investment | |
| MarketCap: 607.739 Millions | |
| Recent Price: 7.84 Smart Investing & Trading Score: 90 | |
| Day Percent Change: 0.00% Day Change: 0.00 | |
| Week Change: 4.39% Year-to-date Change: 20.6% | |
| TRTX Links: Profile News Message Board | |
| Charts:- Daily , Weekly | |
| Add TRTX to Watchlist: View: Get Complete TRTX Trend Analysis ➞ | |
 | PI Impinj, Inc. |
| Sector: Technology | |
| SubSector: Communication Equipment | |
| MarketCap: 364.739 Millions | |
| Recent Price: 120.91 Smart Investing & Trading Score: 90 | |
| Day Percent Change: -2.24% Day Change: -2.77 | |
| Week Change: 3.95% Year-to-date Change: 34.3% | |
| PI Links: Profile News Message Board | |
| Charts:- Daily , Weekly | |
| Add PI to Watchlist: View: Get Complete PI Trend Analysis ➞ | |
 | MLAB Mesa Laboratories, Inc. |
| Sector: Technology | |
| SubSector: Scientific & Technical Instruments | |
| MarketCap: 935.453 Millions | |
| Recent Price: 104.47 Smart Investing & Trading Score: 90 | |
| Day Percent Change: -2.02% Day Change: -2.15 | |
| Week Change: 3.7% Year-to-date Change: -0.3% | |
| MLAB Links: Profile News Message Board | |
| Charts:- Daily , Weekly | |
| Add MLAB to Watchlist: View: Get Complete MLAB Trend Analysis ➞ | |
 | KIND Nextdoor Holdings, Inc. |
| Sector: Services & Goods | |
| SubSector: Internet Content & Information | |
| MarketCap: 1170 Millions | |
| Recent Price: 2.12 Smart Investing & Trading Score: 90 | |
| Day Percent Change: -1.63% Day Change: -0.03 | |
| Week Change: 6.82% Year-to-date Change: 14.3% | |
| KIND Links: Profile News Message Board | |
| Charts:- Daily , Weekly | |
| Add KIND to Watchlist: View: Get Complete KIND Trend Analysis ➞ | |
 | VEL Velocity Financial, Inc. |
| Sector: Financials | |
| SubSector: Mortgage Finance | |
| MarketCap: 12157 Millions | |
| Recent Price: 16.87 Smart Investing & Trading Score: 90 | |
| Day Percent Change: -1.58% Day Change: -0.27 | |
| Week Change: 5.9% Year-to-date Change: 1.5% | |
| VEL Links: Profile News Message Board | |
| Charts:- Daily , Weekly | |
| Add VEL to Watchlist: View: Get Complete VEL Trend Analysis ➞ | |
 | PLUS ePlus inc. |
| Sector: Technology | |
| SubSector: Application Software | |
| MarketCap: 728.262 Millions | |
| Recent Price: 79.03 Smart Investing & Trading Score: 90 | |
| Day Percent Change: -1.35% Day Change: -1.08 | |
| Week Change: 4.86% Year-to-date Change: -1.0% | |
| PLUS Links: Profile News Message Board | |
| Charts:- Daily , Weekly | |
| Add PLUS to Watchlist: View: Get Complete PLUS Trend Analysis ➞ | |
 | ADMA ADMA Biologics, Inc. |
| Sector: Health Care | |
| SubSector: Biotechnology | |
| MarketCap: 204.985 Millions | |
| Recent Price: 6.46 Smart Investing & Trading Score: 90 | |
| Day Percent Change: -1.22% Day Change: -0.08 | |
| Week Change: 3.03% Year-to-date Change: 42.9% | |
| ADMA Links: Profile News Message Board | |
| Charts:- Daily , Weekly | |
| Add ADMA to Watchlist: View: Get Complete ADMA Trend Analysis ➞ | |
 | SLG SL Green Realty Corp. |
| Sector: Financials | |
| SubSector: REIT - Retail | |
| MarketCap: 4048.14 Millions | |
| Recent Price: 52.16 Smart Investing & Trading Score: 90 | |
| Day Percent Change: -0.48% Day Change: -0.25 | |
| Week Change: 5.2% Year-to-date Change: 15.5% | |
| SLG Links: Profile News Message Board | |
| Charts:- Daily , Weekly | |
| Add SLG to Watchlist: View: Get Complete SLG Trend Analysis ➞ | |
 | OXM Oxford Industries, Inc. |
| Sector: Consumer Staples | |
| SubSector: Textile - Apparel Clothing | |
| MarketCap: 647.665 Millions | |
| Recent Price: 107.25 Smart Investing & Trading Score: 90 | |
| Day Percent Change: -0.48% Day Change: -0.52 | |
| Week Change: 2.42% Year-to-date Change: 7.3% | |
| OXM Links: Profile News Message Board | |
| Charts:- Daily , Weekly | |
| Add OXM to Watchlist: View: Get Complete OXM Trend Analysis ➞ | |
 | HI Hillenbrand, Inc. |
| Sector: Industrials | |
| SubSector: Diversified Machinery | |
| MarketCap: 1389.86 Millions | |
| Recent Price: 48.95 Smart Investing & Trading Score: 90 | |
| Day Percent Change: -0.47% Day Change: -0.23 | |
| Week Change: 1.94% Year-to-date Change: 2.3% | |
| HI Links: Profile News Message Board | |
| Charts:- Daily , Weekly | |
| Add HI to Watchlist: View: Get Complete HI Trend Analysis ➞ | |
 | KAR KAR Auction Services, Inc. |
| Sector: Services & Goods | |
| SubSector: Specialty Retail, Other | |
| MarketCap: 1709.54 Millions | |
| Recent Price: 17.50 Smart Investing & Trading Score: 90 | |
| Day Percent Change: -0.34% Day Change: -0.06 | |
| Week Change: 3% Year-to-date Change: 18.2% | |
| KAR Links: Profile News Message Board | |
| Charts:- Daily , Weekly | |
| Add KAR to Watchlist: View: Get Complete KAR Trend Analysis ➞ | |
 | RNA Avidity Biosciences, Inc. |
| Sector: Health Care | |
| SubSector: Biotechnology | |
| MarketCap: 12287 Millions | |
| Recent Price: 25.11 Smart Investing & Trading Score: 90 | |
| Day Percent Change: -0.14% Day Change: -0.04 | |
| Week Change: 9.49% Year-to-date Change: 177.7% | |
| RNA Links: Profile News Message Board | |
| Charts:- Daily , Weekly | |
| Add RNA to Watchlist: View: Get Complete RNA Trend Analysis ➞ | |
 | FIHL Fidelis Insurance Holdings Limited |
| Sector: Financials | |
| SubSector: Insurance - Diversified | |
| MarketCap: 1590 Millions | |
| Recent Price: 19.59 Smart Investing & Trading Score: 90 | |
| Day Percent Change: -0.13% Day Change: -0.02 | |
| Week Change: 2.65% Year-to-date Change: 55.0% | |
| FIHL Links: Profile News Message Board | |
| Charts:- Daily , Weekly | |
| Add FIHL to Watchlist: View: Get Complete FIHL Trend Analysis ➞ | |
 | ELF e.l.f. Beauty, Inc. |
| Sector: Consumer Staples | |
| SubSector: Personal Products | |
| MarketCap: 497.985 Millions | |
| Recent Price: 176.98 Smart Investing & Trading Score: 90 | |
| Day Percent Change: -0.01% Day Change: -0.01 | |
| Week Change: 12.92% Year-to-date Change: 22.6% | |
| ELF Links: Profile News Message Board | |
| Charts:- Daily , Weekly | |
| Add ELF to Watchlist: View: Get Complete ELF Trend Analysis ➞ | |
 | TH Target Hospitality Corp. |
| Sector: Industrials | |
| SubSector: Conglomerates | |
| MarketCap: 218.048 Millions | |
| Recent Price: 11.01 Smart Investing & Trading Score: 88 | |
| Day Percent Change: 1.85% Day Change: 0.20 | |
| Week Change: 1.1% Year-to-date Change: 13.2% | |
| TH Links: Profile News Message Board | |
| Charts:- Daily , Weekly | |
| Add TH to Watchlist: View: Get Complete TH Trend Analysis ➞ | |
| Too many stocks? View smallcap stocks filtered by marketcap & sector |
| Marketcap: All SmallCap Stocks (default-no microcap), Large, Mid-Range, Small & MicroCap |
| Sector: Tech, Finance, Energy, Staples, Retail, Industrial, Materials, Utilities & Medical |
|
Best Stocks Today 12Stocks.com |
© 2024 12Stocks.com Terms & Conditions Privacy Contact Us
All Information Provided Only For Education And Not To Be Used For Investing or Trading. See Terms & Conditions


One More Thing ... Get Best Stocks Delivered Daily!
Never Ever Miss A Move With Our Top Ten Stocks Lists
Find Best Stocks In Any Market - Bull or Bear Market
Take A Peek At Our Top Ten Stocks Lists: Daily, Weekly, Year-to-Date & Top Trends
Find Best Stocks In Any Market - Bull or Bear Market
Take A Peek At Our Top Ten Stocks Lists: Daily, Weekly, Year-to-Date & Top Trends
Smallcap Stocks With Best Up Trends [0-bearish to 100-bullish]: B. Riley[100], Ribbon [100], Group 1[100], Trustmark [100], MBIA [100], Integer [100], EchoStar [100], Comstock Resources[100], Vishay Inter[100], First Ban[100], Jamf Holding[100]
Best Smallcap Stocks Year-to-Date:
CareMax [574.23%], Janux [352.07%], Viking [249.65%], Alpine Immune[239.13%], Longboard [223.4%], Avidity Biosciences[177.71%], Arcutis Bio[170.9%], Super Micro[165.5%], Vera [149.61%], Hippo [130.79%], Y-mAbs [124.19%] Best Smallcap Stocks This Week:
Matterport [166.09%], B. Riley[48.82%], Seres [30.29%], Riot Blockchain[30.12%], CareMax [27.24%], Ribbon [25.97%], ProKidney [23.28%], SoundHound AI[22.54%], Cipher Mining[22.14%], Hibbett Sports[21.61%], Cullinan Oncology[20.69%] Best Smallcap Stocks Daily:
B. Riley[36.97%], Ribbon [26.46%], Babcock & Wilcox Enterprises[15.57%], Cullinan Oncology[13.55%], Amneal [12.04%], Comtech Tele[10.76%], Innodata [10.28%], Gritstone Oncology[10.06%], Navitas Semiconductor[8.83%], Eyenovia [8.68%], K12 [8.64%]