
 Login Sign Up


| |||||
 |  | ||||

| 12Stocks.com Market Intelligence |
Best SmallCap Stocks
|
| In a hurry? Small Cap Stock Lists: Performance Trends Table, Stock Charts
Sort Small Cap stocks: Daily, Weekly, Year-to-Date, Market Cap & Trends. Filter Small Cap stocks list by sector: Show all, Tech, Finance, Energy, Staples, Retail, Industrial, Materials, Utilities and HealthCare Filter Small Cap stocks list by size: All Large Medium Small and MicroCap |
| 12Stocks.com Small Cap Stocks Performances & Trends Daily | |||||||||
|
|  The overall Smart Investing & Trading Score is 58 (0-bearish to 100-bullish) which puts Small Cap index in short term neutral trend. The Smart Investing & Trading Score from previous trading session is 63 and hence a deterioration of trend.
| ||||||||
Here are the Smart Investing & Trading Scores of the most requested small cap stocks at 12Stocks.com (click stock name for detailed review):
|


| 12Stocks.com: Investing in Smallcap Index with Stocks | |
|
The following table helps investors and traders sort through current performance and trends (as measured by Smart Investing & Trading Score) of various
stocks in the Smallcap Index. Quick View: Move mouse or cursor over stock symbol (ticker) to view short-term technical chart and over stock name to view long term chart. Click on  to add stock symbol to your watchlist and to add stock symbol to your watchlist and  to view watchlist. Click on any ticker or stock name for detailed market intelligence report for that stock. to view watchlist. Click on any ticker or stock name for detailed market intelligence report for that stock. |
12Stocks.com Performance of Stocks in Smallcap Index
| Ticker | Stock Name | Watchlist | Category | Recent Price | Smart Investing & Trading Score | Change % | YTD Change% |
| COGT | Cogint |   | Technology | 6.54 | 12 | -6.03% | 11.22% |
| NHC | National HealthCare | | Health Care | 91.13 | 12 | -0.05% | -1.40% |
| CRNC | Cerence | | Technology | 10.05 | 10 | 2.97% | -48.88% |
| OPRX | OptimizeRx | | Technology | 9.16 | 10 | 2.46% | -35.99% |
| CYTK | Cytokinetics | | Health Care | 66.82 | 10 | 1.91% | -19.97% |
| KOD | Kodiak Sciences | | Health Care | 3.38 | 10 | 1.50% | 11.18% |
| RYAM | Rayonier Advanced | | Materials | 4.12 | 10 | 1.48% | 1.73% |
| CNDT | Conduent | | Technology | 3.07 | 10 | 1.32% | -15.89% |
| CALX | Calix | | Technology | 28.25 | 10 | 0.78% | -35.34% |
| SPT | Sprout Social | | Technology | 52.48 | 10 | 0.69% | -14.58% |
| RYI | Ryerson Holding | | Industrials | 9.45 | 10 | 0.64% | -9.89% |
| PGNY | Progyny | | Technology | 32.60 | 10 | 0.62% | -12.32% |
| RLGT | Radiant Logistics | | Transports | 4.93 | 10 | 0.61% | -25.75% |
| TENB | Tenable | | Technology | 46.42 | 10 | 0.59% | 0.78% |
| MGRC | McGrath RentCorp | | Transports | 108.53 | 10 | 0.56% | -9.27% |
| BBCP | Concrete Pumping | | Industrials | 6.57 | 10 | 0.46% | -19.88% |
| FIZZ | National Beverage | | Consumer Staples | 44.53 | 10 | 0.25% | -10.44% |
| WDFC | WD-40 | | Materials | 226.69 | 10 | 0.23% | -5.18% |
| PKOH | Park-Ohio | | Services & Goods | 23.96 | 10 | 0.21% | -11.13% |
| NRC | National Research | | Health Care | 34.27 | 10 | 0.09% | -13.37% |
| RDVT | Red Violet | | Technology | 17.01 | 10 | 0.06% | -14.82% |
| AIN | Albany | | Industrials | 88.08 | 10 | 0.00% | -10.32% |
| PRTS | U.S. Auto | | Consumer Staples | 1.25 | 10 | 0.00% | -60.44% |
| DHC | Diversified Healthcare | | Financials | 2.41 | 10 | 0.00% | -35.56% |
| VICR | Vicor | | Technology | 32.03 | 10 | -8.95% | -28.73% |


| Too many stocks? View smallcap stocks filtered by marketcap & sector |
| Marketcap: All SmallCap Stocks (default-no microcap), Large, Mid-Range, Small |
| Smallcap Sector: Tech, Finance, Energy, Staples, Retail, Industrial, Materials, & Medical |
|
Get the most comprehensive stock market coverage daily at 12Stocks.com ➞ Best Stocks Today ➞ Best Stocks Weekly ➞ Best Stocks Year-to-Date ➞ Best Stocks Trends ➞  Best Stocks Today 12Stocks.com Best Nasdaq Stocks ➞ Best S&P 500 Stocks ➞ Best Tech Stocks ➞ Best Biotech Stocks ➞ |
| Detailed Overview of SmallCap Stocks |
| SmallCap Technical Overview, Leaders & Laggards, Top SmallCap ETF Funds & Detailed SmallCap Stocks List, Charts, Trends & More |
| Smallcap: Technical Analysis, Trends & YTD Performance | |
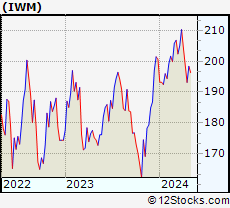
| SmallCap segment as represented by
IWM, an exchange-traded fund [ETF], holds basket of thousands of smallcap stocks from across all major sectors of the US stock market. The smallcap index (contains stocks like Riverbed & Sotheby's) is down by -1.51% and is currently underperforming the overall market by -7.17% year-to-date. Below is a quick view of technical charts and trends: | |
 IWM Weekly Chart |
|
| Long Term Trend: Good | |
| Medium Term Trend: Not Good | |
 IWM Daily Chart |
|
| Short Term Trend: Very Good | |
| Overall Trend Score: 58 | |
| YTD Performance: -1.51% | |
| **Trend Scores & Views Are Only For Educational Purposes And Not For Investing | |
| 12Stocks.com: Top Performing Small Cap Index Stocks | ||||||||||||||||||||||||||||||||||||||||||||||||
 The top performing Small Cap Index stocks year to date are
Now, more recently, over last week, the top performing Small Cap Index stocks on the move are


|
||||||||||||||||||||||||||||||||||||||||||||||||
| 12Stocks.com: Investing in Smallcap Index using Exchange Traded Funds | |
|
The following table shows list of key exchange traded funds (ETF) that
help investors track Smallcap index. The following list also includes leveraged ETF funds that track twice or thrice the daily returns of Smallcap indices. Short or inverse ETF funds move in the opposite direction to the index they track and are useful during market pullbacks or during bear markets. Quick View: Move mouse or cursor over ETF symbol (ticker) to view short-term technical chart and over ETF name to view long term chart. Click on ticker or stock name for detailed view. Click on to add stock symbol to your watchlist and to view watchlist. |
12Stocks.com List of ETFs that track Smallcap Index
| Ticker | ETF Name | Watchlist | Recent Price | Smart Investing & Trading Score | Change % | Week % | Year-to-date % |
| IWM | iShares Russell 2000 | | 197.68 | 58 | -0.45 | 2.35 | -1.51% |
| IJR | iShares Core S&P Small-Cap | | 105.71 | 85 | -0.24 | 2.41 | -2.35% |
| VTWO | Vanguard Russell 2000 ETF | | 79.93 | 48 | -0.45 | 2.37 | -1.44% |
| IWN | iShares Russell 2000 Value | | 151.28 | 75 | -0.30 | 2.37 | -2.61% |
| IWO | iShares Russell 2000 Growth | | 251.27 | 58 | -0.44 | 2.44 | -0.38% |
| IJS | iShares S&P Small-Cap 600 Value | | 97.71 | 45 | -0.43 | 2.2 | -5.2% |
| IJT | iShares S&P Small-Cap 600 Growth | | 125.37 | 48 | -0.28 | 2.59 | 0.18% |
| XSLV | PowerShares S&P SmallCap Low Volatil ETF | | 42.94 | 48 | -0.26 | 1.8 | -2.74% |
| SBB | ProShares Short SmallCap600 | | 16.37 | 33 | -0.02 | -2.79 | 2.76% |
| SMLV | SPDR SSGA US Small Cap Low Volatil ETF | | 108.43 | 73 | -0.31 | 2.21 | -3.63% |
| SAA | ProShares Ultra SmallCap600 | | 23.01 | 58 | -0.60 | 5.55 | -7.78% |
| SDD | ProShares UltraShort SmallCap600 | | 19.49 | 42 | 1.35 | -4.18 | 5.77% |
| 12Stocks.com: Charts, Trends, Fundamental Data and Performances of SmallCap Stocks | |
|
We now take in-depth look at all SmallCap stocks including charts, multi-period performances and overall trends (as measured by Smart Investing & Trading Score). One can sort SmallCap stocks (click link to choose) by Daily, Weekly and by Year-to-Date performances. Also, one can sort by size of the company or by market capitalization. |
| Select Your Default Chart Type: | |||||
| |||||
| Click on stock symbol or name for detailed view. Click on to add stock symbol to your watchlist and to view watchlist. Quick View: Move mouse or cursor over "Daily" to quickly view daily technical stock chart and over "Weekly" to view weekly technical stock chart. | |||||

 | COGT Cogint, Inc. |
| Sector: Technology | |
| SubSector: Business Software & Services | |
| MarketCap: 214.55 Millions | |
| Recent Price: 6.54 Smart Investing & Trading Score: 12 | |
| Day Percent Change: -6.03% Day Change: -0.42 | |
| Week Change: -2.53% Year-to-date Change: 11.2% | |
| COGT Links: Profile News Message Board | |
| Charts:- Daily , Weekly | |
| Add COGT to Watchlist: View: Get Complete COGT Trend Analysis ➞ | |
 | NHC National HealthCare Corporation |
| Sector: Health Care | |
| SubSector: Long-Term Care Facilities | |
| MarketCap: 1164.86 Millions | |
| Recent Price: 91.13 Smart Investing & Trading Score: 12 | |
| Day Percent Change: -0.05% Day Change: -0.05 | |
| Week Change: 0.56% Year-to-date Change: -1.4% | |
| NHC Links: Profile News Message Board | |
| Charts:- Daily , Weekly | |
| Add NHC to Watchlist: View: Get Complete NHC Trend Analysis ➞ | |
 | CRNC Cerence Inc. |
| Sector: Technology | |
| SubSector: Application Software | |
| MarketCap: 640.662 Millions | |
| Recent Price: 10.05 Smart Investing & Trading Score: 10 | |
| Day Percent Change: 2.97% Day Change: 0.29 | |
| Week Change: -3.09% Year-to-date Change: -48.9% | |
| CRNC Links: Profile News Message Board | |
| Charts:- Daily , Weekly | |
| Add CRNC to Watchlist: View: Get Complete CRNC Trend Analysis ➞ | |
 | OPRX OptimizeRx Corporation |
| Sector: Technology | |
| SubSector: Healthcare Information Services | |
| MarketCap: 107.155 Millions | |
| Recent Price: 9.16 Smart Investing & Trading Score: 10 | |
| Day Percent Change: 2.46% Day Change: 0.22 | |
| Week Change: -1.51% Year-to-date Change: -36.0% | |
| OPRX Links: Profile News Message Board | |
| Charts:- Daily , Weekly | |
| Add OPRX to Watchlist: View: Get Complete OPRX Trend Analysis ➞ | |
 | CYTK Cytokinetics, Incorporated |
| Sector: Health Care | |
| SubSector: Biotechnology | |
| MarketCap: 654.285 Millions | |
| Recent Price: 66.82 Smart Investing & Trading Score: 10 | |
| Day Percent Change: 1.91% Day Change: 1.25 | |
| Week Change: -1.08% Year-to-date Change: -20.0% | |
| CYTK Links: Profile News Message Board | |
| Charts:- Daily , Weekly | |
| Add CYTK to Watchlist: View: Get Complete CYTK Trend Analysis ➞ | |
 | KOD Kodiak Sciences Inc. |
| Sector: Health Care | |
| SubSector: Biotechnology | |
| MarketCap: 2132.15 Millions | |
| Recent Price: 3.38 Smart Investing & Trading Score: 10 | |
| Day Percent Change: 1.50% Day Change: 0.05 | |
| Week Change: 0.6% Year-to-date Change: 11.2% | |
| KOD Links: Profile News Message Board | |
| Charts:- Daily , Weekly | |
| Add KOD to Watchlist: View: Get Complete KOD Trend Analysis ➞ | |
 | RYAM Rayonier Advanced Materials Inc. |
| Sector: Materials | |
| SubSector: Chemicals - Major Diversified | |
| MarketCap: 116.736 Millions | |
| Recent Price: 4.12 Smart Investing & Trading Score: 10 | |
| Day Percent Change: 1.48% Day Change: 0.06 | |
| Week Change: -4.19% Year-to-date Change: 1.7% | |
| RYAM Links: Profile News Message Board | |
| Charts:- Daily , Weekly | |
| Add RYAM to Watchlist: View: Get Complete RYAM Trend Analysis ➞ | |
 | CNDT Conduent Incorporated |
| Sector: Technology | |
| SubSector: Information Technology Services | |
| MarketCap: 514.968 Millions | |
| Recent Price: 3.07 Smart Investing & Trading Score: 10 | |
| Day Percent Change: 1.32% Day Change: 0.04 | |
| Week Change: 0.33% Year-to-date Change: -15.9% | |
| CNDT Links: Profile News Message Board | |
| Charts:- Daily , Weekly | |
| Add CNDT to Watchlist: View: Get Complete CNDT Trend Analysis ➞ | |
 | CALX Calix, Inc. |
| Sector: Technology | |
| SubSector: Communication Equipment | |
| MarketCap: 390.039 Millions | |
| Recent Price: 28.25 Smart Investing & Trading Score: 10 | |
| Day Percent Change: 0.78% Day Change: 0.22 | |
| Week Change: -3.52% Year-to-date Change: -35.3% | |
| CALX Links: Profile News Message Board | |
| Charts:- Daily , Weekly | |
| Add CALX to Watchlist: View: Get Complete CALX Trend Analysis ➞ | |
 | SPT Sprout Social, Inc. |
| Sector: Technology | |
| SubSector: Software Application | |
| MarketCap: 25087 Millions | |
| Recent Price: 52.48 Smart Investing & Trading Score: 10 | |
| Day Percent Change: 0.69% Day Change: 0.36 | |
| Week Change: 2.82% Year-to-date Change: -14.6% | |
| SPT Links: Profile News Message Board | |
| Charts:- Daily , Weekly | |
| Add SPT to Watchlist: View: Get Complete SPT Trend Analysis ➞ | |
 | RYI Ryerson Holding Corporation |
| Sector: Industrials | |
| SubSector: Metal Fabrication | |
| MarketCap: 202.55 Millions | |
| Recent Price: 9.45 Smart Investing & Trading Score: 10 | |
| Day Percent Change: 0.64% Day Change: 0.06 | |
| Week Change: -2.34% Year-to-date Change: -9.9% | |
| RYI Links: Profile News Message Board | |
| Charts:- Daily , Weekly | |
| Add RYI to Watchlist: View: Get Complete RYI Trend Analysis ➞ | |
 | PGNY Progyny, Inc. |
| Sector: Technology | |
| SubSector: Healthcare Information Services | |
| MarketCap: 1839.05 Millions | |
| Recent Price: 32.60 Smart Investing & Trading Score: 10 | |
| Day Percent Change: 0.62% Day Change: 0.20 | |
| Week Change: -0.24% Year-to-date Change: -12.3% | |
| PGNY Links: Profile News Message Board | |
| Charts:- Daily , Weekly | |
| Add PGNY to Watchlist: View: Get Complete PGNY Trend Analysis ➞ | |
 | RLGT Radiant Logistics, Inc. |
| Sector: Transports | |
| SubSector: Air Delivery & Freight Services | |
| MarketCap: 180.868 Millions | |
| Recent Price: 4.93 Smart Investing & Trading Score: 10 | |
| Day Percent Change: 0.61% Day Change: 0.03 | |
| Week Change: 0% Year-to-date Change: -25.8% | |
| RLGT Links: Profile News Message Board | |
| Charts:- Daily , Weekly | |
| Add RLGT to Watchlist: View: Get Complete RLGT Trend Analysis ➞ | |
 | TENB Tenable Holdings, Inc. |
| Sector: Technology | |
| SubSector: Business Software & Services | |
| MarketCap: 1986.68 Millions | |
| Recent Price: 46.42 Smart Investing & Trading Score: 10 | |
| Day Percent Change: 0.59% Day Change: 0.27 | |
| Week Change: 3.55% Year-to-date Change: 0.8% | |
| TENB Links: Profile News Message Board | |
| Charts:- Daily , Weekly | |
| Add TENB to Watchlist: View: Get Complete TENB Trend Analysis ➞ | |
 | MGRC McGrath RentCorp |
| Sector: Transports | |
| SubSector: Rental & Leasing Services | |
| MarketCap: 1289.04 Millions | |
| Recent Price: 108.53 Smart Investing & Trading Score: 10 | |
| Day Percent Change: 0.56% Day Change: 0.60 | |
| Week Change: -1.68% Year-to-date Change: -9.3% | |
| MGRC Links: Profile News Message Board | |
| Charts:- Daily , Weekly | |
| Add MGRC to Watchlist: View: Get Complete MGRC Trend Analysis ➞ | |
 | BBCP Concrete Pumping Holdings, Inc. |
| Sector: Industrials | |
| SubSector: General Building Materials | |
| MarketCap: 263.653 Millions | |
| Recent Price: 6.57 Smart Investing & Trading Score: 10 | |
| Day Percent Change: 0.46% Day Change: 0.03 | |
| Week Change: -1.35% Year-to-date Change: -19.9% | |
| BBCP Links: Profile News Message Board | |
| Charts:- Daily , Weekly | |
| Add BBCP to Watchlist: View: Get Complete BBCP Trend Analysis ➞ | |
 | FIZZ National Beverage Corp. |
| Sector: Consumer Staples | |
| SubSector: Beverages - Soft Drinks | |
| MarketCap: 2031.4 Millions | |
| Recent Price: 44.53 Smart Investing & Trading Score: 10 | |
| Day Percent Change: 0.25% Day Change: 0.11 | |
| Week Change: -1.81% Year-to-date Change: -10.4% | |
| FIZZ Links: Profile News Message Board | |
| Charts:- Daily , Weekly | |
| Add FIZZ to Watchlist: View: Get Complete FIZZ Trend Analysis ➞ | |
 | WDFC WD-40 Company |
| Sector: Materials | |
| SubSector: Specialty Chemicals | |
| MarketCap: 2900.57 Millions | |
| Recent Price: 226.69 Smart Investing & Trading Score: 10 | |
| Day Percent Change: 0.23% Day Change: 0.52 | |
| Week Change: -1.37% Year-to-date Change: -5.2% | |
| WDFC Links: Profile News Message Board | |
| Charts:- Daily , Weekly | |
| Add WDFC to Watchlist: View: Get Complete WDFC Trend Analysis ➞ | |
 | PKOH Park-Ohio Holdings Corp. |
| Sector: Services & Goods | |
| SubSector: Industrial Equipment Wholesale | |
| MarketCap: 214.358 Millions | |
| Recent Price: 23.96 Smart Investing & Trading Score: 10 | |
| Day Percent Change: 0.21% Day Change: 0.05 | |
| Week Change: 0.25% Year-to-date Change: -11.1% | |
| PKOH Links: Profile News Message Board | |
| Charts:- Daily , Weekly | |
| Add PKOH to Watchlist: View: Get Complete PKOH Trend Analysis ➞ | |
 | NRC National Research Corporation |
| Sector: Health Care | |
| SubSector: Medical Laboratories & Research | |
| MarketCap: 1187.7 Millions | |
| Recent Price: 34.27 Smart Investing & Trading Score: 10 | |
| Day Percent Change: 0.09% Day Change: 0.03 | |
| Week Change: 0.71% Year-to-date Change: -13.4% | |
| NRC Links: Profile News Message Board | |
| Charts:- Daily , Weekly | |
| Add NRC to Watchlist: View: Get Complete NRC Trend Analysis ➞ | |
 | RDVT Red Violet, Inc. |
| Sector: Technology | |
| SubSector: Application Software | |
| MarketCap: 215.162 Millions | |
| Recent Price: 17.01 Smart Investing & Trading Score: 10 | |
| Day Percent Change: 0.06% Day Change: 0.01 | |
| Week Change: -4.22% Year-to-date Change: -14.8% | |
| RDVT Links: Profile News Message Board | |
| Charts:- Daily , Weekly | |
| Add RDVT to Watchlist: View: Get Complete RDVT Trend Analysis ➞ | |
 | AIN Albany International Corp. |
| Sector: Industrials | |
| SubSector: Textile Industrial | |
| MarketCap: 1538.4 Millions | |
| Recent Price: 88.08 Smart Investing & Trading Score: 10 | |
| Day Percent Change: 0.00% Day Change: 0.00 | |
| Week Change: -0.17% Year-to-date Change: -10.3% | |
| AIN Links: Profile News Message Board | |
| Charts:- Daily , Weekly | |
| Add AIN to Watchlist: View: Get Complete AIN Trend Analysis ➞ | |
 | PRTS U.S. Auto Parts Network, Inc. |
| Sector: Consumer Staples | |
| SubSector: Auto Parts | |
| MarketCap: 65.0939 Millions | |
| Recent Price: 1.25 Smart Investing & Trading Score: 10 | |
| Day Percent Change: 0.00% Day Change: 0.00 | |
| Week Change: -2.34% Year-to-date Change: -60.4% | |
| PRTS Links: Profile News Message Board | |
| Charts:- Daily , Weekly | |
| Add PRTS to Watchlist: View: Get Complete PRTS Trend Analysis ➞ | |
 | DHC Diversified Healthcare Trust |
| Sector: Financials | |
| SubSector: REIT - Healthcare Facilities | |
| MarketCap: 814.114 Millions | |
| Recent Price: 2.41 Smart Investing & Trading Score: 10 | |
| Day Percent Change: 0.00% Day Change: 0.00 | |
| Week Change: -0.21% Year-to-date Change: -35.6% | |
| DHC Links: Profile News Message Board | |
| Charts:- Daily , Weekly | |
| Add DHC to Watchlist: View: Get Complete DHC Trend Analysis ➞ | |
 | VICR Vicor Corporation |
| Sector: Technology | |
| SubSector: Diversified Electronics | |
| MarketCap: 1526.76 Millions | |
| Recent Price: 32.03 Smart Investing & Trading Score: 10 | |
| Day Percent Change: -8.95% Day Change: -3.15 | |
| Week Change: -5.43% Year-to-date Change: -28.7% | |
| VICR Links: Profile News Message Board | |
| Charts:- Daily , Weekly | |
| Add VICR to Watchlist: View: Get Complete VICR Trend Analysis ➞ | |
| Too many stocks? View smallcap stocks filtered by marketcap & sector |
| Marketcap: All SmallCap Stocks (default-no microcap), Large, Mid-Range, Small & MicroCap |
| Sector: Tech, Finance, Energy, Staples, Retail, Industrial, Materials, Utilities & Medical |
|
Best Stocks Today 12Stocks.com |
© 2024 12Stocks.com Terms & Conditions Privacy Contact Us
All Information Provided Only For Education And Not To Be Used For Investing or Trading. See Terms & Conditions


One More Thing ... Get Best Stocks Delivered Daily!
Never Ever Miss A Move With Our Top Ten Stocks Lists
Find Best Stocks In Any Market - Bull or Bear Market
Take A Peek At Our Top Ten Stocks Lists: Daily, Weekly, Year-to-Date & Top Trends
Find Best Stocks In Any Market - Bull or Bear Market
Take A Peek At Our Top Ten Stocks Lists: Daily, Weekly, Year-to-Date & Top Trends
Smallcap Stocks With Best Up Trends [0-bearish to 100-bullish]: B. Riley[100], Ribbon [100], Group 1[100], Trustmark [100], MBIA [100], Integer [100], EchoStar [100], Comstock Resources[100], Vishay Inter[100], Jamf Holding[100], SunOpta [100]
Best Smallcap Stocks Year-to-Date:
CareMax [574.23%], Janux [352.07%], Viking [249.65%], Alpine Immune[239.13%], Longboard [223.4%], Avidity Biosciences[177.71%], Arcutis Bio[170.9%], Super Micro[165.5%], Vera [149.61%], Hippo [130.79%], Y-mAbs [124.19%] Best Smallcap Stocks This Week:
Matterport [166.09%], B. Riley[48.82%], Seres [30.29%], Riot Blockchain[30.12%], CareMax [27.24%], Ribbon [25.97%], ProKidney [23.28%], SoundHound AI[22.54%], Cipher Mining[22.14%], Hibbett Sports[21.61%], Cullinan Oncology[20.69%] Best Smallcap Stocks Daily:
B. Riley[36.97%], Ribbon [26.46%], Babcock & Wilcox Enterprises[15.57%], Cullinan Oncology[13.55%], Amneal [12.04%], Comtech Tele[10.76%], Innodata [10.28%], Gritstone Oncology[10.06%], Navitas Semiconductor[8.83%], Eyenovia [8.68%], K12 [8.64%]