
 Login Sign Up


| |||||
 |  | ||||

| 12Stocks.com Market Intelligence |
Best SmallCap Stocks
|
| In a hurry? Small Cap Stock Lists: Performance Trends Table, Stock Charts
Sort Small Cap stocks: Daily, Weekly, Year-to-Date, Market Cap & Trends. Filter Small Cap stocks list by sector: Show all, Tech, Finance, Energy, Staples, Retail, Industrial, Materials, Utilities and HealthCare Filter Small Cap stocks list by size: All Large Medium Small and MicroCap |
| 12Stocks.com Small Cap Stocks Performances & Trends Daily | |||||||||
|
|  The overall Smart Investing & Trading Score is 75 (0-bearish to 100-bullish) which puts Small Cap index in short term neutral to bullish trend. The Smart Investing & Trading Score from previous trading session is 70 and hence an improvement of trend.
| ||||||||
Here are the Smart Investing & Trading Scores of the most requested small cap stocks at 12Stocks.com (click stock name for detailed review):
|


| 12Stocks.com: Investing in Smallcap Index with Stocks | |
|
The following table helps investors and traders sort through current performance and trends (as measured by Smart Investing & Trading Score) of various
stocks in the Smallcap Index. Quick View: Move mouse or cursor over stock symbol (ticker) to view short-term technical chart and over stock name to view long term chart. Click on  to add stock symbol to your watchlist and to add stock symbol to your watchlist and  to view watchlist. Click on any ticker or stock name for detailed market intelligence report for that stock. to view watchlist. Click on any ticker or stock name for detailed market intelligence report for that stock. |
12Stocks.com Performance of Stocks in Smallcap Index
| Ticker | Stock Name | Watchlist | Category | Recent Price | Smart Investing & Trading Score | Change % | YTD Change% |
| AMCX | AMC s |   | Services & Goods | 13.38 | 100 | 0.75% | -28.79% |
| GATX | GATX | | Transports | 132.47 | 100 | 0.75% | 10.19% |
| UCTT | Ultra Clean | | Technology | 44.10 | 100 | 0.71% | 29.17% |
| FBMS | First Bancshares | | Financials | 25.41 | 100 | 0.71% | -13.37% |
| SFL | SFL | | Transports | 14.13 | 100 | 0.68% | 25.22% |
| MCY | Mercury General | | Financials | 57.24 | 100 | 0.67% | 53.42% |
| FRME | First Merchants | | Financials | 35.88 | 100 | 0.66% | -3.22% |
| SJW | SJW Group | | Utilities | 57.04 | 100 | 0.65% | -12.72% |
| SAFT | Safety Insurance | | Financials | 82.80 | 100 | 0.63% | 8.96% |
| IRT | Independence Realty | | Financials | 16.68 | 100 | 0.60% | 9.02% |
| AAT | American Assets | | Financials | 22.21 | 100 | 0.59% | -1.33% |
| OTTR | Otter Tail | | Utilities | 93.26 | 100 | 0.57% | 9.76% |
| LBAI | Lakeland Bancorp | | Financials | 13.19 | 100 | 0.53% | -10.82% |
| KLIC | Kulicke and | | Technology | 48.46 | 100 | 0.52% | -11.44% |
| FCF | First Commonwealth | | Financials | 13.92 | 100 | 0.51% | -9.84% |
| INSW | Seaways | | Services & Goods | 61.60 | 100 | 0.51% | 35.44% |
| AGX | Argan | | Industrials | 66.70 | 100 | 0.50% | 42.55% |
| NBHC | National Bank | | Financials | 35.16 | 100 | 0.46% | -5.46% |
| EPC | Edgewell Personal | | Consumer Staples | 39.00 | 100 | 0.44% | 6.47% |
| ODC | Oil-Dri | | Materials | 80.83 | 100 | 0.43% | 20.50% |
| DHT | DHT | | Transports | 12.11 | 100 | 0.41% | 23.45% |
| CMCO | Columbus McKinnon | | Industrials | 44.07 | 100 | 0.36% | 12.94% |
| LYTS | LSI Industries | | Industrials | 15.92 | 100 | 0.32% | 13.07% |
| FIX | Comfort Systems | | Industrials | 346.84 | 100 | 0.18% | 68.64% |
| MWA | Mueller Water | | Industrials | 18.95 | 100 | 0.18% | 31.63% |
| For chart view version of above stock list: Chart View ➞ 0 - 25 , 25 - 50 , 50 - 75 , 75 - 100 , 100 - 125 , 125 - 150 , 150 - 175 , 175 - 200 , 200 - 225 , 225 - 250 , 250 - 275 , 275 - 300 , 300 - 325 , 325 - 350 , 350 - 375 , 375 - 400 , 400 - 425 , 425 - 450 , 450 - 475 , 475 - 500 , 500 - 525 , 525 - 550 , 550 - 575 , 575 - 600 , 600 - 625 , 625 - 650 , 650 - 675 , 675 - 700 , 700 - 725 , 725 - 750 , 750 - 775 , 775 - 800 , 800 - 825 , 825 - 850 , 850 - 875 , 875 - 900 , 900 - 925 , 925 - 950 , 950 - 975 , 975 - 1000 , 1000 - 1025 , 1025 - 1050 , 1050 - 1075 , 1075 - 1100 , 1100 - 1125 , 1125 - 1150 , 1150 - 1175 , 1175 - 1200 , 1200 - 1225 , 1225 - 1250 , 1250 - 1275 , 1275 - 1300 , 1300 - 1325 , 1325 - 1350 , 1350 - 1375 , 1375 - 1400 , 1400 - 1425 , 1425 - 1450 , 1450 - 1475 , 1475 - 1500 , 1500 - 1525 , 1525 - 1550 , 1550 - 1575 , 1575 - 1600 | ||
 | Click To Change The Sort Order: By Market Cap or Company Size Performance: Year-to-date, Week and Day |  |
| Too many stocks? View smallcap stocks filtered by marketcap & sector |
| Marketcap: All SmallCap Stocks (default-no microcap), Large, Mid-Range, Small |
| Smallcap Sector: Tech, Finance, Energy, Staples, Retail, Industrial, Materials, & Medical |
|
Get the most comprehensive stock market coverage daily at 12Stocks.com ➞ Best Stocks Today ➞ Best Stocks Weekly ➞ Best Stocks Year-to-Date ➞ Best Stocks Trends ➞  Best Stocks Today 12Stocks.com Best Nasdaq Stocks ➞ Best S&P 500 Stocks ➞ Best Tech Stocks ➞ Best Biotech Stocks ➞ |
| Detailed Overview of SmallCap Stocks |
| SmallCap Technical Overview, Leaders & Laggards, Top SmallCap ETF Funds & Detailed SmallCap Stocks List, Charts, Trends & More |
| Smallcap: Technical Analysis, Trends & YTD Performance | |
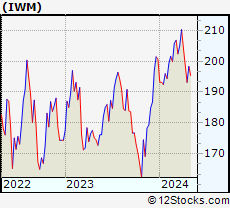
| SmallCap segment as represented by
IWM, an exchange-traded fund [ETF], holds basket of thousands of smallcap stocks from across all major sectors of the US stock market. The smallcap index (contains stocks like Riverbed & Sotheby's) is up by 2.2% and is currently underperforming the overall market by -6.34% year-to-date. Below is a quick view of technical charts and trends: | |
 IWM Weekly Chart |
|
| Long Term Trend: Very Good | |
| Medium Term Trend: Very Good | |
 IWM Daily Chart |
|
| Short Term Trend: Very Good | |
| Overall Trend Score: 75 | |
| YTD Performance: 2.2% | |
| **Trend Scores & Views Are Only For Educational Purposes And Not For Investing | |
| 12Stocks.com: Top Performing Small Cap Index Stocks | ||||||||||||||||||||||||||||||||||||||||||||||||
 The top performing Small Cap Index stocks year to date are
Now, more recently, over last week, the top performing Small Cap Index stocks on the move are


|
||||||||||||||||||||||||||||||||||||||||||||||||
| 12Stocks.com: Investing in Smallcap Index using Exchange Traded Funds | |
|
The following table shows list of key exchange traded funds (ETF) that
help investors track Smallcap index. The following list also includes leveraged ETF funds that track twice or thrice the daily returns of Smallcap indices. Short or inverse ETF funds move in the opposite direction to the index they track and are useful during market pullbacks or during bear markets. Quick View: Move mouse or cursor over ETF symbol (ticker) to view short-term technical chart and over ETF name to view long term chart. Click on ticker or stock name for detailed view. Click on to add stock symbol to your watchlist and to view watchlist. |
12Stocks.com List of ETFs that track Smallcap Index
| Ticker | ETF Name | Watchlist | Recent Price | Smart Investing & Trading Score | Change % | Week % | Year-to-date % |
| IWM | iShares Russell 2000 | | 205.13 | 75 | 0.66 | 1.6 | 2.2% |
| VTWO | Vanguard Russell 2000 ETF | | 82.92 | 70 | 0.64 | 1.61 | 2.25% |
| IJR | iShares Core S&P Small-Cap | | 108.51 | 88 | 0.23 | 1.28 | 0.24% |
| IJT | iShares S&P Small-Cap 600 Growth | | 129.77 | 83 | 0.60 | 1.57 | 3.7% |
| IJS | iShares S&P Small-Cap 600 Value | | 100.29 | 70 | 0.49 | 1.59 | -2.7% |
| IWN | iShares Russell 2000 Value | | 155.52 | 88 | 0.10 | 0.85 | 0.12% |
| IWO | iShares Russell 2000 Growth | | 259.67 | 45 | -0.17 | 1.09 | 2.95% |
| XSLV | PowerShares S&P SmallCap Low Volatil ETF | | 44.13 | 95 | 0.30 | 2.11 | -0.05% |
| SMLV | SPDR SSGA US Small Cap Low Volatil ETF | | 110.71 | 88 | 0.36 | 0.94 | -1.61% |
| SAA | ProShares Ultra SmallCap600 | | 24.25 | 83 | 0.18 | 2.8 | -2.81% |
| SDD | ProShares UltraShort SmallCap600 | | 18.34 | 28 | -1.71 | -2.68 | -0.47% |
| SBB | ProShares Short SmallCap600 | | 15.97 | 18 | -0.68 | -1.18 | 0.25% |
| 12Stocks.com: Charts, Trends, Fundamental Data and Performances of SmallCap Stocks | |
|
We now take in-depth look at all SmallCap stocks including charts, multi-period performances and overall trends (as measured by Smart Investing & Trading Score). One can sort SmallCap stocks (click link to choose) by Daily, Weekly and by Year-to-Date performances. Also, one can sort by size of the company or by market capitalization. |
| Select Your Default Chart Type: | |||||
| |||||
| Click on stock symbol or name for detailed view. Click on to add stock symbol to your watchlist and to view watchlist. Quick View: Move mouse or cursor over "Daily" to quickly view daily technical stock chart and over "Weekly" to view weekly technical stock chart. | |||||

 | AMCX AMC Networks Inc. |
| Sector: Services & Goods | |
| SubSector: Entertainment - Diversified | |
| MarketCap: 1477.37 Millions | |
| Recent Price: 13.38 Smart Investing & Trading Score: 100 | |
| Day Percent Change: 0.75% Day Change: 0.10 | |
| Week Change: 12.91% Year-to-date Change: -28.8% | |
| AMCX Links: Profile News Message Board | |
| Charts:- Daily , Weekly | |
| Add AMCX to Watchlist: View: Get Complete AMCX Trend Analysis ➞ | |
 | GATX GATX Corporation |
| Sector: Transports | |
| SubSector: Rental & Leasing Services | |
| MarketCap: 2080.34 Millions | |
| Recent Price: 132.47 Smart Investing & Trading Score: 100 | |
| Day Percent Change: 0.75% Day Change: 0.99 | |
| Week Change: 3.51% Year-to-date Change: 10.2% | |
| GATX Links: Profile News Message Board | |
| Charts:- Daily , Weekly | |
| Add GATX to Watchlist: View: Get Complete GATX Trend Analysis ➞ | |
 | UCTT Ultra Clean Holdings, Inc. |
| Sector: Technology | |
| SubSector: Semiconductor Equipment & Materials | |
| MarketCap: 528.518 Millions | |
| Recent Price: 44.10 Smart Investing & Trading Score: 100 | |
| Day Percent Change: 0.71% Day Change: 0.31 | |
| Week Change: 4.73% Year-to-date Change: 29.2% | |
| UCTT Links: Profile News Message Board | |
| Charts:- Daily , Weekly | |
| Add UCTT to Watchlist: View: Get Complete UCTT Trend Analysis ➞ | |
 | FBMS The First Bancshares, Inc. |
| Sector: Financials | |
| SubSector: Regional - Southeast Banks | |
| MarketCap: 359.535 Millions | |
| Recent Price: 25.41 Smart Investing & Trading Score: 100 | |
| Day Percent Change: 0.71% Day Change: 0.18 | |
| Week Change: 2.58% Year-to-date Change: -13.4% | |
| FBMS Links: Profile News Message Board | |
| Charts:- Daily , Weekly | |
| Add FBMS to Watchlist: View: Get Complete FBMS Trend Analysis ➞ | |
 | SFL SFL Corporation Ltd. |
| Sector: Transports | |
| SubSector: Shipping | |
| MarketCap: 890.414 Millions | |
| Recent Price: 14.13 Smart Investing & Trading Score: 100 | |
| Day Percent Change: 0.68% Day Change: 0.10 | |
| Week Change: 4.55% Year-to-date Change: 25.2% | |
| SFL Links: Profile News Message Board | |
| Charts:- Daily , Weekly | |
| Add SFL to Watchlist: View: Get Complete SFL Trend Analysis ➞ | |
 | MCY Mercury General Corporation |
| Sector: Financials | |
| SubSector: Property & Casualty Insurance | |
| MarketCap: 2122.12 Millions | |
| Recent Price: 57.24 Smart Investing & Trading Score: 100 | |
| Day Percent Change: 0.67% Day Change: 0.38 | |
| Week Change: 4.64% Year-to-date Change: 53.4% | |
| MCY Links: Profile News Message Board | |
| Charts:- Daily , Weekly | |
| Add MCY to Watchlist: View: Get Complete MCY Trend Analysis ➞ | |
 | FRME First Merchants Corporation |
| Sector: Financials | |
| SubSector: Regional - Midwest Banks | |
| MarketCap: 1490.4 Millions | |
| Recent Price: 35.88 Smart Investing & Trading Score: 100 | |
| Day Percent Change: 0.66% Day Change: 0.23 | |
| Week Change: 3.44% Year-to-date Change: -3.2% | |
| FRME Links: Profile News Message Board | |
| Charts:- Daily , Weekly | |
| Add FRME to Watchlist: View: Get Complete FRME Trend Analysis ➞ | |
 | SJW SJW Group |
| Sector: Utilities | |
| SubSector: Water Utilities | |
| MarketCap: 1571.62 Millions | |
| Recent Price: 57.04 Smart Investing & Trading Score: 100 | |
| Day Percent Change: 0.65% Day Change: 0.37 | |
| Week Change: 2.72% Year-to-date Change: -12.7% | |
| SJW Links: Profile News Message Board | |
| Charts:- Daily , Weekly | |
| Add SJW to Watchlist: View: Get Complete SJW Trend Analysis ➞ | |
 | SAFT Safety Insurance Group, Inc. |
| Sector: Financials | |
| SubSector: Property & Casualty Insurance | |
| MarketCap: 1145.12 Millions | |
| Recent Price: 82.80 Smart Investing & Trading Score: 100 | |
| Day Percent Change: 0.63% Day Change: 0.52 | |
| Week Change: 4.28% Year-to-date Change: 9.0% | |
| SAFT Links: Profile News Message Board | |
| Charts:- Daily , Weekly | |
| Add SAFT to Watchlist: View: Get Complete SAFT Trend Analysis ➞ | |
 | IRT Independence Realty Trust, Inc. |
| Sector: Financials | |
| SubSector: REIT - Residential | |
| MarketCap: 980.161 Millions | |
| Recent Price: 16.68 Smart Investing & Trading Score: 100 | |
| Day Percent Change: 0.60% Day Change: 0.10 | |
| Week Change: 2.14% Year-to-date Change: 9.0% | |
| IRT Links: Profile News Message Board | |
| Charts:- Daily , Weekly | |
| Add IRT to Watchlist: View: Get Complete IRT Trend Analysis ➞ | |
 | AAT American Assets Trust, Inc. |
| Sector: Financials | |
| SubSector: REIT - Retail | |
| MarketCap: 1580.54 Millions | |
| Recent Price: 22.21 Smart Investing & Trading Score: 100 | |
| Day Percent Change: 0.59% Day Change: 0.13 | |
| Week Change: 3.25% Year-to-date Change: -1.3% | |
| AAT Links: Profile News Message Board | |
| Charts:- Daily , Weekly | |
| Add AAT to Watchlist: View: Get Complete AAT Trend Analysis ➞ | |
 | OTTR Otter Tail Corporation |
| Sector: Utilities | |
| SubSector: Diversified Utilities | |
| MarketCap: 1728.2 Millions | |
| Recent Price: 93.26 Smart Investing & Trading Score: 100 | |
| Day Percent Change: 0.57% Day Change: 0.53 | |
| Week Change: 6.19% Year-to-date Change: 9.8% | |
| OTTR Links: Profile News Message Board | |
| Charts:- Daily , Weekly | |
| Add OTTR to Watchlist: View: Get Complete OTTR Trend Analysis ➞ | |
 | LBAI Lakeland Bancorp, Inc. |
| Sector: Financials | |
| SubSector: Regional - Northeast Banks | |
| MarketCap: 534.599 Millions | |
| Recent Price: 13.19 Smart Investing & Trading Score: 100 | |
| Day Percent Change: 0.53% Day Change: 0.07 | |
| Week Change: 1.93% Year-to-date Change: -10.8% | |
| LBAI Links: Profile News Message Board | |
| Charts:- Daily , Weekly | |
| Add LBAI to Watchlist: View: Get Complete LBAI Trend Analysis ➞ | |
 | KLIC Kulicke and Soffa Industries, Inc. |
| Sector: Technology | |
| SubSector: Semiconductor Equipment & Materials | |
| MarketCap: 1336.68 Millions | |
| Recent Price: 48.46 Smart Investing & Trading Score: 100 | |
| Day Percent Change: 0.52% Day Change: 0.25 | |
| Week Change: 3.11% Year-to-date Change: -11.4% | |
| KLIC Links: Profile News Message Board | |
| Charts:- Daily , Weekly | |
| Add KLIC to Watchlist: View: Get Complete KLIC Trend Analysis ➞ | |
 | FCF First Commonwealth Financial Corporation |
| Sector: Financials | |
| SubSector: Regional - Northeast Banks | |
| MarketCap: 900.299 Millions | |
| Recent Price: 13.92 Smart Investing & Trading Score: 100 | |
| Day Percent Change: 0.51% Day Change: 0.07 | |
| Week Change: 1.83% Year-to-date Change: -9.8% | |
| FCF Links: Profile News Message Board | |
| Charts:- Daily , Weekly | |
| Add FCF to Watchlist: View: Get Complete FCF Trend Analysis ➞ | |
 | INSW International Seaways, Inc. |
| Sector: Services & Goods | |
| SubSector: Business Services | |
| MarketCap: 521.582 Millions | |
| Recent Price: 61.60 Smart Investing & Trading Score: 100 | |
| Day Percent Change: 0.51% Day Change: 0.31 | |
| Week Change: 9.67% Year-to-date Change: 35.4% | |
| INSW Links: Profile News Message Board | |
| Charts:- Daily , Weekly | |
| Add INSW to Watchlist: View: Get Complete INSW Trend Analysis ➞ | |
 | AGX Argan, Inc. |
| Sector: Industrials | |
| SubSector: Heavy Construction | |
| MarketCap: 664.095 Millions | |
| Recent Price: 66.70 Smart Investing & Trading Score: 100 | |
| Day Percent Change: 0.50% Day Change: 0.33 | |
| Week Change: 9.63% Year-to-date Change: 42.6% | |
| AGX Links: Profile News Message Board | |
| Charts:- Daily , Weekly | |
| Add AGX to Watchlist: View: Get Complete AGX Trend Analysis ➞ | |
 | NBHC National Bank Holdings Corporation |
| Sector: Financials | |
| SubSector: Regional - Midwest Banks | |
| MarketCap: 766.87 Millions | |
| Recent Price: 35.16 Smart Investing & Trading Score: 100 | |
| Day Percent Change: 0.46% Day Change: 0.16 | |
| Week Change: 1.15% Year-to-date Change: -5.5% | |
| NBHC Links: Profile News Message Board | |
| Charts:- Daily , Weekly | |
| Add NBHC to Watchlist: View: Get Complete NBHC Trend Analysis ➞ | |
 | EPC Edgewell Personal Care Company |
| Sector: Consumer Staples | |
| SubSector: Personal Products | |
| MarketCap: 1605.95 Millions | |
| Recent Price: 39.00 Smart Investing & Trading Score: 100 | |
| Day Percent Change: 0.44% Day Change: 0.17 | |
| Week Change: 3.12% Year-to-date Change: 6.5% | |
| EPC Links: Profile News Message Board | |
| Charts:- Daily , Weekly | |
| Add EPC to Watchlist: View: Get Complete EPC Trend Analysis ➞ | |
 | ODC Oil-Dri Corporation of America |
| Sector: Materials | |
| SubSector: Specialty Chemicals | |
| MarketCap: 249.857 Millions | |
| Recent Price: 80.83 Smart Investing & Trading Score: 100 | |
| Day Percent Change: 0.43% Day Change: 0.34 | |
| Week Change: 5.22% Year-to-date Change: 20.5% | |
| ODC Links: Profile News Message Board | |
| Charts:- Daily , Weekly | |
| Add ODC to Watchlist: View: Get Complete ODC Trend Analysis ➞ | |
 | DHT DHT Holdings, Inc. |
| Sector: Transports | |
| SubSector: Shipping | |
| MarketCap: 754.514 Millions | |
| Recent Price: 12.11 Smart Investing & Trading Score: 100 | |
| Day Percent Change: 0.41% Day Change: 0.05 | |
| Week Change: 4.13% Year-to-date Change: 23.5% | |
| DHT Links: Profile News Message Board | |
| Charts:- Daily , Weekly | |
| Add DHT to Watchlist: View: Get Complete DHT Trend Analysis ➞ | |
 | CMCO Columbus McKinnon Corporation |
| Sector: Industrials | |
| SubSector: Farm & Construction Machinery | |
| MarketCap: 598.807 Millions | |
| Recent Price: 44.07 Smart Investing & Trading Score: 100 | |
| Day Percent Change: 0.36% Day Change: 0.16 | |
| Week Change: 3.55% Year-to-date Change: 12.9% | |
| CMCO Links: Profile News Message Board | |
| Charts:- Daily , Weekly | |
| Add CMCO to Watchlist: View: Get Complete CMCO Trend Analysis ➞ | |
 | LYTS LSI Industries Inc. |
| Sector: Industrials | |
| SubSector: Industrial Electrical Equipment | |
| MarketCap: 85.7879 Millions | |
| Recent Price: 15.92 Smart Investing & Trading Score: 100 | |
| Day Percent Change: 0.32% Day Change: 0.05 | |
| Week Change: 4.19% Year-to-date Change: 13.1% | |
| LYTS Links: Profile News Message Board | |
| Charts:- Daily , Weekly | |
| Add LYTS to Watchlist: View: Get Complete LYTS Trend Analysis ➞ | |
 | FIX Comfort Systems USA, Inc. |
| Sector: Industrials | |
| SubSector: General Contractors | |
| MarketCap: 1440.63 Millions | |
| Recent Price: 346.84 Smart Investing & Trading Score: 100 | |
| Day Percent Change: 0.18% Day Change: 0.63 | |
| Week Change: 10.1% Year-to-date Change: 68.6% | |
| FIX Links: Profile News Message Board | |
| Charts:- Daily , Weekly | |
| Add FIX to Watchlist: View: Get Complete FIX Trend Analysis ➞ | |
 | MWA Mueller Water Products, Inc. |
| Sector: Industrials | |
| SubSector: Industrial Equipment & Components | |
| MarketCap: 1321.09 Millions | |
| Recent Price: 18.95 Smart Investing & Trading Score: 100 | |
| Day Percent Change: 0.18% Day Change: 0.03 | |
| Week Change: 16.79% Year-to-date Change: 31.6% | |
| MWA Links: Profile News Message Board | |
| Charts:- Daily , Weekly | |
| Add MWA to Watchlist: View: Get Complete MWA Trend Analysis ➞ | |
| For tabular summary view of above stock list: Summary View ➞ 0 - 25 , 25 - 50 , 50 - 75 , 75 - 100 , 100 - 125 , 125 - 150 , 150 - 175 , 175 - 200 , 200 - 225 , 225 - 250 , 250 - 275 , 275 - 300 , 300 - 325 , 325 - 350 , 350 - 375 , 375 - 400 , 400 - 425 , 425 - 450 , 450 - 475 , 475 - 500 , 500 - 525 , 525 - 550 , 550 - 575 , 575 - 600 , 600 - 625 , 625 - 650 , 650 - 675 , 675 - 700 , 700 - 725 , 725 - 750 , 750 - 775 , 775 - 800 , 800 - 825 , 825 - 850 , 850 - 875 , 875 - 900 , 900 - 925 , 925 - 950 , 950 - 975 , 975 - 1000 , 1000 - 1025 , 1025 - 1050 , 1050 - 1075 , 1075 - 1100 , 1100 - 1125 , 1125 - 1150 , 1150 - 1175 , 1175 - 1200 , 1200 - 1225 , 1225 - 1250 , 1250 - 1275 , 1275 - 1300 , 1300 - 1325 , 1325 - 1350 , 1350 - 1375 , 1375 - 1400 , 1400 - 1425 , 1425 - 1450 , 1450 - 1475 , 1475 - 1500 , 1500 - 1525 , 1525 - 1550 , 1550 - 1575 , 1575 - 1600 | ||
| Click To Change The Sort Order: By Market Cap or Company Size Performance: Year-to-date, Week and Day | |
| Select Chart Type: | ||
| Too many stocks? View smallcap stocks filtered by marketcap & sector |
| Marketcap: All SmallCap Stocks (default-no microcap), Large, Mid-Range, Small & MicroCap |
| Sector: Tech, Finance, Energy, Staples, Retail, Industrial, Materials, Utilities & Medical |
|
Best Stocks Today 12Stocks.com |
© 2024 12Stocks.com Terms & Conditions Privacy Contact Us
All Information Provided Only For Education And Not To Be Used For Investing or Trading. See Terms & Conditions


One More Thing ... Get Best Stocks Delivered Daily!
Never Ever Miss A Move With Our Top Ten Stocks Lists
Find Best Stocks In Any Market - Bull or Bear Market
Take A Peek At Our Top Ten Stocks Lists: Daily, Weekly, Year-to-Date & Top Trends
Find Best Stocks In Any Market - Bull or Bear Market
Take A Peek At Our Top Ten Stocks Lists: Daily, Weekly, Year-to-Date & Top Trends
Smallcap Stocks With Best Up Trends [0-bearish to 100-bullish]: Consensus Cloud[100], PlayAGS [100], SiTime [100], Vital Farms[100], Blue Bird[100], BRC [100], Bakkt [100], Warby Parker[100], Red Violet[100], CommScope Holding[100], Mayville Engineering[100]
Best Smallcap Stocks Year-to-Date:
CareMax [586.6%], Janux [383.62%], Bakkt [376.68%], Viking [324.93%], Longboard [259.9%], Alpine Immune[239.94%], Avidity Biosciences[194.91%], Vera [185.98%], Super Micro[185.58%], Cullinan Oncology[176.56%], Arcutis Bio[155.26%] Best Smallcap Stocks This Week:
DASAN Zhone[69.48%], Innodata [65.7%], Bakkt [59.13%], Perficient [52.79%], Consensus Cloud[45.75%], Embecta [38.35%], Latham Group[37.73%], BRC [36.67%], PlayAGS [36.6%], SiTime [35.42%], Vigil Neuroscience[34.93%] Best Smallcap Stocks Daily:
Embecta [38.22%], Consensus Cloud[36.89%], PlayAGS [29.48%], SiTime [28.79%], Seres [26.69%], Vital Farms[25.88%], Blue Bird[25.41%], BRC [23.36%], Bakkt [20.93%], Noodles & [20.81%], bluebird bio[18.00%]