
 Login Sign Up


| |||||
 |  | ||||

| 12Stocks.com Market Intelligence |
Best SmallCap Stocks
|
| In a hurry? Small Cap Stock Lists: Performance Trends Table, Stock Charts
Sort Small Cap stocks: Daily, Weekly, Year-to-Date, Market Cap & Trends. Filter Small Cap stocks list by sector: Show all, Tech, Finance, Energy, Staples, Retail, Industrial, Materials, Utilities and HealthCare Filter Small Cap stocks list by size: All Large Medium Small and MicroCap |
| 12Stocks.com Small Cap Stocks Performances & Trends Daily | |||||||||
|
|  The overall Smart Investing & Trading Score is 23 (0-bearish to 100-bullish) which puts Small Cap index in short term bearish to neutral trend. The Smart Investing & Trading Score from previous trading session is 13 and hence an improvement of trend.
| ||||||||
Here are the Smart Investing & Trading Scores of the most requested small cap stocks at 12Stocks.com (click stock name for detailed review):
|


| 12Stocks.com: Investing in Smallcap Index with Stocks | |
|
The following table helps investors and traders sort through current performance and trends (as measured by Smart Investing & Trading Score) of various
stocks in the Smallcap Index. Quick View: Move mouse or cursor over stock symbol (ticker) to view short-term technical chart and over stock name to view long term chart. Click on  to add stock symbol to your watchlist and to add stock symbol to your watchlist and  to view watchlist. Click on any ticker or stock name for detailed market intelligence report for that stock. to view watchlist. Click on any ticker or stock name for detailed market intelligence report for that stock. |
12Stocks.com Performance of Stocks in Smallcap Index
| Ticker | Stock Name | Watchlist | Category | Recent Price | Smart Investing & Trading Score | Change % | YTD Change% |
| CHGG | Chegg |   | Services & Goods | 7.02 | 22 | 1.74% | -38.20% |
| VMEO | Vimeo | | Technology | 3.58 | 22 | 1.42% | -8.92% |
| WD | Walker & Dunlop | | Financials | 92.04 | 22 | 1.24% | -17.09% |
| PL | Planet Labs | | Industrials | 1.76 | 22 | 0.86% | -28.83% |
| UBSI | United Bankshares | | Financials | 32.82 | 22 | 0.77% | -12.60% |
| AMLX | Amylyx | | Health Care | 2.00 | 22 | 0.50% | -86.17% |
| HPP | Hudson Pacific | | Financials | 5.81 | 22 | 0.35% | -37.59% |
| AAN | Aaron s | | Transports | 7.11 | 22 | 0.28% | -34.65% |
| FIGS | FIGS | | Services & Goods | 4.72 | 22 | 0.21% | -33.80% |
| RILY | B. Riley | | Financials | 20.50 | 22 | 0.20% | -2.33% |
| BOOM | DMC Global | | Industrials | 16.70 | 22 | 0.15% | -11.24% |
| MDXG | MiMedx Group | | Health Care | 6.33 | 22 | 0.00% | -27.82% |
| CDNA | CareDx | | Services & Goods | 8.28 | 22 | -0.06% | -31.04% |
| ZEUS | Olympic Steel | | Materials | 67.71 | 21 | -0.31% | 1.51% |
| TPH | TRI Pointe | | Industrials | 35.29 | 20 | 2.26% | -0.31% |
| EVH | Evolent Health | | Technology | 30.13 | 20 | 1.65% | -8.78% |
| TDS | Telephone and | | Technology | 15.19 | 20 | 1.54% | -17.22% |
| CIO | City Office | | Financials | 4.45 | 20 | 1.48% | -27.25% |
| TTEC | TTEC | | Technology | 7.99 | 20 | 1.27% | -63.13% |
| GNL | Global Net | | Financials | 6.66 | 20 | 1.14% | -33.12% |
| NBR | Nabors Industries | | Energy | 75.90 | 20 | 1.07% | -7.02% |
| VC | Visteon | | Consumer Staples | 107.83 | 20 | 0.93% | -13.67% |
| DYN | Dyne | | Health Care | 25.02 | 20 | 0.83% | 88.16% |
| OFIX | Orthofix Medical | | Health Care | 13.08 | 20 | 0.62% | -2.97% |
| TTGT | TechTarget | | Technology | 27.60 | 20 | 0.62% | -20.83% |
| For chart view version of above stock list: Chart View ➞ 0 - 25 , 25 - 50 , 50 - 75 , 75 - 100 , 100 - 125 , 125 - 150 , 150 - 175 , 175 - 200 , 200 - 225 , 225 - 250 , 250 - 275 , 275 - 300 , 300 - 325 , 325 - 350 , 350 - 375 , 375 - 400 , 400 - 425 , 425 - 450 , 450 - 475 , 475 - 500 , 500 - 525 , 525 - 550 , 550 - 575 , 575 - 600 , 600 - 625 , 625 - 650 , 650 - 675 , 675 - 700 , 700 - 725 , 725 - 750 , 750 - 775 , 775 - 800 , 800 - 825 , 825 - 850 , 850 - 875 , 875 - 900 , 900 - 925 , 925 - 950 , 950 - 975 , 975 - 1000 , 1000 - 1025 , 1025 - 1050 , 1050 - 1075 , 1075 - 1100 , 1100 - 1125 , 1125 - 1150 , 1150 - 1175 , 1175 - 1200 , 1200 - 1225 , 1225 - 1250 , 1250 - 1275 , 1275 - 1300 , 1300 - 1325 , 1325 - 1350 , 1350 - 1375 , 1375 - 1400 , 1400 - 1425 , 1425 - 1450 , 1450 - 1475 | ||
 | Click To Change The Sort Order: By Market Cap or Company Size Performance: Year-to-date, Week and Day |  |
| Too many stocks? View smallcap stocks filtered by marketcap & sector |
| Marketcap: All SmallCap Stocks (default-no microcap), Large, Mid-Range, Small |
| Smallcap Sector: Tech, Finance, Energy, Staples, Retail, Industrial, Materials, & Medical |
|
Get the most comprehensive stock market coverage daily at 12Stocks.com ➞ Best Stocks Today ➞ Best Stocks Weekly ➞ Best Stocks Year-to-Date ➞ Best Stocks Trends ➞  Best Stocks Today 12Stocks.com Best Nasdaq Stocks ➞ Best S&P 500 Stocks ➞ Best Tech Stocks ➞ Best Biotech Stocks ➞ |
| Detailed Overview of SmallCap Stocks |
| SmallCap Technical Overview, Leaders & Laggards, Top SmallCap ETF Funds & Detailed SmallCap Stocks List, Charts, Trends & More |
| Smallcap: Technical Analysis, Trends & YTD Performance | |
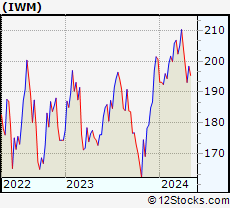
| SmallCap segment as represented by
IWM, an exchange-traded fund [ETF], holds basket of thousands of smallcap stocks from across all major sectors of the US stock market. The smallcap index (contains stocks like Riverbed & Sotheby's) is down by -3.56% and is currently underperforming the overall market by -8.11% year-to-date. Below is a quick view of technical charts and trends: | |
 IWM Weekly Chart |
|
| Long Term Trend: Good | |
| Medium Term Trend: Not Good | |
 IWM Daily Chart |
|
| Short Term Trend: Deteriorating | |
| Overall Trend Score: 23 | |
| YTD Performance: -3.56% | |
| **Trend Scores & Views Are Only For Educational Purposes And Not For Investing | |
| 12Stocks.com: Top Performing Small Cap Index Stocks | ||||||||||||||||||||||||||||||||||||||||||||||||
 The top performing Small Cap Index stocks year to date are
Now, more recently, over last week, the top performing Small Cap Index stocks on the move are


|
||||||||||||||||||||||||||||||||||||||||||||||||
| 12Stocks.com: Investing in Smallcap Index using Exchange Traded Funds | |
|
The following table shows list of key exchange traded funds (ETF) that
help investors track Smallcap index. The following list also includes leveraged ETF funds that track twice or thrice the daily returns of Smallcap indices. Short or inverse ETF funds move in the opposite direction to the index they track and are useful during market pullbacks or during bear markets. Quick View: Move mouse or cursor over ETF symbol (ticker) to view short-term technical chart and over ETF name to view long term chart. Click on ticker or stock name for detailed view. Click on to add stock symbol to your watchlist and to view watchlist. |
12Stocks.com List of ETFs that track Smallcap Index
| Ticker | ETF Name | Watchlist | Recent Price | Smart Investing & Trading Score | Change % | Week % | Year-to-date % |
| IWM | iShares Russell 2000 | | 193.56 | 23 | 0.29 | -2.58 | -3.56% |
| IJR | iShares Core S&P Small-Cap | | 102.65 | 7 | 0.51 | -1.78 | -5.17% |
| IWN | iShares Russell 2000 Value | | 146.73 | 0 | 0.48 | -2.43 | -5.54% |
| IWO | iShares Russell 2000 Growth | | 248.39 | 26 | 0.15 | -2.73 | -1.52% |
| IJS | iShares S&P Small-Cap 600 Value | | 94.21 | 0 | 0.10 | -2.04 | -8.6% |
| XSLV | PowerShares S&P SmallCap Low Volatil ETF | | 41.58 | 0 | 0.39 | -1.21 | -5.82% |
| 12Stocks.com: Charts, Trends, Fundamental Data and Performances of SmallCap Stocks | |
|
We now take in-depth look at all SmallCap stocks including charts, multi-period performances and overall trends (as measured by Smart Investing & Trading Score). One can sort SmallCap stocks (click link to choose) by Daily, Weekly and by Year-to-Date performances. Also, one can sort by size of the company or by market capitalization. |
| Select Your Default Chart Type: | |||||
| |||||
| Click on stock symbol or name for detailed view. Click on to add stock symbol to your watchlist and to view watchlist. Quick View: Move mouse or cursor over "Daily" to quickly view daily technical stock chart and over "Weekly" to view weekly technical stock chart. | |||||

 | CHGG Chegg, Inc. |
| Sector: Services & Goods | |
| SubSector: Education & Training Services | |
| MarketCap: 3606.86 Millions | |
| Recent Price: 7.02 Smart Investing & Trading Score: 22 | |
| Day Percent Change: 1.74% Day Change: 0.12 | |
| Week Change: -1.82% Year-to-date Change: -38.2% | |
| CHGG Links: Profile News Message Board | |
| Charts:- Daily , Weekly | |
| Add CHGG to Watchlist: View: Get Complete CHGG Trend Analysis ➞ | |
 | VMEO Vimeo, Inc. |
| Sector: Technology | |
| SubSector: Software - Application | |
| MarketCap: 678 Millions | |
| Recent Price: 3.58 Smart Investing & Trading Score: 22 | |
| Day Percent Change: 1.42% Day Change: 0.05 | |
| Week Change: -0.97% Year-to-date Change: -8.9% | |
| VMEO Links: Profile News Message Board | |
| Charts:- Daily , Weekly | |
| Add VMEO to Watchlist: View: Get Complete VMEO Trend Analysis ➞ | |
 | WD Walker & Dunlop, Inc. |
| Sector: Financials | |
| SubSector: Mortgage Investment | |
| MarketCap: 1312.99 Millions | |
| Recent Price: 92.04 Smart Investing & Trading Score: 22 | |
| Day Percent Change: 1.24% Day Change: 1.13 | |
| Week Change: 1.22% Year-to-date Change: -17.1% | |
| WD Links: Profile News Message Board | |
| Charts:- Daily , Weekly | |
| Add WD to Watchlist: View: Get Complete WD Trend Analysis ➞ | |
 | PL Planet Labs PBC |
| Sector: Industrials | |
| SubSector: Aerospace & Defense | |
| MarketCap: 874 Millions | |
| Recent Price: 1.76 Smart Investing & Trading Score: 22 | |
| Day Percent Change: 0.86% Day Change: 0.01 | |
| Week Change: -12.19% Year-to-date Change: -28.8% | |
| PL Links: Profile News Message Board | |
| Charts:- Daily , Weekly | |
| Add PL to Watchlist: View: Get Complete PL Trend Analysis ➞ | |
 | UBSI United Bankshares, Inc. |
| Sector: Financials | |
| SubSector: Regional - Mid-Atlantic Banks | |
| MarketCap: 2286.79 Millions | |
| Recent Price: 32.82 Smart Investing & Trading Score: 22 | |
| Day Percent Change: 0.77% Day Change: 0.25 | |
| Week Change: -0.91% Year-to-date Change: -12.6% | |
| UBSI Links: Profile News Message Board | |
| Charts:- Daily , Weekly | |
| Add UBSI to Watchlist: View: Get Complete UBSI Trend Analysis ➞ | |
 | AMLX Amylyx Pharmaceuticals, Inc. |
| Sector: Health Care | |
| SubSector: Biotechnology | |
| MarketCap: 1500 Millions | |
| Recent Price: 2.00 Smart Investing & Trading Score: 22 | |
| Day Percent Change: 0.50% Day Change: 0.01 | |
| Week Change: -4.76% Year-to-date Change: -86.2% | |
| AMLX Links: Profile News Message Board | |
| Charts:- Daily , Weekly | |
| Add AMLX to Watchlist: View: Get Complete AMLX Trend Analysis ➞ | |
 | HPP Hudson Pacific Properties, Inc. |
| Sector: Financials | |
| SubSector: REIT - Office | |
| MarketCap: 3267.16 Millions | |
| Recent Price: 5.81 Smart Investing & Trading Score: 22 | |
| Day Percent Change: 0.35% Day Change: 0.02 | |
| Week Change: -5.07% Year-to-date Change: -37.6% | |
| HPP Links: Profile News Message Board | |
| Charts:- Daily , Weekly | |
| Add HPP to Watchlist: View: Get Complete HPP Trend Analysis ➞ | |
 | AAN Aaron s, Inc. |
| Sector: Transports | |
| SubSector: Rental & Leasing Services | |
| MarketCap: 1087.04 Millions | |
| Recent Price: 7.11 Smart Investing & Trading Score: 22 | |
| Day Percent Change: 0.28% Day Change: 0.02 | |
| Week Change: -0.7% Year-to-date Change: -34.7% | |
| AAN Links: Profile News Message Board | |
| Charts:- Daily , Weekly | |
| Add AAN to Watchlist: View: Get Complete AAN Trend Analysis ➞ | |
 | FIGS FIGS, Inc. |
| Sector: Services & Goods | |
| SubSector: Apparel Manufacturing | |
| MarketCap: 1370 Millions | |
| Recent Price: 4.72 Smart Investing & Trading Score: 22 | |
| Day Percent Change: 0.21% Day Change: 0.01 | |
| Week Change: -4.45% Year-to-date Change: -33.8% | |
| FIGS Links: Profile News Message Board | |
| Charts:- Daily , Weekly | |
| Add FIGS to Watchlist: View: Get Complete FIGS Trend Analysis ➞ | |
 | RILY B. Riley Financial, Inc. |
| Sector: Financials | |
| SubSector: Asset Management | |
| MarketCap: 443.703 Millions | |
| Recent Price: 20.50 Smart Investing & Trading Score: 22 | |
| Day Percent Change: 0.20% Day Change: 0.04 | |
| Week Change: -3.62% Year-to-date Change: -2.3% | |
| RILY Links: Profile News Message Board | |
| Charts:- Daily , Weekly | |
| Add RILY to Watchlist: View: Get Complete RILY Trend Analysis ➞ | |
 | BOOM DMC Global Inc. |
| Sector: Industrials | |
| SubSector: Metal Fabrication | |
| MarketCap: 359.15 Millions | |
| Recent Price: 16.70 Smart Investing & Trading Score: 22 | |
| Day Percent Change: 0.15% Day Change: 0.02 | |
| Week Change: -4.71% Year-to-date Change: -11.2% | |
| BOOM Links: Profile News Message Board | |
| Charts:- Daily , Weekly | |
| Add BOOM to Watchlist: View: Get Complete BOOM Trend Analysis ➞ | |
 | MDXG MiMedx Group, Inc. |
| Sector: Health Care | |
| SubSector: Medical Appliances & Equipment | |
| MarketCap: 371.08 Millions | |
| Recent Price: 6.33 Smart Investing & Trading Score: 22 | |
| Day Percent Change: 0.00% Day Change: 0.00 | |
| Week Change: -1.71% Year-to-date Change: -27.8% | |
| MDXG Links: Profile News Message Board | |
| Charts:- Daily , Weekly | |
| Add MDXG to Watchlist: View: Get Complete MDXG Trend Analysis ➞ | |
 | CDNA CareDx, Inc |
| Sector: Services & Goods | |
| SubSector: Research Services | |
| MarketCap: 828.194 Millions | |
| Recent Price: 8.28 Smart Investing & Trading Score: 22 | |
| Day Percent Change: -0.06% Day Change: 0.00 | |
| Week Change: -2.99% Year-to-date Change: -31.0% | |
| CDNA Links: Profile News Message Board | |
| Charts:- Daily , Weekly | |
| Add CDNA to Watchlist: View: Get Complete CDNA Trend Analysis ➞ | |
 | ZEUS Olympic Steel, Inc. |
| Sector: Materials | |
| SubSector: Steel & Iron | |
| MarketCap: 118.888 Millions | |
| Recent Price: 67.71 Smart Investing & Trading Score: 21 | |
| Day Percent Change: -0.31% Day Change: -0.21 | |
| Week Change: -0.79% Year-to-date Change: 1.5% | |
| ZEUS Links: Profile News Message Board | |
| Charts:- Daily , Weekly | |
| Add ZEUS to Watchlist: View: Get Complete ZEUS Trend Analysis ➞ | |
 | TPH TRI Pointe Group, Inc. |
| Sector: Industrials | |
| SubSector: Residential Construction | |
| MarketCap: 1140.06 Millions | |
| Recent Price: 35.29 Smart Investing & Trading Score: 20 | |
| Day Percent Change: 2.26% Day Change: 0.78 | |
| Week Change: -2.86% Year-to-date Change: -0.3% | |
| TPH Links: Profile News Message Board | |
| Charts:- Daily , Weekly | |
| Add TPH to Watchlist: View: Get Complete TPH Trend Analysis ➞ | |
 | EVH Evolent Health, Inc. |
| Sector: Technology | |
| SubSector: Healthcare Information Services | |
| MarketCap: 486.755 Millions | |
| Recent Price: 30.13 Smart Investing & Trading Score: 20 | |
| Day Percent Change: 1.65% Day Change: 0.49 | |
| Week Change: 0% Year-to-date Change: -8.8% | |
| EVH Links: Profile News Message Board | |
| Charts:- Daily , Weekly | |
| Add EVH to Watchlist: View: Get Complete EVH Trend Analysis ➞ | |
 | TDS Telephone and Data Systems, Inc. |
| Sector: Technology | |
| SubSector: Wireless Communications | |
| MarketCap: 1851.87 Millions | |
| Recent Price: 15.19 Smart Investing & Trading Score: 20 | |
| Day Percent Change: 1.54% Day Change: 0.23 | |
| Week Change: -2.94% Year-to-date Change: -17.2% | |
| TDS Links: Profile News Message Board | |
| Charts:- Daily , Weekly | |
| Add TDS to Watchlist: View: Get Complete TDS Trend Analysis ➞ | |
 | CIO City Office REIT, Inc. |
| Sector: Financials | |
| SubSector: REIT - Office | |
| MarketCap: 478.566 Millions | |
| Recent Price: 4.45 Smart Investing & Trading Score: 20 | |
| Day Percent Change: 1.48% Day Change: 0.07 | |
| Week Change: -1.22% Year-to-date Change: -27.3% | |
| CIO Links: Profile News Message Board | |
| Charts:- Daily , Weekly | |
| Add CIO to Watchlist: View: Get Complete CIO Trend Analysis ➞ | |
 | TTEC TTEC Holdings, Inc. |
| Sector: Technology | |
| SubSector: Information Technology Services | |
| MarketCap: 1528.48 Millions | |
| Recent Price: 7.99 Smart Investing & Trading Score: 20 | |
| Day Percent Change: 1.27% Day Change: 0.10 | |
| Week Change: -2.8% Year-to-date Change: -63.1% | |
| TTEC Links: Profile News Message Board | |
| Charts:- Daily , Weekly | |
| Add TTEC to Watchlist: View: Get Complete TTEC Trend Analysis ➞ | |
 | GNL Global Net Lease, Inc. |
| Sector: Financials | |
| SubSector: REIT - Diversified | |
| MarketCap: 1362.73 Millions | |
| Recent Price: 6.66 Smart Investing & Trading Score: 20 | |
| Day Percent Change: 1.14% Day Change: 0.08 | |
| Week Change: -1.84% Year-to-date Change: -33.1% | |
| GNL Links: Profile News Message Board | |
| Charts:- Daily , Weekly | |
| Add GNL to Watchlist: View: Get Complete GNL Trend Analysis ➞ | |
 | NBR Nabors Industries Ltd. |
| Sector: Energy | |
| SubSector: Oil & Gas Drilling & Exploration | |
| MarketCap: 240.539 Millions | |
| Recent Price: 75.90 Smart Investing & Trading Score: 20 | |
| Day Percent Change: 1.07% Day Change: 0.80 | |
| Week Change: -4.4% Year-to-date Change: -7.0% | |
| NBR Links: Profile News Message Board | |
| Charts:- Daily , Weekly | |
| Add NBR to Watchlist: View: Get Complete NBR Trend Analysis ➞ | |
 | VC Visteon Corporation |
| Sector: Consumer Staples | |
| SubSector: Auto Parts | |
| MarketCap: 1441.49 Millions | |
| Recent Price: 107.83 Smart Investing & Trading Score: 20 | |
| Day Percent Change: 0.93% Day Change: 1.00 | |
| Week Change: -0.96% Year-to-date Change: -13.7% | |
| VC Links: Profile News Message Board | |
| Charts:- Daily , Weekly | |
| Add VC to Watchlist: View: Get Complete VC Trend Analysis ➞ | |
 | DYN Dyne Therapeutics, Inc. |
| Sector: Health Care | |
| SubSector: Biotechnology | |
| MarketCap: 88487 Millions | |
| Recent Price: 25.02 Smart Investing & Trading Score: 20 | |
| Day Percent Change: 0.83% Day Change: 0.20 | |
| Week Change: -3.19% Year-to-date Change: 88.2% | |
| DYN Links: Profile News Message Board | |
| Charts:- Daily , Weekly | |
| Add DYN to Watchlist: View: Get Complete DYN Trend Analysis ➞ | |
 | OFIX Orthofix Medical Inc. |
| Sector: Health Care | |
| SubSector: Medical Appliances & Equipment | |
| MarketCap: 508.18 Millions | |
| Recent Price: 13.08 Smart Investing & Trading Score: 20 | |
| Day Percent Change: 0.62% Day Change: 0.08 | |
| Week Change: -1.8% Year-to-date Change: -3.0% | |
| OFIX Links: Profile News Message Board | |
| Charts:- Daily , Weekly | |
| Add OFIX to Watchlist: View: Get Complete OFIX Trend Analysis ➞ | |
 | TTGT TechTarget, Inc. |
| Sector: Technology | |
| SubSector: Internet Information Providers | |
| MarketCap: 560.78 Millions | |
| Recent Price: 27.60 Smart Investing & Trading Score: 20 | |
| Day Percent Change: 0.62% Day Change: 0.17 | |
| Week Change: -1.04% Year-to-date Change: -20.8% | |
| TTGT Links: Profile News Message Board | |
| Charts:- Daily , Weekly | |
| Add TTGT to Watchlist: View: Get Complete TTGT Trend Analysis ➞ | |
| For tabular summary view of above stock list: Summary View ➞ 0 - 25 , 25 - 50 , 50 - 75 , 75 - 100 , 100 - 125 , 125 - 150 , 150 - 175 , 175 - 200 , 200 - 225 , 225 - 250 , 250 - 275 , 275 - 300 , 300 - 325 , 325 - 350 , 350 - 375 , 375 - 400 , 400 - 425 , 425 - 450 , 450 - 475 , 475 - 500 , 500 - 525 , 525 - 550 , 550 - 575 , 575 - 600 , 600 - 625 , 625 - 650 , 650 - 675 , 675 - 700 , 700 - 725 , 725 - 750 , 750 - 775 , 775 - 800 , 800 - 825 , 825 - 850 , 850 - 875 , 875 - 900 , 900 - 925 , 925 - 950 , 950 - 975 , 975 - 1000 , 1000 - 1025 , 1025 - 1050 , 1050 - 1075 , 1075 - 1100 , 1100 - 1125 , 1125 - 1150 , 1150 - 1175 , 1175 - 1200 , 1200 - 1225 , 1225 - 1250 , 1250 - 1275 , 1275 - 1300 , 1300 - 1325 , 1325 - 1350 , 1350 - 1375 , 1375 - 1400 , 1400 - 1425 , 1425 - 1450 , 1450 - 1475 | ||
| Click To Change The Sort Order: By Market Cap or Company Size Performance: Year-to-date, Week and Day | |
| Select Chart Type: | ||
| Too many stocks? View smallcap stocks filtered by marketcap & sector |
| Marketcap: All SmallCap Stocks (default-no microcap), Large, Mid-Range, Small & MicroCap |
| Sector: Tech, Finance, Energy, Staples, Retail, Industrial, Materials, Utilities & Medical |
|
Best Stocks Today 12Stocks.com |
© 2024 12Stocks.com Terms & Conditions Privacy Contact Us
All Information Provided Only For Education And Not To Be Used For Investing or Trading. See Terms & Conditions


One More Thing ... Get Best Stocks Delivered Daily!
Never Ever Miss A Move With Our Top Ten Stocks Lists
Find Best Stocks In Any Market - Bull or Bear Market
Take A Peek At Our Top Ten Stocks Lists: Daily, Weekly, Year-to-Date & Top Trends
Find Best Stocks In Any Market - Bull or Bear Market
Take A Peek At Our Top Ten Stocks Lists: Daily, Weekly, Year-to-Date & Top Trends
Smallcap Stocks With Best Up Trends [0-bearish to 100-bullish]: Oscar Health[100], Envestnet [100], IMAX [100], PrimeEnergy Resources[100], ALX Oncology[100], Vanda [100], Macatawa Bank[93], Encore Wire[93], Snap One[93], Willis Lease[93], Intra-Cellular Therapies[93]
Best Smallcap Stocks Year-to-Date:
CareMax [417.53%], Janux [344.67%], Viking [250.51%], Alpine Immune[238.58%], Super Micro[232.34%], Longboard [171.69%], Avidity Biosciences[157.3%], Vera [153.59%], Hippo [124.26%], Verde Clean[112.02%], Veritone [111.54%] Best Smallcap Stocks This Week:
Macatawa Bank[42.96%], Snap One[29.73%], ProKidney [26.57%], Vertex Energy[22.6%], Vanda [22.33%], ALX Oncology[20.11%], Cullinan Oncology[13.98%], Expensify [12.93%], Children s[11.86%], Citius [11.75%], Humacyte [11.46%] Best Smallcap Stocks Daily:
23andMe Holding[37.10%], Vertex Energy[30.21%], Zura Bio[12.58%], Badger Meter[10.35%], Expensify [9.93%], Apogee Enterprises[8.74%], Barnes Group[8.15%], Citius [7.87%], Tellurian [7.58%], Duolingo [7.23%], Cullinan Oncology[6.50%]