
 Login Sign Up


| |||||
 |  | ||||

| 12Stocks.com Market Intelligence |
Best SmallCap Stocks
|
| In a hurry? Small Cap Stock Lists: Performance Trends Table, Stock Charts
Sort Small Cap stocks: Daily, Weekly, Year-to-Date, Market Cap & Trends. Filter Small Cap stocks list by sector: Show all, Tech, Finance, Energy, Staples, Retail, Industrial, Materials, Utilities and HealthCare Filter Small Cap stocks list by size: All Large Medium Small and MicroCap |
| 12Stocks.com Small Cap Stocks Performances & Trends Daily | |||||||||
|
|  The overall Smart Investing & Trading Score is 31 (0-bearish to 100-bullish) which puts Small Cap index in short term bearish to neutral trend. The Smart Investing & Trading Score from previous trading session is 58 and hence a deterioration of trend.
| ||||||||
Here are the Smart Investing & Trading Scores of the most requested small cap stocks at 12Stocks.com (click stock name for detailed review):
|


| 12Stocks.com: Investing in Smallcap Index with Stocks | |
|
The following table helps investors and traders sort through current performance and trends (as measured by Smart Investing & Trading Score) of various
stocks in the Smallcap Index. Quick View: Move mouse or cursor over stock symbol (ticker) to view short-term technical chart and over stock name to view long term chart. Click on  to add stock symbol to your watchlist and to add stock symbol to your watchlist and  to view watchlist. Click on any ticker or stock name for detailed market intelligence report for that stock. to view watchlist. Click on any ticker or stock name for detailed market intelligence report for that stock. |
12Stocks.com Performance of Stocks in Smallcap Index
| Ticker | Stock Name | Watchlist | Category | Recent Price | Smart Investing & Trading Score | Change % | YTD Change% |
| EHTH | eHealth |   | Financials | 4.42 | 35 | -2.32% | -49.37% |
| BIPC | Brookfield Infrastructure | | Utilities | 31.19 | 35 | -1.86% | -11.59% |
| TIPT | Tiptree | | Financials | 16.03 | 35 | -1.84% | -15.45% |
| MBWM | Mercantile Bank | | Financials | 36.37 | 35 | -1.42% | -9.94% |
| PLOW | Douglas Dynamics | | Consumer Staples | 22.10 | 35 | -1.22% | -25.55% |
| CBNK | Capital Bancorp | | Financials | 19.27 | 35 | -1.18% | -20.37% |
| RC | Ready Capital | | Financials | 8.72 | 35 | -1.08% | -14.88% |
| BUSE | First Busey | | Financials | 23.11 | 35 | -0.04% | -6.89% |
| HAFC | Hanmi Financial | | Financials | 15.72 | 34 | 3.83% | -18.97% |
| ATGE | Adtalem Global | | Services & Goods | 47.63 | 34 | 0.90% | -19.19% |
| NRIM | Northrim BanCorp | | Financials | 47.35 | 34 | 0.81% | -17.23% |
| SSBK | Southern States | | Financials | 24.18 | 34 | 0.75% | -17.87% |
| AUB | Atlantic Union | | Financials | 32.32 | 34 | -2.39% | -11.55% |
| CATY | Cathay General | | Financials | 34.78 | 34 | -2.10% | -21.95% |
| TNET | TriNet Group | | Services & Goods | 125.46 | 34 | -1.68% | 5.49% |
| EHAB | Enhabit | | Health Care | 9.88 | 33 | -1.89% | -4.49% |
| ANF | Abercrombie & Fitch Co | | Services & Goods | 113.63 | 33 | -1.27% | 28.80% |
| INSW | Seaways | | Services & Goods | 53.73 | 33 | 0.27% | 18.13% |
| OPTN | OptiNose | | Health Care | 1.06 | 32 | 14.56% | -17.83% |
| CEIX | CONSOL Energy | | Materials | 84.83 | 32 | 1.68% | -15.61% |
| ARCH | Arch Coal | | Materials | 161.73 | 32 | 1.56% | -2.54% |
| EVC | Entravision | | Services & Goods | 2.09 | 32 | 0.48% | -49.88% |
| TTEC | TTEC | | Technology | 8.05 | 32 | 0.37% | -62.85% |
| ASC | Ardmore Shipping | | Transports | 16.42 | 32 | 0.31% | 16.54% |
| TARO | Taro Pharmaceutical | | Health Care | 42.20 | 32 | 0.01% | 1.02% |
| For chart view version of above stock list: Chart View ➞ 0 - 25 , 25 - 50 , 50 - 75 , 75 - 100 , 100 - 125 , 125 - 150 , 150 - 175 , 175 - 200 , 200 - 225 , 225 - 250 , 250 - 275 , 275 - 300 , 300 - 325 , 325 - 350 , 350 - 375 , 375 - 400 , 400 - 425 , 425 - 450 , 450 - 475 , 475 - 500 , 500 - 525 , 525 - 550 , 550 - 575 , 575 - 600 , 600 - 625 , 625 - 650 , 650 - 675 , 675 - 700 , 700 - 725 , 725 - 750 , 750 - 775 , 775 - 800 , 800 - 825 , 825 - 850 , 850 - 875 , 875 - 900 , 900 - 925 , 925 - 950 , 950 - 975 , 975 - 1000 , 1000 - 1025 , 1025 - 1050 , 1050 - 1075 , 1075 - 1100 , 1100 - 1125 , 1125 - 1150 , 1150 - 1175 , 1175 - 1200 , 1200 - 1225 , 1225 - 1250 , 1250 - 1275 , 1275 - 1300 , 1300 - 1325 , 1325 - 1350 , 1350 - 1375 , 1375 - 1400 , 1400 - 1425 , 1425 - 1450 , 1450 - 1475 , 1475 - 1500 , 1500 - 1525 , 1525 - 1550 , 1550 - 1575 , 1575 - 1600 | ||
 | Click To Change The Sort Order: By Market Cap or Company Size Performance: Year-to-date, Week and Day |  |
| Too many stocks? View smallcap stocks filtered by marketcap & sector |
| Marketcap: All SmallCap Stocks (default-no microcap), Large, Mid-Range, Small |
| Smallcap Sector: Tech, Finance, Energy, Staples, Retail, Industrial, Materials, & Medical |
|
Get the most comprehensive stock market coverage daily at 12Stocks.com ➞ Best Stocks Today ➞ Best Stocks Weekly ➞ Best Stocks Year-to-Date ➞ Best Stocks Trends ➞  Best Stocks Today 12Stocks.com Best Nasdaq Stocks ➞ Best S&P 500 Stocks ➞ Best Tech Stocks ➞ Best Biotech Stocks ➞ |
| Detailed Overview of SmallCap Stocks |
| SmallCap Technical Overview, Leaders & Laggards, Top SmallCap ETF Funds & Detailed SmallCap Stocks List, Charts, Trends & More |
| Smallcap: Technical Analysis, Trends & YTD Performance | |
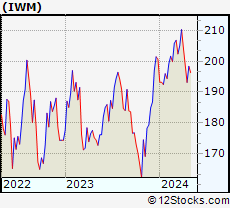
| SmallCap segment as represented by
IWM, an exchange-traded fund [ETF], holds basket of thousands of smallcap stocks from across all major sectors of the US stock market. The smallcap index (contains stocks like Riverbed & Sotheby's) is down by -2.82% and is currently underperforming the overall market by -7.07% year-to-date. Below is a quick view of technical charts and trends: | |
 IWM Weekly Chart |
|
| Long Term Trend: Good | |
| Medium Term Trend: Not Good | |
 IWM Daily Chart |
|
| Short Term Trend: Not Good | |
| Overall Trend Score: 31 | |
| YTD Performance: -2.82% | |
| **Trend Scores & Views Are Only For Educational Purposes And Not For Investing | |
| 12Stocks.com: Top Performing Small Cap Index Stocks | ||||||||||||||||||||||||||||||||||||||||||||||||
 The top performing Small Cap Index stocks year to date are
Now, more recently, over last week, the top performing Small Cap Index stocks on the move are


|
||||||||||||||||||||||||||||||||||||||||||||||||
| 12Stocks.com: Investing in Smallcap Index using Exchange Traded Funds | |
|
The following table shows list of key exchange traded funds (ETF) that
help investors track Smallcap index. The following list also includes leveraged ETF funds that track twice or thrice the daily returns of Smallcap indices. Short or inverse ETF funds move in the opposite direction to the index they track and are useful during market pullbacks or during bear markets. Quick View: Move mouse or cursor over ETF symbol (ticker) to view short-term technical chart and over ETF name to view long term chart. Click on ticker or stock name for detailed view. Click on to add stock symbol to your watchlist and to view watchlist. |
12Stocks.com List of ETFs that track Smallcap Index
| Ticker | ETF Name | Watchlist | Recent Price | Smart Investing & Trading Score | Change % | Week % | Year-to-date % |
| IWM | iShares Russell 2000 | | 195.06 | 31 | -1.33 | 0.99 | -2.82% |
| SBB | ProShares Short SmallCap600 | | 16.60 | 40 | 1.41 | -1.43 | 4.21% |
| SDD | ProShares UltraShort SmallCap600 | | 19.79 | 42 | 1.51 | -2.73 | 7.37% |
| SMLV | SPDR SSGA US Small Cap Low Volatil ETF | | 107.56 | 73 | -0.80 | 1.39 | -4.41% |
| SAA | ProShares Ultra SmallCap600 | | 23.01 | 58 | 0.00 | 5.55 | -7.78% |
| 12Stocks.com: Charts, Trends, Fundamental Data and Performances of SmallCap Stocks | |
|
We now take in-depth look at all SmallCap stocks including charts, multi-period performances and overall trends (as measured by Smart Investing & Trading Score). One can sort SmallCap stocks (click link to choose) by Daily, Weekly and by Year-to-Date performances. Also, one can sort by size of the company or by market capitalization. |
| Select Your Default Chart Type: | |||||
| |||||
| Click on stock symbol or name for detailed view. Click on to add stock symbol to your watchlist and to view watchlist. Quick View: Move mouse or cursor over "Daily" to quickly view daily technical stock chart and over "Weekly" to view weekly technical stock chart. | |||||

 | EHTH eHealth, Inc. |
| Sector: Financials | |
| SubSector: Insurance Brokers | |
| MarketCap: 2813.57 Millions | |
| Recent Price: 4.42 Smart Investing & Trading Score: 35 | |
| Day Percent Change: -2.32% Day Change: -0.10 | |
| Week Change: -1.67% Year-to-date Change: -49.4% | |
| EHTH Links: Profile News Message Board | |
| Charts:- Daily , Weekly | |
| Add EHTH to Watchlist: View: Get Complete EHTH Trend Analysis ➞ | |
 | BIPC Brookfield Infrastructure Corporation |
| Sector: Utilities | |
| SubSector: Utilities Regulated Gas | |
| MarketCap: 31197 Millions | |
| Recent Price: 31.19 Smart Investing & Trading Score: 35 | |
| Day Percent Change: -1.86% Day Change: -0.59 | |
| Week Change: 1.6% Year-to-date Change: -11.6% | |
| BIPC Links: Profile News Message Board | |
| Charts:- Daily , Weekly | |
| Add BIPC to Watchlist: View: Get Complete BIPC Trend Analysis ➞ | |
 | TIPT Tiptree Inc. |
| Sector: Financials | |
| SubSector: Life Insurance | |
| MarketCap: 183.486 Millions | |
| Recent Price: 16.03 Smart Investing & Trading Score: 35 | |
| Day Percent Change: -1.84% Day Change: -0.30 | |
| Week Change: -1.87% Year-to-date Change: -15.5% | |
| TIPT Links: Profile News Message Board | |
| Charts:- Daily , Weekly | |
| Add TIPT to Watchlist: View: Get Complete TIPT Trend Analysis ➞ | |
 | MBWM Mercantile Bank Corporation |
| Sector: Financials | |
| SubSector: Regional - Midwest Banks | |
| MarketCap: 372.77 Millions | |
| Recent Price: 36.37 Smart Investing & Trading Score: 35 | |
| Day Percent Change: -1.42% Day Change: -0.52 | |
| Week Change: 0.82% Year-to-date Change: -9.9% | |
| MBWM Links: Profile News Message Board | |
| Charts:- Daily , Weekly | |
| Add MBWM to Watchlist: View: Get Complete MBWM Trend Analysis ➞ | |
 | PLOW Douglas Dynamics, Inc. |
| Sector: Consumer Staples | |
| SubSector: Auto Parts | |
| MarketCap: 654.739 Millions | |
| Recent Price: 22.10 Smart Investing & Trading Score: 35 | |
| Day Percent Change: -1.22% Day Change: -0.27 | |
| Week Change: 0.44% Year-to-date Change: -25.6% | |
| PLOW Links: Profile News Message Board | |
| Charts:- Daily , Weekly | |
| Add PLOW to Watchlist: View: Get Complete PLOW Trend Analysis ➞ | |
 | CBNK Capital Bancorp, Inc. |
| Sector: Financials | |
| SubSector: Savings & Loans | |
| MarketCap: 174.93 Millions | |
| Recent Price: 19.27 Smart Investing & Trading Score: 35 | |
| Day Percent Change: -1.18% Day Change: -0.23 | |
| Week Change: -1.56% Year-to-date Change: -20.4% | |
| CBNK Links: Profile News Message Board | |
| Charts:- Daily , Weekly | |
| Add CBNK to Watchlist: View: Get Complete CBNK Trend Analysis ➞ | |
 | RC Ready Capital Corporation |
| Sector: Financials | |
| SubSector: Mortgage Investment | |
| MarketCap: 358.039 Millions | |
| Recent Price: 8.72 Smart Investing & Trading Score: 35 | |
| Day Percent Change: -1.08% Day Change: -0.10 | |
| Week Change: 1.22% Year-to-date Change: -14.9% | |
| RC Links: Profile News Message Board | |
| Charts:- Daily , Weekly | |
| Add RC to Watchlist: View: Get Complete RC Trend Analysis ➞ | |
 | BUSE First Busey Corporation |
| Sector: Financials | |
| SubSector: Regional - Midwest Banks | |
| MarketCap: 876.97 Millions | |
| Recent Price: 23.11 Smart Investing & Trading Score: 35 | |
| Day Percent Change: -0.04% Day Change: -0.01 | |
| Week Change: 1.32% Year-to-date Change: -6.9% | |
| BUSE Links: Profile News Message Board | |
| Charts:- Daily , Weekly | |
| Add BUSE to Watchlist: View: Get Complete BUSE Trend Analysis ➞ | |
 | HAFC Hanmi Financial Corporation |
| Sector: Financials | |
| SubSector: Regional - Pacific Banks | |
| MarketCap: 319.929 Millions | |
| Recent Price: 15.72 Smart Investing & Trading Score: 34 | |
| Day Percent Change: 3.83% Day Change: 0.58 | |
| Week Change: 3.35% Year-to-date Change: -19.0% | |
| HAFC Links: Profile News Message Board | |
| Charts:- Daily , Weekly | |
| Add HAFC to Watchlist: View: Get Complete HAFC Trend Analysis ➞ | |
 | ATGE Adtalem Global Education Inc. |
| Sector: Services & Goods | |
| SubSector: Education & Training Services | |
| MarketCap: 1273.86 Millions | |
| Recent Price: 47.63 Smart Investing & Trading Score: 34 | |
| Day Percent Change: 0.90% Day Change: 0.42 | |
| Week Change: 2.82% Year-to-date Change: -19.2% | |
| ATGE Links: Profile News Message Board | |
| Charts:- Daily , Weekly | |
| Add ATGE to Watchlist: View: Get Complete ATGE Trend Analysis ➞ | |
 | NRIM Northrim BanCorp, Inc. |
| Sector: Financials | |
| SubSector: Regional - Pacific Banks | |
| MarketCap: 147.629 Millions | |
| Recent Price: 47.35 Smart Investing & Trading Score: 34 | |
| Day Percent Change: 0.81% Day Change: 0.38 | |
| Week Change: 2.07% Year-to-date Change: -17.2% | |
| NRIM Links: Profile News Message Board | |
| Charts:- Daily , Weekly | |
| Add NRIM to Watchlist: View: Get Complete NRIM Trend Analysis ➞ | |
 | SSBK Southern States Bancshares, Inc. |
| Sector: Financials | |
| SubSector: Banks - Regional | |
| MarketCap: 187 Millions | |
| Recent Price: 24.18 Smart Investing & Trading Score: 34 | |
| Day Percent Change: 0.75% Day Change: 0.18 | |
| Week Change: 0.75% Year-to-date Change: -17.9% | |
| SSBK Links: Profile News Message Board | |
| Charts:- Daily , Weekly | |
| Add SSBK to Watchlist: View: Get Complete SSBK Trend Analysis ➞ | |
 | AUB Atlantic Union Bankshares Corporation |
| Sector: Financials | |
| SubSector: Regional - Mid-Atlantic Banks | |
| MarketCap: 1728.79 Millions | |
| Recent Price: 32.32 Smart Investing & Trading Score: 34 | |
| Day Percent Change: -2.39% Day Change: -0.79 | |
| Week Change: -2.71% Year-to-date Change: -11.6% | |
| AUB Links: Profile News Message Board | |
| Charts:- Daily , Weekly | |
| Add AUB to Watchlist: View: Get Complete AUB Trend Analysis ➞ | |
 | CATY Cathay General Bancorp |
| Sector: Financials | |
| SubSector: Regional - Pacific Banks | |
| MarketCap: 1781.99 Millions | |
| Recent Price: 34.78 Smart Investing & Trading Score: 34 | |
| Day Percent Change: -2.10% Day Change: -0.75 | |
| Week Change: -3.38% Year-to-date Change: -22.0% | |
| CATY Links: Profile News Message Board | |
| Charts:- Daily , Weekly | |
| Add CATY to Watchlist: View: Get Complete CATY Trend Analysis ➞ | |
 | TNET TriNet Group, Inc. |
| Sector: Services & Goods | |
| SubSector: Business Services | |
| MarketCap: 2648.72 Millions | |
| Recent Price: 125.46 Smart Investing & Trading Score: 34 | |
| Day Percent Change: -1.68% Day Change: -2.14 | |
| Week Change: -2.18% Year-to-date Change: 5.5% | |
| TNET Links: Profile News Message Board | |
| Charts:- Daily , Weekly | |
| Add TNET to Watchlist: View: Get Complete TNET Trend Analysis ➞ | |
 | EHAB Enhabit, Inc. |
| Sector: Health Care | |
| SubSector: Medical Care Facilities | |
| MarketCap: 569 Millions | |
| Recent Price: 9.88 Smart Investing & Trading Score: 33 | |
| Day Percent Change: -1.89% Day Change: -0.19 | |
| Week Change: -3.56% Year-to-date Change: -4.5% | |
| EHAB Links: Profile News Message Board | |
| Charts:- Daily , Weekly | |
| Add EHAB to Watchlist: View: Get Complete EHAB Trend Analysis ➞ | |
 | ANF Abercrombie & Fitch Co. |
| Sector: Services & Goods | |
| SubSector: Apparel Stores | |
| MarketCap: 589.108 Millions | |
| Recent Price: 113.63 Smart Investing & Trading Score: 33 | |
| Day Percent Change: -1.27% Day Change: -1.46 | |
| Week Change: 2.96% Year-to-date Change: 28.8% | |
| ANF Links: Profile News Message Board | |
| Charts:- Daily , Weekly | |
| Add ANF to Watchlist: View: Get Complete ANF Trend Analysis ➞ | |
 | INSW International Seaways, Inc. |
| Sector: Services & Goods | |
| SubSector: Business Services | |
| MarketCap: 521.582 Millions | |
| Recent Price: 53.73 Smart Investing & Trading Score: 33 | |
| Day Percent Change: 0.27% Day Change: 0.15 | |
| Week Change: 1.31% Year-to-date Change: 18.1% | |
| INSW Links: Profile News Message Board | |
| Charts:- Daily , Weekly | |
| Add INSW to Watchlist: View: Get Complete INSW Trend Analysis ➞ | |
 | OPTN OptiNose, Inc. |
| Sector: Health Care | |
| SubSector: Drugs - Generic | |
| MarketCap: 183.385 Millions | |
| Recent Price: 1.06 Smart Investing & Trading Score: 32 | |
| Day Percent Change: 14.56% Day Change: 0.13 | |
| Week Change: 18.42% Year-to-date Change: -17.8% | |
| OPTN Links: Profile News Message Board | |
| Charts:- Daily , Weekly | |
| Add OPTN to Watchlist: View: Get Complete OPTN Trend Analysis ➞ | |
 | CEIX CONSOL Energy Inc. |
| Sector: Materials | |
| SubSector: Industrial Metals & Minerals | |
| MarketCap: 196.81 Millions | |
| Recent Price: 84.83 Smart Investing & Trading Score: 32 | |
| Day Percent Change: 1.68% Day Change: 1.40 | |
| Week Change: 0.9% Year-to-date Change: -15.6% | |
| CEIX Links: Profile News Message Board | |
| Charts:- Daily , Weekly | |
| Add CEIX to Watchlist: View: Get Complete CEIX Trend Analysis ➞ | |
 | ARCH Arch Coal, Inc. |
| Sector: Materials | |
| SubSector: Industrial Metals & Minerals | |
| MarketCap: 547.21 Millions | |
| Recent Price: 161.73 Smart Investing & Trading Score: 32 | |
| Day Percent Change: 1.56% Day Change: 2.49 | |
| Week Change: -0.89% Year-to-date Change: -2.5% | |
| ARCH Links: Profile News Message Board | |
| Charts:- Daily , Weekly | |
| Add ARCH to Watchlist: View: Get Complete ARCH Trend Analysis ➞ | |
 | EVC Entravision Communications Corporation |
| Sector: Services & Goods | |
| SubSector: Broadcasting - TV | |
| MarketCap: 171.763 Millions | |
| Recent Price: 2.09 Smart Investing & Trading Score: 32 | |
| Day Percent Change: 0.48% Day Change: 0.01 | |
| Week Change: -0.48% Year-to-date Change: -49.9% | |
| EVC Links: Profile News Message Board | |
| Charts:- Daily , Weekly | |
| Add EVC to Watchlist: View: Get Complete EVC Trend Analysis ➞ | |
 | TTEC TTEC Holdings, Inc. |
| Sector: Technology | |
| SubSector: Information Technology Services | |
| MarketCap: 1528.48 Millions | |
| Recent Price: 8.05 Smart Investing & Trading Score: 32 | |
| Day Percent Change: 0.37% Day Change: 0.03 | |
| Week Change: -3.48% Year-to-date Change: -62.9% | |
| TTEC Links: Profile News Message Board | |
| Charts:- Daily , Weekly | |
| Add TTEC to Watchlist: View: Get Complete TTEC Trend Analysis ➞ | |
 | ASC Ardmore Shipping Corporation |
| Sector: Transports | |
| SubSector: Shipping | |
| MarketCap: 147.014 Millions | |
| Recent Price: 16.42 Smart Investing & Trading Score: 32 | |
| Day Percent Change: 0.31% Day Change: 0.05 | |
| Week Change: 3.4% Year-to-date Change: 16.5% | |
| ASC Links: Profile News Message Board | |
| Charts:- Daily , Weekly | |
| Add ASC to Watchlist: View: Get Complete ASC Trend Analysis ➞ | |
 | TARO Taro Pharmaceutical Industries Ltd. |
| Sector: Health Care | |
| SubSector: Drug Manufacturers - Other | |
| MarketCap: 2379.33 Millions | |
| Recent Price: 42.20 Smart Investing & Trading Score: 32 | |
| Day Percent Change: 0.01% Day Change: 0.00 | |
| Week Change: -0.11% Year-to-date Change: 1.0% | |
| TARO Links: Profile News Message Board | |
| Charts:- Daily , Weekly | |
| Add TARO to Watchlist: View: Get Complete TARO Trend Analysis ➞ | |
| For tabular summary view of above stock list: Summary View ➞ 0 - 25 , 25 - 50 , 50 - 75 , 75 - 100 , 100 - 125 , 125 - 150 , 150 - 175 , 175 - 200 , 200 - 225 , 225 - 250 , 250 - 275 , 275 - 300 , 300 - 325 , 325 - 350 , 350 - 375 , 375 - 400 , 400 - 425 , 425 - 450 , 450 - 475 , 475 - 500 , 500 - 525 , 525 - 550 , 550 - 575 , 575 - 600 , 600 - 625 , 625 - 650 , 650 - 675 , 675 - 700 , 700 - 725 , 725 - 750 , 750 - 775 , 775 - 800 , 800 - 825 , 825 - 850 , 850 - 875 , 875 - 900 , 900 - 925 , 925 - 950 , 950 - 975 , 975 - 1000 , 1000 - 1025 , 1025 - 1050 , 1050 - 1075 , 1075 - 1100 , 1100 - 1125 , 1125 - 1150 , 1150 - 1175 , 1175 - 1200 , 1200 - 1225 , 1225 - 1250 , 1250 - 1275 , 1275 - 1300 , 1300 - 1325 , 1325 - 1350 , 1350 - 1375 , 1375 - 1400 , 1400 - 1425 , 1425 - 1450 , 1450 - 1475 , 1475 - 1500 , 1500 - 1525 , 1525 - 1550 , 1550 - 1575 , 1575 - 1600 | ||
| Click To Change The Sort Order: By Market Cap or Company Size Performance: Year-to-date, Week and Day | |
| Select Chart Type: | ||
| Too many stocks? View smallcap stocks filtered by marketcap & sector |
| Marketcap: All SmallCap Stocks (default-no microcap), Large, Mid-Range, Small & MicroCap |
| Sector: Tech, Finance, Energy, Staples, Retail, Industrial, Materials, Utilities & Medical |
|
Best Stocks Today 12Stocks.com |
© 2024 12Stocks.com Terms & Conditions Privacy Contact Us
All Information Provided Only For Education And Not To Be Used For Investing or Trading. See Terms & Conditions


One More Thing ... Get Best Stocks Delivered Daily!
Never Ever Miss A Move With Our Top Ten Stocks Lists
Find Best Stocks In Any Market - Bull or Bear Market
Take A Peek At Our Top Ten Stocks Lists: Daily, Weekly, Year-to-Date & Top Trends
Find Best Stocks In Any Market - Bull or Bear Market
Take A Peek At Our Top Ten Stocks Lists: Daily, Weekly, Year-to-Date & Top Trends
Smallcap Stocks With Best Up Trends [0-bearish to 100-bullish]: Ribbon [100], Diodes [100], Trustmark [100], Sanmina [100], California Water[100], NextNav [100], B. Riley[100], Third Coast[100], Northwest Natural[100], LCNB [100], Agios [100]
Best Smallcap Stocks Year-to-Date:
CareMax [572.16%], Janux [333.88%], Alpine Immune[239.52%], Longboard [218%], Super Micro[170.84%], Avidity Biosciences[159.79%], Arcutis Bio[156.19%], Vera [154.33%], Hippo [126.07%], Y-mAbs [121.85%], Stoke [115.78%] Best Smallcap Stocks This Week:
Matterport [168.39%], B. Riley[49.67%], Seres [38.35%], Ribbon [30.81%], CareMax [26.85%], ProKidney [25.74%], Riot Blockchain[25.19%], Impinj [22.93%], Cullinan Oncology[21.1%], Hibbett Sports[21%], OptiNose [18.42%] Best Smallcap Stocks Daily:
Impinj [18.26%], OptiNose [14.56%], Strategic Education[12.22%], Red Robin[8.77%], Sonic Automotive[8.63%], Intevac [7.97%], JELD-WEN Holding[7.31%], Zura Bio[6.75%], Community Health[6.44%], Seres [6.18%], Vicor [5.49%]