
 Login Sign Up


| |||||
 |  | ||||

| 12Stocks.com Market Intelligence |
Best SmallCap Stocks
|
| In a hurry? Small Cap Stock Lists: Performance Trends Table, Stock Charts
Sort Small Cap stocks: Daily, Weekly, Year-to-Date, Market Cap & Trends. Filter Small Cap stocks list by sector: Show all, Tech, Finance, Energy, Staples, Retail, Industrial, Materials, Utilities and HealthCare Filter Small Cap stocks list by size: All Large Medium Small and MicroCap |
| 12Stocks.com Small Cap Stocks Performances & Trends Daily | |||||||||
|
|  The overall Smart Investing & Trading Score is 13 (0-bearish to 100-bullish) which puts Small Cap index in short term bearish trend. The Smart Investing & Trading Score from previous trading session is 26 and hence a deterioration of trend.
| ||||||||
Here are the Smart Investing & Trading Scores of the most requested small cap stocks at 12Stocks.com (click stock name for detailed review):
|


| 12Stocks.com: Investing in Smallcap Index with Stocks | |
|
The following table helps investors and traders sort through current performance and trends (as measured by Smart Investing & Trading Score) of various
stocks in the Smallcap Index. Quick View: Move mouse or cursor over stock symbol (ticker) to view short-term technical chart and over stock name to view long term chart. Click on  to add stock symbol to your watchlist and to add stock symbol to your watchlist and  to view watchlist. Click on any ticker or stock name for detailed market intelligence report for that stock. to view watchlist. Click on any ticker or stock name for detailed market intelligence report for that stock. |
12Stocks.com Performance of Stocks in Smallcap Index
| Ticker | Stock Name | Watchlist | Category | Recent Price | Smart Investing & Trading Score | Change % | YTD Change% |
| SANM | Sanmina |   | Technology | 58.35 | 35 | 0.76% | 13.59% |
| ACAD | ACADIA | | Health Care | 17.19 | 35 | 0.64% | -45.10% |
| CMTG | Claros Mortgage | | Financials | 8.62 | 35 | 0.58% | -37.87% |
| ENR | Energizer | | Consumer Staples | 27.50 | 35 | 0.40% | -13.19% |
| OVLY | Oak Valley | | Financials | 23.37 | 35 | 0.39% | -21.97% |
| UMBF | UMB Financial | | Financials | 79.67 | 35 | 0.29% | -4.64% |
| NREF | NexPoint Real | | Financials | 13.00 | 35 | 0.23% | -17.38% |
| SBSI | Southside Bancshares | | Financials | 26.96 | 35 | 0.19% | -13.92% |
| FSBC | Five Star | | Financials | 21.43 | 35 | 0.14% | -18.14% |
| CZNC | Citizens & Northern | | Financials | 17.04 | 35 | 0.12% | -24.03% |
| MGPI | MGP Ingredients | | Consumer Staples | 77.78 | 35 | -1.64% | -21.05% |
| SMMF | Summit Financial | | Financials | 25.03 | 35 | -0.64% | -18.44% |
| NAPA | Duckhorn Portfolio | | Consumer Staples | 8.25 | 35 | -0.48% | -16.16% |
| INFU | InfuSystem | | Health Care | 7.87 | 35 | -0.38% | -25.33% |
| PCRX | Pacira BioSciences | | Health Care | 26.77 | 35 | -0.37% | -20.66% |
| CVLY | Codorus Valley | | Financials | 21.37 | 35 | -0.19% | -16.85% |
| FFIC | Flushing Financial | | Financials | 11.14 | 35 | -0.18% | -32.40% |
| WAFD | Washington Federal | | Financials | 26.70 | 35 | -0.15% | -18.99% |
| UDMY | Udemy | | Consumer Staples | 9.96 | 35 | -0.05% | -33.03% |
| PRA | ProAssurance | | Financials | 12.87 | 34 | 0.39% | -6.67% |
| ONTO | Onto Innovation | | Technology | 181.94 | 34 | -4.10% | 18.99% |
| OEC | Orion Engineered | | Materials | 23.66 | 34 | -1.42% | -14.68% |
| CSWI | CSW Industrials | | Industrials | 232.43 | 34 | -0.95% | 12.06% |
| GES | Guess | | Services & Goods | 25.51 | 33 | 0.87% | 10.62% |
| DHT | DHT | | Transports | 11.28 | 33 | 0.27% | 14.98% |


| Too many stocks? View smallcap stocks filtered by marketcap & sector |
| Marketcap: All SmallCap Stocks (default-no microcap), Large, Mid-Range, Small |
| Smallcap Sector: Tech, Finance, Energy, Staples, Retail, Industrial, Materials, & Medical |
|
Get the most comprehensive stock market coverage daily at 12Stocks.com ➞ Best Stocks Today ➞ Best Stocks Weekly ➞ Best Stocks Year-to-Date ➞ Best Stocks Trends ➞  Best Stocks Today 12Stocks.com Best Nasdaq Stocks ➞ Best S&P 500 Stocks ➞ Best Tech Stocks ➞ Best Biotech Stocks ➞ |
| Detailed Overview of SmallCap Stocks |
| SmallCap Technical Overview, Leaders & Laggards, Top SmallCap ETF Funds & Detailed SmallCap Stocks List, Charts, Trends & More |
| Smallcap: Technical Analysis, Trends & YTD Performance | |
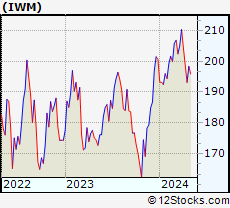
| SmallCap segment as represented by
IWM, an exchange-traded fund [ETF], holds basket of thousands of smallcap stocks from across all major sectors of the US stock market. The smallcap index (contains stocks like Riverbed & Sotheby's) is down by -3.84% and is currently underperforming the overall market by -8.25% year-to-date. Below is a quick view of technical charts and trends: | |
 IWM Weekly Chart |
|
| Long Term Trend: Good | |
| Medium Term Trend: Not Good | |
 IWM Daily Chart |
|
| Short Term Trend: Not Good | |
| Overall Trend Score: 13 | |
| YTD Performance: -3.84% | |
| **Trend Scores & Views Are Only For Educational Purposes And Not For Investing | |
| 12Stocks.com: Top Performing Small Cap Index Stocks | ||||||||||||||||||||||||||||||||||||||||||||||||
 The top performing Small Cap Index stocks year to date are
Now, more recently, over last week, the top performing Small Cap Index stocks on the move are


|
||||||||||||||||||||||||||||||||||||||||||||||||
| 12Stocks.com: Investing in Smallcap Index using Exchange Traded Funds | |
|
The following table shows list of key exchange traded funds (ETF) that
help investors track Smallcap index. The following list also includes leveraged ETF funds that track twice or thrice the daily returns of Smallcap indices. Short or inverse ETF funds move in the opposite direction to the index they track and are useful during market pullbacks or during bear markets. Quick View: Move mouse or cursor over ETF symbol (ticker) to view short-term technical chart and over ETF name to view long term chart. Click on ticker or stock name for detailed view. Click on to add stock symbol to your watchlist and to view watchlist. |
12Stocks.com List of ETFs that track Smallcap Index
| Ticker | ETF Name | Watchlist | Recent Price | Smart Investing & Trading Score | Change % | Week % | Year-to-date % |
| IWM | iShares Russell 2000 | | 193.00 | 13 | -1.06 | -2.86 | -3.84% |
| IJR | iShares Core S&P Small-Cap | | 102.13 | 17 | -0.58 | -2.28 | -5.65% |
| VTWO | Vanguard Russell 2000 ETF | | 78.05 | 36 | -1.04 | -2.83 | -3.76% |
| IWN | iShares Russell 2000 Value | | 146.03 | 23 | -0.77 | -2.89 | -5.99% |
| IWO | iShares Russell 2000 Growth | | 248.02 | 36 | -0.90 | -2.87 | -1.67% |
| IJS | iShares S&P Small-Cap 600 Value | | 94.12 | 17 | -0.57 | -2.13 | -8.68% |
| IJT | iShares S&P Small-Cap 600 Growth | | 121.84 | 41 | -1.02 | -2.36 | -2.64% |
| XSLV | PowerShares S&P SmallCap Low Volatil ETF | | 41.42 | 10 | -0.38 | -1.59 | -6.18% |
| SAA | ProShares Ultra SmallCap600 | | 21.66 | 0 | -1.19 | -3.99 | -13.19% |
| SMLV | SPDR SSGA US Small Cap Low Volatil ETF | | 103.66 | 10 | -0.17 | -1.29 | -7.87% |
| SBB | ProShares Short SmallCap600 | | 16.85 | 93 | 0.42 | 1.83 | 5.78% |
| SDD | ProShares UltraShort SmallCap600 | | 20.60 | 93 | 1.23 | 3.88 | 11.8% |
| 12Stocks.com: Charts, Trends, Fundamental Data and Performances of SmallCap Stocks | |
|
We now take in-depth look at all SmallCap stocks including charts, multi-period performances and overall trends (as measured by Smart Investing & Trading Score). One can sort SmallCap stocks (click link to choose) by Daily, Weekly and by Year-to-Date performances. Also, one can sort by size of the company or by market capitalization. |
| Select Your Default Chart Type: | |||||
| |||||
| Click on stock symbol or name for detailed view. Click on to add stock symbol to your watchlist and to view watchlist. Quick View: Move mouse or cursor over "Daily" to quickly view daily technical stock chart and over "Weekly" to view weekly technical stock chart. | |||||

 | SANM Sanmina Corporation |
| Sector: Technology | |
| SubSector: Diversified Electronics | |
| MarketCap: 1790.36 Millions | |
| Recent Price: 58.35 Smart Investing & Trading Score: 35 | |
| Day Percent Change: 0.76% Day Change: 0.44 | |
| Week Change: 0.29% Year-to-date Change: 13.6% | |
| SANM Links: Profile News Message Board | |
| Charts:- Daily , Weekly | |
| Add SANM to Watchlist: View: Get Complete SANM Trend Analysis ➞ | |
 | ACAD ACADIA Pharmaceuticals Inc. |
| Sector: Health Care | |
| SubSector: Biotechnology | |
| MarketCap: 5400.35 Millions | |
| Recent Price: 17.19 Smart Investing & Trading Score: 35 | |
| Day Percent Change: 0.64% Day Change: 0.11 | |
| Week Change: 0.29% Year-to-date Change: -45.1% | |
| ACAD Links: Profile News Message Board | |
| Charts:- Daily , Weekly | |
| Add ACAD to Watchlist: View: Get Complete ACAD Trend Analysis ➞ | |
 | CMTG Claros Mortgage Trust, Inc. |
| Sector: Financials | |
| SubSector: REIT - Mortgage | |
| MarketCap: 1610 Millions | |
| Recent Price: 8.62 Smart Investing & Trading Score: 35 | |
| Day Percent Change: 0.58% Day Change: 0.05 | |
| Week Change: -0.69% Year-to-date Change: -37.9% | |
| CMTG Links: Profile News Message Board | |
| Charts:- Daily , Weekly | |
| Add CMTG to Watchlist: View: Get Complete CMTG Trend Analysis ➞ | |
 | ENR Energizer Holdings, Inc. |
| Sector: Consumer Staples | |
| SubSector: Personal Products | |
| MarketCap: 2469.55 Millions | |
| Recent Price: 27.50 Smart Investing & Trading Score: 35 | |
| Day Percent Change: 0.40% Day Change: 0.11 | |
| Week Change: 0.22% Year-to-date Change: -13.2% | |
| ENR Links: Profile News Message Board | |
| Charts:- Daily , Weekly | |
| Add ENR to Watchlist: View: Get Complete ENR Trend Analysis ➞ | |
 | OVLY Oak Valley Bancorp |
| Sector: Financials | |
| SubSector: Regional - Pacific Banks | |
| MarketCap: 148.429 Millions | |
| Recent Price: 23.37 Smart Investing & Trading Score: 35 | |
| Day Percent Change: 0.39% Day Change: 0.09 | |
| Week Change: 0.82% Year-to-date Change: -22.0% | |
| OVLY Links: Profile News Message Board | |
| Charts:- Daily , Weekly | |
| Add OVLY to Watchlist: View: Get Complete OVLY Trend Analysis ➞ | |
 | UMBF UMB Financial Corporation |
| Sector: Financials | |
| SubSector: Regional - Southwest Banks | |
| MarketCap: 2207.35 Millions | |
| Recent Price: 79.67 Smart Investing & Trading Score: 35 | |
| Day Percent Change: 0.29% Day Change: 0.23 | |
| Week Change: -0.5% Year-to-date Change: -4.6% | |
| UMBF Links: Profile News Message Board | |
| Charts:- Daily , Weekly | |
| Add UMBF to Watchlist: View: Get Complete UMBF Trend Analysis ➞ | |
 | NREF NexPoint Real Estate Finance, Inc. |
| Sector: Financials | |
| SubSector: REIT Diversified | |
| MarketCap: 97267 Millions | |
| Recent Price: 13.00 Smart Investing & Trading Score: 35 | |
| Day Percent Change: 0.23% Day Change: 0.03 | |
| Week Change: -0.54% Year-to-date Change: -17.4% | |
| NREF Links: Profile News Message Board | |
| Charts:- Daily , Weekly | |
| Add NREF to Watchlist: View: Get Complete NREF Trend Analysis ➞ | |
 | SBSI Southside Bancshares, Inc. |
| Sector: Financials | |
| SubSector: Regional - Mid-Atlantic Banks | |
| MarketCap: 971.259 Millions | |
| Recent Price: 26.96 Smart Investing & Trading Score: 35 | |
| Day Percent Change: 0.19% Day Change: 0.05 | |
| Week Change: -0.19% Year-to-date Change: -13.9% | |
| SBSI Links: Profile News Message Board | |
| Charts:- Daily , Weekly | |
| Add SBSI to Watchlist: View: Get Complete SBSI Trend Analysis ➞ | |
 | FSBC Five Star Bancorp |
| Sector: Financials | |
| SubSector: Banks - Regional | |
| MarketCap: 377 Millions | |
| Recent Price: 21.43 Smart Investing & Trading Score: 35 | |
| Day Percent Change: 0.14% Day Change: 0.03 | |
| Week Change: 0.05% Year-to-date Change: -18.1% | |
| FSBC Links: Profile News Message Board | |
| Charts:- Daily , Weekly | |
| Add FSBC to Watchlist: View: Get Complete FSBC Trend Analysis ➞ | |
 | CZNC Citizens & Northern Corporation |
| Sector: Financials | |
| SubSector: Regional - Mid-Atlantic Banks | |
| MarketCap: 274.459 Millions | |
| Recent Price: 17.04 Smart Investing & Trading Score: 35 | |
| Day Percent Change: 0.12% Day Change: 0.02 | |
| Week Change: 0% Year-to-date Change: -24.0% | |
| CZNC Links: Profile News Message Board | |
| Charts:- Daily , Weekly | |
| Add CZNC to Watchlist: View: Get Complete CZNC Trend Analysis ➞ | |
 | MGPI MGP Ingredients, Inc. |
| Sector: Consumer Staples | |
| SubSector: Beverages - Wineries & Distillers | |
| MarketCap: 502.635 Millions | |
| Recent Price: 77.78 Smart Investing & Trading Score: 35 | |
| Day Percent Change: -1.64% Day Change: -1.30 | |
| Week Change: 0.23% Year-to-date Change: -21.1% | |
| MGPI Links: Profile News Message Board | |
| Charts:- Daily , Weekly | |
| Add MGPI to Watchlist: View: Get Complete MGPI Trend Analysis ➞ | |
 | SMMF Summit Financial Group, Inc. |
| Sector: Financials | |
| SubSector: Regional - Mid-Atlantic Banks | |
| MarketCap: 228.959 Millions | |
| Recent Price: 25.03 Smart Investing & Trading Score: 35 | |
| Day Percent Change: -0.64% Day Change: -0.16 | |
| Week Change: -0.36% Year-to-date Change: -18.4% | |
| SMMF Links: Profile News Message Board | |
| Charts:- Daily , Weekly | |
| Add SMMF to Watchlist: View: Get Complete SMMF Trend Analysis ➞ | |
 | NAPA The Duckhorn Portfolio, Inc. |
| Sector: Consumer Staples | |
| SubSector: Beverages - Wineries & Distilleries | |
| MarketCap: 1500 Millions | |
| Recent Price: 8.25 Smart Investing & Trading Score: 35 | |
| Day Percent Change: -0.48% Day Change: -0.04 | |
| Week Change: 0.36% Year-to-date Change: -16.2% | |
| NAPA Links: Profile News Message Board | |
| Charts:- Daily , Weekly | |
| Add NAPA to Watchlist: View: Get Complete NAPA Trend Analysis ➞ | |
 | INFU InfuSystem Holdings Inc. |
| Sector: Health Care | |
| SubSector: Medical Instruments & Supplies | |
| MarketCap: 136.76 Millions | |
| Recent Price: 7.87 Smart Investing & Trading Score: 35 | |
| Day Percent Change: -0.38% Day Change: -0.03 | |
| Week Change: -2.11% Year-to-date Change: -25.3% | |
| INFU Links: Profile News Message Board | |
| Charts:- Daily , Weekly | |
| Add INFU to Watchlist: View: Get Complete INFU Trend Analysis ➞ | |
 | PCRX Pacira BioSciences, Inc. |
| Sector: Health Care | |
| SubSector: Drugs - Generic | |
| MarketCap: 1403.95 Millions | |
| Recent Price: 26.77 Smart Investing & Trading Score: 35 | |
| Day Percent Change: -0.37% Day Change: -0.10 | |
| Week Change: -0.22% Year-to-date Change: -20.7% | |
| PCRX Links: Profile News Message Board | |
| Charts:- Daily , Weekly | |
| Add PCRX to Watchlist: View: Get Complete PCRX Trend Analysis ➞ | |
 | CVLY Codorus Valley Bancorp, Inc. |
| Sector: Financials | |
| SubSector: Regional - Northeast Banks | |
| MarketCap: 173.799 Millions | |
| Recent Price: 21.37 Smart Investing & Trading Score: 35 | |
| Day Percent Change: -0.19% Day Change: -0.04 | |
| Week Change: 0% Year-to-date Change: -16.9% | |
| CVLY Links: Profile News Message Board | |
| Charts:- Daily , Weekly | |
| Add CVLY to Watchlist: View: Get Complete CVLY Trend Analysis ➞ | |
 | FFIC Flushing Financial Corporation |
| Sector: Financials | |
| SubSector: Savings & Loans | |
| MarketCap: 336.43 Millions | |
| Recent Price: 11.14 Smart Investing & Trading Score: 35 | |
| Day Percent Change: -0.18% Day Change: -0.02 | |
| Week Change: -0.45% Year-to-date Change: -32.4% | |
| FFIC Links: Profile News Message Board | |
| Charts:- Daily , Weekly | |
| Add FFIC to Watchlist: View: Get Complete FFIC Trend Analysis ➞ | |
 | WAFD Washington Federal, Inc. |
| Sector: Financials | |
| SubSector: Savings & Loans | |
| MarketCap: 2219.2 Millions | |
| Recent Price: 26.70 Smart Investing & Trading Score: 35 | |
| Day Percent Change: -0.15% Day Change: -0.04 | |
| Week Change: -0.56% Year-to-date Change: -19.0% | |
| WAFD Links: Profile News Message Board | |
| Charts:- Daily , Weekly | |
| Add WAFD to Watchlist: View: Get Complete WAFD Trend Analysis ➞ | |
 | UDMY Udemy, Inc. |
| Sector: Consumer Staples | |
| SubSector: Education & Training Services | |
| MarketCap: 1570 Millions | |
| Recent Price: 9.96 Smart Investing & Trading Score: 35 | |
| Day Percent Change: -0.05% Day Change: -0.01 | |
| Week Change: -0.45% Year-to-date Change: -33.0% | |
| UDMY Links: Profile News Message Board | |
| Charts:- Daily , Weekly | |
| Add UDMY to Watchlist: View: Get Complete UDMY Trend Analysis ➞ | |
 | PRA ProAssurance Corporation |
| Sector: Financials | |
| SubSector: Accident & Health Insurance | |
| MarketCap: 1434.6 Millions | |
| Recent Price: 12.87 Smart Investing & Trading Score: 34 | |
| Day Percent Change: 0.39% Day Change: 0.05 | |
| Week Change: -2.94% Year-to-date Change: -6.7% | |
| PRA Links: Profile News Message Board | |
| Charts:- Daily , Weekly | |
| Add PRA to Watchlist: View: Get Complete PRA Trend Analysis ➞ | |
 | ONTO Onto Innovation Inc. |
| Sector: Technology | |
| SubSector: Semiconductor Equipment & Materials | |
| MarketCap: 1187.18 Millions | |
| Recent Price: 181.94 Smart Investing & Trading Score: 34 | |
| Day Percent Change: -4.10% Day Change: -7.78 | |
| Week Change: -1.18% Year-to-date Change: 19.0% | |
| ONTO Links: Profile News Message Board | |
| Charts:- Daily , Weekly | |
| Add ONTO to Watchlist: View: Get Complete ONTO Trend Analysis ➞ | |
 | OEC Orion Engineered Carbons S.A. |
| Sector: Materials | |
| SubSector: Specialty Chemicals | |
| MarketCap: 493.457 Millions | |
| Recent Price: 23.66 Smart Investing & Trading Score: 34 | |
| Day Percent Change: -1.42% Day Change: -0.34 | |
| Week Change: -2.67% Year-to-date Change: -14.7% | |
| OEC Links: Profile News Message Board | |
| Charts:- Daily , Weekly | |
| Add OEC to Watchlist: View: Get Complete OEC Trend Analysis ➞ | |
 | CSWI CSW Industrials, Inc. |
| Sector: Industrials | |
| SubSector: Diversified Machinery | |
| MarketCap: 985.616 Millions | |
| Recent Price: 232.43 Smart Investing & Trading Score: 34 | |
| Day Percent Change: -0.95% Day Change: -2.23 | |
| Week Change: -1.53% Year-to-date Change: 12.1% | |
| CSWI Links: Profile News Message Board | |
| Charts:- Daily , Weekly | |
| Add CSWI to Watchlist: View: Get Complete CSWI Trend Analysis ➞ | |
 | GES Guess , Inc. |
| Sector: Services & Goods | |
| SubSector: Apparel Stores | |
| MarketCap: 591.908 Millions | |
| Recent Price: 25.51 Smart Investing & Trading Score: 33 | |
| Day Percent Change: 0.87% Day Change: 0.22 | |
| Week Change: -7.54% Year-to-date Change: 10.6% | |
| GES Links: Profile News Message Board | |
| Charts:- Daily , Weekly | |
| Add GES to Watchlist: View: Get Complete GES Trend Analysis ➞ | |
 | DHT DHT Holdings, Inc. |
| Sector: Transports | |
| SubSector: Shipping | |
| MarketCap: 754.514 Millions | |
| Recent Price: 11.28 Smart Investing & Trading Score: 33 | |
| Day Percent Change: 0.27% Day Change: 0.03 | |
| Week Change: -0.79% Year-to-date Change: 15.0% | |
| DHT Links: Profile News Message Board | |
| Charts:- Daily , Weekly | |
| Add DHT to Watchlist: View: Get Complete DHT Trend Analysis ➞ | |
| Too many stocks? View smallcap stocks filtered by marketcap & sector |
| Marketcap: All SmallCap Stocks (default-no microcap), Large, Mid-Range, Small & MicroCap |
| Sector: Tech, Finance, Energy, Staples, Retail, Industrial, Materials, Utilities & Medical |
|
Best Stocks Today 12Stocks.com |
© 2024 12Stocks.com Terms & Conditions Privacy Contact Us
All Information Provided Only For Education And Not To Be Used For Investing or Trading. See Terms & Conditions


One More Thing ... Get Best Stocks Delivered Daily!
Never Ever Miss A Move With Our Top Ten Stocks Lists
Find Best Stocks In Any Market - Bull or Bear Market
Take A Peek At Our Top Ten Stocks Lists: Daily, Weekly, Year-to-Date & Top Trends
Find Best Stocks In Any Market - Bull or Bear Market
Take A Peek At Our Top Ten Stocks Lists: Daily, Weekly, Year-to-Date & Top Trends
Smallcap Stocks With Best Up Trends [0-bearish to 100-bullish]: Vanda [100], Zuora [100], ALX Oncology[100], ProKidney [100], IMAX [100], Envestnet [100], Intra-Cellular Therapies[100], Dorian LPG[95], Victory Capital[95], Oscar Health[95], Reneo [93]
Best Smallcap Stocks Year-to-Date:
Agenus [552.25%], CareMax [416.49%], Janux [346.07%], Viking [257.17%], Alpine Immune[238.55%], Super Micro[237.75%], Arcutis Bio[217.34%], Longboard [177.91%], Avidity Biosciences[160.56%], Vera [158.46%], Stoke [122.81%] Best Smallcap Stocks This Week:
ProKidney [61.71%], Macatawa Bank[42.75%], Snap One[29.85%], Vanda [27.18%], ALX Oncology[23.41%], Intra-Cellular Therapies[16.41%], Escalade [13.71%], Karyopharm [13.11%], Encore Wire[10.06%], Zuora [10%], Direxion Daily[8.81%] Best Smallcap Stocks Daily:
Vanda [29.38%], Karyopharm [25.45%], Cutera [18.41%], Children s[16.46%], WW [14.10%], Lineage Cell[12.17%], Zuora [11.69%], ALX Oncology[10.97%], Marinus [10.77%], Acrivon [9.19%], Cue Biopharma[9.03%]