
 Login Sign Up


| |||||
 |  | ||||

| 12Stocks.com Market Intelligence |
Best SmallCap Stocks
|
| In a hurry? Small Cap Stock Lists: Performance Trends Table, Stock Charts
Sort Small Cap stocks: Daily, Weekly, Year-to-Date, Market Cap & Trends. Filter Small Cap stocks list by sector: Show all, Tech, Finance, Energy, Staples, Retail, Industrial, Materials, Utilities and HealthCare Filter Small Cap stocks list by size: All Large Medium Small and MicroCap |
| 12Stocks.com Small Cap Stocks Performances & Trends Daily | |||||||||
|
|  The overall Smart Investing & Trading Score is 23 (0-bearish to 100-bullish) which puts Small Cap index in short term bearish to neutral trend. The Smart Investing & Trading Score from previous trading session is 13 and an improvement of trend continues.
| ||||||||
Here are the Smart Investing & Trading Scores of the most requested small cap stocks at 12Stocks.com (click stock name for detailed review):
|


| 12Stocks.com: Investing in Smallcap Index with Stocks | |
|
The following table helps investors and traders sort through current performance and trends (as measured by Smart Investing & Trading Score) of various
stocks in the Smallcap Index. Quick View: Move mouse or cursor over stock symbol (ticker) to view short-term technical chart and over stock name to view long term chart. Click on  to add stock symbol to your watchlist and to add stock symbol to your watchlist and  to view watchlist. Click on any ticker or stock name for detailed market intelligence report for that stock. to view watchlist. Click on any ticker or stock name for detailed market intelligence report for that stock. |
12Stocks.com Performance of Stocks in Smallcap Index
| Ticker | Stock Name | Watchlist | Category | Recent Price | Smart Investing & Trading Score | Change % | YTD Change% |
| MGTX | MeiraGTx |   | Health Care | 5.09 | 0 | 1.60% | -27.49% |
| STNG | Scorpio Tankers | | Transports | 69.53 | 0 | 1.56% | 14.36% |
| NAT | Nordic American | | Transports | 3.81 | 0 | 1.06% | -9.29% |
| EYPT | EyePoint | | Health Care | 17.66 | 0 | 1.00% | -23.56% |
| TEX | Terex | | Industrials | 60.25 | 0 | 0.80% | 4.86% |
| MAC | Macerich | | Financials | 15.29 | 0 | 0.79% | -0.91% |
| CYTK | Cytokinetics | | Health Care | 67.49 | 0 | 0.73% | -19.16% |
| NVEE | NV5 Global | | Services & Goods | 90.02 | 0 | 0.63% | -18.99% |
| AMSWA | American | | Technology | 10.62 | 0 | 0.47% | -6.02% |
| MTW | Manitowoc | | Industrials | 12.88 | 0 | 0.39% | -22.83% |
| BATRK | Liberty Braves | | Services & Goods | 37.27 | 0 | 0.32% | -5.84% |
| HLNE | Hamilton Lane | | Financials | 109.98 | 0 | 0.30% | -3.05% |
| VRRM | Verra Mobility | | Services & Goods | 23.51 | 0 | 0.30% | 2.08% |
| ANAB | AnaptysBio | | Health Care | 19.86 | 0 | 0.18% | -7.26% |
| BATRA | Liberty Braves | | Services & Goods | 40.13 | 0 | 0.00% | -6.19% |
| AVXL | Anavex Life | | Health Care | 3.80 | 0 | 0.00% | -59.18% |
| SMMT | Summit | | Health Care | 3.51 | 0 | 0.00% | 34.48% |
| SVRA | Savara | | Health Care | 4.81 | 0 | 0.00% | 2.34% |
| CRDO | Credo | | Technology | 17.02 | 0 | -7.78% | -12.99% |
| NVTS | Navitas Semiconductor | | Technology | 3.68 | 0 | -7.77% | -54.71% |
| BMEA | Biomea Fusion | | Health Care | 10.45 | 0 | -7.73% | -28.62% |
| TELA | TELA Bio | | Health Care | 4.76 | 0 | -7.57% | -28.10% |
| BHVN | Biohaven Pharmaceutical | | Health Care | 38.99 | 0 | -7.52% | -8.90% |
| MQ | Marqeta | | Technology | 5.21 | 0 | -7.30% | -26.01% |
| CVRX | CVRx | | Health Care | 14.72 | 0 | -7.01% | -53.21% |


| Too many stocks? View smallcap stocks filtered by marketcap & sector |
| Marketcap: All SmallCap Stocks (default-no microcap), Large, Mid-Range, Small |
| Smallcap Sector: Tech, Finance, Energy, Staples, Retail, Industrial, Materials, & Medical |
|
Get the most comprehensive stock market coverage daily at 12Stocks.com ➞ Best Stocks Today ➞ Best Stocks Weekly ➞ Best Stocks Year-to-Date ➞ Best Stocks Trends ➞  Best Stocks Today 12Stocks.com Best Nasdaq Stocks ➞ Best S&P 500 Stocks ➞ Best Tech Stocks ➞ Best Biotech Stocks ➞ |
| Detailed Overview of SmallCap Stocks |
| SmallCap Technical Overview, Leaders & Laggards, Top SmallCap ETF Funds & Detailed SmallCap Stocks List, Charts, Trends & More |
| Smallcap: Technical Analysis, Trends & YTD Performance | |
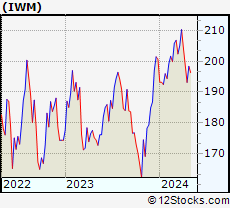
| SmallCap segment as represented by
IWM, an exchange-traded fund [ETF], holds basket of thousands of smallcap stocks from across all major sectors of the US stock market. The smallcap index (contains stocks like Riverbed & Sotheby's) is down by -3.77% and is currently underperforming the overall market by -7.16% year-to-date. Below is a quick view of technical charts and trends: | |
 IWM Weekly Chart |
|
| Long Term Trend: Not Good | |
| Medium Term Trend: Not Good | |
 IWM Daily Chart |
|
| Short Term Trend: Not Good | |
| Overall Trend Score: 23 | |
| YTD Performance: -3.77% | |
| **Trend Scores & Views Are Only For Educational Purposes And Not For Investing | |
| 12Stocks.com: Top Performing Small Cap Index Stocks | ||||||||||||||||||||||||||||||||||||||||||||||||
 The top performing Small Cap Index stocks year to date are
Now, more recently, over last week, the top performing Small Cap Index stocks on the move are


|
||||||||||||||||||||||||||||||||||||||||||||||||
| 12Stocks.com: Investing in Smallcap Index using Exchange Traded Funds | |
|
The following table shows list of key exchange traded funds (ETF) that
help investors track Smallcap index. The following list also includes leveraged ETF funds that track twice or thrice the daily returns of Smallcap indices. Short or inverse ETF funds move in the opposite direction to the index they track and are useful during market pullbacks or during bear markets. Quick View: Move mouse or cursor over ETF symbol (ticker) to view short-term technical chart and over ETF name to view long term chart. Click on ticker or stock name for detailed view. Click on to add stock symbol to your watchlist and to view watchlist. |
12Stocks.com List of ETFs that track Smallcap Index
| Ticker | ETF Name | Watchlist | Recent Price | Smart Investing & Trading Score | Change % | Week % | Year-to-date % |
| IWM | iShares Russell 2000 | | 193.14 | 23 | 0.16 | -2.79 | -3.77% |
| IJR | iShares Core S&P Small-Cap | | 103.15 | 10 | 0.79 | -1.3 | -4.71% |
| IWN | iShares Russell 2000 Value | | 147.78 | 10 | 0.99 | -1.73 | -4.86% |
| VTWO | Vanguard Russell 2000 ETF | | 78.06 | 23 | 0.14 | -2.81 | -3.75% |
| IWO | iShares Russell 2000 Growth | | 245.01 | 36 | -0.78 | -4.05 | -2.86% |
| IJS | iShares S&P Small-Cap 600 Value | | 95.61 | 17 | 1.16 | -0.58 | -7.24% |
| IJT | iShares S&P Small-Cap 600 Growth | | 121.96 | 23 | 0.32 | -2.26 | -2.54% |
| XSLV | PowerShares S&P SmallCap Low Volatil ETF | | 42.30 | 17 | 1.56 | 0.5 | -4.19% |
| SAA | ProShares Ultra SmallCap600 | | 21.80 | 18 | 0.83 | -3.37 | -12.63% |
| SMLV | SPDR SSGA US Small Cap Low Volatil ETF | | 106.09 | 32 | 2.18 | 1.03 | -5.71% |
| SDD | ProShares UltraShort SmallCap600 | | 20.34 | 76 | -1.69 | 2.57 | 10.38% |
| SBB | ProShares Short SmallCap600 | | 16.84 | 76 | -0.82 | 1.77 | 5.71% |
| 12Stocks.com: Charts, Trends, Fundamental Data and Performances of SmallCap Stocks | |
|
We now take in-depth look at all SmallCap stocks including charts, multi-period performances and overall trends (as measured by Smart Investing & Trading Score). One can sort SmallCap stocks (click link to choose) by Daily, Weekly and by Year-to-Date performances. Also, one can sort by size of the company or by market capitalization. |
| Select Your Default Chart Type: | |||||
| |||||
| Click on stock symbol or name for detailed view. Click on to add stock symbol to your watchlist and to view watchlist. Quick View: Move mouse or cursor over "Daily" to quickly view daily technical stock chart and over "Weekly" to view weekly technical stock chart. | |||||

 | MGTX MeiraGTx Holdings plc |
| Sector: Health Care | |
| SubSector: Biotechnology | |
| MarketCap: 402.885 Millions | |
| Recent Price: 5.09 Smart Investing & Trading Score: 0 | |
| Day Percent Change: 1.60% Day Change: 0.08 | |
| Week Change: -8.45% Year-to-date Change: -27.5% | |
| MGTX Links: Profile News Message Board | |
| Charts:- Daily , Weekly | |
| Add MGTX to Watchlist: View: Get Complete MGTX Trend Analysis ➞ | |
 | STNG Scorpio Tankers Inc. |
| Sector: Transports | |
| SubSector: Shipping | |
| MarketCap: 813.214 Millions | |
| Recent Price: 69.53 Smart Investing & Trading Score: 0 | |
| Day Percent Change: 1.56% Day Change: 1.07 | |
| Week Change: -2.03% Year-to-date Change: 14.4% | |
| STNG Links: Profile News Message Board | |
| Charts:- Daily , Weekly | |
| Add STNG to Watchlist: View: Get Complete STNG Trend Analysis ➞ | |
 | NAT Nordic American Tankers Limited |
| Sector: Transports | |
| SubSector: Shipping | |
| MarketCap: 416.114 Millions | |
| Recent Price: 3.81 Smart Investing & Trading Score: 0 | |
| Day Percent Change: 1.06% Day Change: 0.04 | |
| Week Change: -1.8% Year-to-date Change: -9.3% | |
| NAT Links: Profile News Message Board | |
| Charts:- Daily , Weekly | |
| Add NAT to Watchlist: View: Get Complete NAT Trend Analysis ➞ | |
 | EYPT EyePoint Pharmaceuticals, Inc. |
| Sector: Health Care | |
| SubSector: Biotechnology | |
| MarketCap: 125.085 Millions | |
| Recent Price: 17.66 Smart Investing & Trading Score: 0 | |
| Day Percent Change: 1.00% Day Change: 0.18 | |
| Week Change: -22.83% Year-to-date Change: -23.6% | |
| EYPT Links: Profile News Message Board | |
| Charts:- Daily , Weekly | |
| Add EYPT to Watchlist: View: Get Complete EYPT Trend Analysis ➞ | |
 | TEX Terex Corporation |
| Sector: Industrials | |
| SubSector: Farm & Construction Machinery | |
| MarketCap: 1083.07 Millions | |
| Recent Price: 60.25 Smart Investing & Trading Score: 0 | |
| Day Percent Change: 0.80% Day Change: 0.48 | |
| Week Change: -4.92% Year-to-date Change: 4.9% | |
| TEX Links: Profile News Message Board | |
| Charts:- Daily , Weekly | |
| Add TEX to Watchlist: View: Get Complete TEX Trend Analysis ➞ | |
 | MAC The Macerich Company |
| Sector: Financials | |
| SubSector: REIT - Retail | |
| MarketCap: 1172.54 Millions | |
| Recent Price: 15.29 Smart Investing & Trading Score: 0 | |
| Day Percent Change: 0.79% Day Change: 0.12 | |
| Week Change: -4.91% Year-to-date Change: -0.9% | |
| MAC Links: Profile News Message Board | |
| Charts:- Daily , Weekly | |
| Add MAC to Watchlist: View: Get Complete MAC Trend Analysis ➞ | |
 | CYTK Cytokinetics, Incorporated |
| Sector: Health Care | |
| SubSector: Biotechnology | |
| MarketCap: 654.285 Millions | |
| Recent Price: 67.49 Smart Investing & Trading Score: 0 | |
| Day Percent Change: 0.73% Day Change: 0.49 | |
| Week Change: -5.69% Year-to-date Change: -19.2% | |
| CYTK Links: Profile News Message Board | |
| Charts:- Daily , Weekly | |
| Add CYTK to Watchlist: View: Get Complete CYTK Trend Analysis ➞ | |
 | NVEE NV5 Global, Inc. |
| Sector: Services & Goods | |
| SubSector: Technical Services | |
| MarketCap: 484.91 Millions | |
| Recent Price: 90.02 Smart Investing & Trading Score: 0 | |
| Day Percent Change: 0.63% Day Change: 0.56 | |
| Week Change: -5.07% Year-to-date Change: -19.0% | |
| NVEE Links: Profile News Message Board | |
| Charts:- Daily , Weekly | |
| Add NVEE to Watchlist: View: Get Complete NVEE Trend Analysis ➞ | |
 | AMSWA American Software, Inc. |
| Sector: Technology | |
| SubSector: Application Software | |
| MarketCap: 389.862 Millions | |
| Recent Price: 10.62 Smart Investing & Trading Score: 0 | |
| Day Percent Change: 0.47% Day Change: 0.05 | |
| Week Change: -5.6% Year-to-date Change: -6.0% | |
| AMSWA Links: Profile News Message Board | |
| Charts:- Daily , Weekly | |
| Add AMSWA to Watchlist: View: Get Complete AMSWA Trend Analysis ➞ | |
 | MTW The Manitowoc Company, Inc. |
| Sector: Industrials | |
| SubSector: Farm & Construction Machinery | |
| MarketCap: 373.707 Millions | |
| Recent Price: 12.88 Smart Investing & Trading Score: 0 | |
| Day Percent Change: 0.39% Day Change: 0.05 | |
| Week Change: -5.08% Year-to-date Change: -22.8% | |
| MTW Links: Profile News Message Board | |
| Charts:- Daily , Weekly | |
| Add MTW to Watchlist: View: Get Complete MTW Trend Analysis ➞ | |
 | BATRK The Liberty Braves Group |
| Sector: Services & Goods | |
| SubSector: Broadcasting - TV | |
| MarketCap: 638.363 Millions | |
| Recent Price: 37.27 Smart Investing & Trading Score: 0 | |
| Day Percent Change: 0.32% Day Change: 0.12 | |
| Week Change: -3.27% Year-to-date Change: -5.8% | |
| BATRK Links: Profile News Message Board | |
| Charts:- Daily , Weekly | |
| Add BATRK to Watchlist: View: Get Complete BATRK Trend Analysis ➞ | |
 | HLNE Hamilton Lane Incorporated |
| Sector: Financials | |
| SubSector: Asset Management | |
| MarketCap: 2484.13 Millions | |
| Recent Price: 109.98 Smart Investing & Trading Score: 0 | |
| Day Percent Change: 0.30% Day Change: 0.33 | |
| Week Change: -0.5% Year-to-date Change: -3.1% | |
| HLNE Links: Profile News Message Board | |
| Charts:- Daily , Weekly | |
| Add HLNE to Watchlist: View: Get Complete HLNE Trend Analysis ➞ | |
 | VRRM Verra Mobility Corporation |
| Sector: Services & Goods | |
| SubSector: Security & Protection Services | |
| MarketCap: 1265.03 Millions | |
| Recent Price: 23.51 Smart Investing & Trading Score: 0 | |
| Day Percent Change: 0.30% Day Change: 0.07 | |
| Week Change: -3.69% Year-to-date Change: 2.1% | |
| VRRM Links: Profile News Message Board | |
| Charts:- Daily , Weekly | |
| Add VRRM to Watchlist: View: Get Complete VRRM Trend Analysis ➞ | |
 | ANAB AnaptysBio, Inc. |
| Sector: Health Care | |
| SubSector: Biotechnology | |
| MarketCap: 405.985 Millions | |
| Recent Price: 19.86 Smart Investing & Trading Score: 0 | |
| Day Percent Change: 0.18% Day Change: 0.04 | |
| Week Change: -12.53% Year-to-date Change: -7.3% | |
| ANAB Links: Profile News Message Board | |
| Charts:- Daily , Weekly | |
| Add ANAB to Watchlist: View: Get Complete ANAB Trend Analysis ➞ | |
 | BATRA The Liberty Braves Group |
| Sector: Services & Goods | |
| SubSector: Broadcasting - TV | |
| MarketCap: 18873.5 Millions | |
| Recent Price: 40.13 Smart Investing & Trading Score: 0 | |
| Day Percent Change: 0.00% Day Change: 0.00 | |
| Week Change: -3% Year-to-date Change: -6.2% | |
| BATRA Links: Profile News Message Board | |
| Charts:- Daily , Weekly | |
| Add BATRA to Watchlist: View: Get Complete BATRA Trend Analysis ➞ | |
 | AVXL Anavex Life Sciences Corp. |
| Sector: Health Care | |
| SubSector: Biotechnology | |
| MarketCap: 175.985 Millions | |
| Recent Price: 3.80 Smart Investing & Trading Score: 0 | |
| Day Percent Change: 0.00% Day Change: 0.00 | |
| Week Change: -11.53% Year-to-date Change: -59.2% | |
| AVXL Links: Profile News Message Board | |
| Charts:- Daily , Weekly | |
| Add AVXL to Watchlist: View: Get Complete AVXL Trend Analysis ➞ | |
 | SMMT Summit Therapeutics plc |
| Sector: Health Care | |
| SubSector: Biotechnology | |
| MarketCap: 156.985 Millions | |
| Recent Price: 3.51 Smart Investing & Trading Score: 0 | |
| Day Percent Change: 0.00% Day Change: 0.00 | |
| Week Change: -4.23% Year-to-date Change: 34.5% | |
| SMMT Links: Profile News Message Board | |
| Charts:- Daily , Weekly | |
| Add SMMT to Watchlist: View: Get Complete SMMT Trend Analysis ➞ | |
 | SVRA Savara Inc. |
| Sector: Health Care | |
| SubSector: Biotechnology | |
| MarketCap: 80.3785 Millions | |
| Recent Price: 4.81 Smart Investing & Trading Score: 0 | |
| Day Percent Change: 0.00% Day Change: 0.00 | |
| Week Change: -5.13% Year-to-date Change: 2.3% | |
| SVRA Links: Profile News Message Board | |
| Charts:- Daily , Weekly | |
| Add SVRA to Watchlist: View: Get Complete SVRA Trend Analysis ➞ | |
 | CRDO Credo Technology Group Holding Ltd |
| Sector: Technology | |
| SubSector: Communication Equipment | |
| MarketCap: 2590 Millions | |
| Recent Price: 17.02 Smart Investing & Trading Score: 0 | |
| Day Percent Change: -7.78% Day Change: -1.43 | |
| Week Change: -20.62% Year-to-date Change: -13.0% | |
| CRDO Links: Profile News Message Board | |
| Charts:- Daily , Weekly | |
| Add CRDO to Watchlist: View: Get Complete CRDO Trend Analysis ➞ | |
 | NVTS Navitas Semiconductor Corporation |
| Sector: Technology | |
| SubSector: Semiconductors | |
| MarketCap: 1790 Millions | |
| Recent Price: 3.68 Smart Investing & Trading Score: 0 | |
| Day Percent Change: -7.77% Day Change: -0.31 | |
| Week Change: -14.81% Year-to-date Change: -54.7% | |
| NVTS Links: Profile News Message Board | |
| Charts:- Daily , Weekly | |
| Add NVTS to Watchlist: View: Get Complete NVTS Trend Analysis ➞ | |
 | BMEA Biomea Fusion, Inc. |
| Sector: Health Care | |
| SubSector: Biotechnology | |
| MarketCap: 818 Millions | |
| Recent Price: 10.45 Smart Investing & Trading Score: 0 | |
| Day Percent Change: -7.73% Day Change: -0.88 | |
| Week Change: -19.49% Year-to-date Change: -28.6% | |
| BMEA Links: Profile News Message Board | |
| Charts:- Daily , Weekly | |
| Add BMEA to Watchlist: View: Get Complete BMEA Trend Analysis ➞ | |
 | TELA TELA Bio, Inc. |
| Sector: Health Care | |
| SubSector: Medical Appliances & Equipment | |
| MarketCap: 81.808 Millions | |
| Recent Price: 4.76 Smart Investing & Trading Score: 0 | |
| Day Percent Change: -7.57% Day Change: -0.39 | |
| Week Change: -3.25% Year-to-date Change: -28.1% | |
| TELA Links: Profile News Message Board | |
| Charts:- Daily , Weekly | |
| Add TELA to Watchlist: View: Get Complete TELA Trend Analysis ➞ | |
 | BHVN Biohaven Pharmaceutical Holding Company Ltd. |
| Sector: Health Care | |
| SubSector: Biotechnology | |
| MarketCap: 2024.25 Millions | |
| Recent Price: 38.99 Smart Investing & Trading Score: 0 | |
| Day Percent Change: -7.52% Day Change: -3.17 | |
| Week Change: -26.54% Year-to-date Change: -8.9% | |
| BHVN Links: Profile News Message Board | |
| Charts:- Daily , Weekly | |
| Add BHVN to Watchlist: View: Get Complete BHVN Trend Analysis ➞ | |
 | MQ Marqeta, Inc. |
| Sector: Technology | |
| SubSector: Software - Infrastructure | |
| MarketCap: 2650 Millions | |
| Recent Price: 5.21 Smart Investing & Trading Score: 0 | |
| Day Percent Change: -7.30% Day Change: -0.41 | |
| Week Change: -4.32% Year-to-date Change: -26.0% | |
| MQ Links: Profile News Message Board | |
| Charts:- Daily , Weekly | |
| Add MQ to Watchlist: View: Get Complete MQ Trend Analysis ➞ | |
 | CVRX CVRx, Inc. |
| Sector: Health Care | |
| SubSector: Medical Devices | |
| MarketCap: 327 Millions | |
| Recent Price: 14.72 Smart Investing & Trading Score: 0 | |
| Day Percent Change: -7.01% Day Change: -1.11 | |
| Week Change: -14.57% Year-to-date Change: -53.2% | |
| CVRX Links: Profile News Message Board | |
| Charts:- Daily , Weekly | |
| Add CVRX to Watchlist: View: Get Complete CVRX Trend Analysis ➞ | |
| Too many stocks? View smallcap stocks filtered by marketcap & sector |
| Marketcap: All SmallCap Stocks (default-no microcap), Large, Mid-Range, Small & MicroCap |
| Sector: Tech, Finance, Energy, Staples, Retail, Industrial, Materials, Utilities & Medical |
|
Best Stocks Today 12Stocks.com |
© 2024 12Stocks.com Terms & Conditions Privacy Contact Us
All Information Provided Only For Education And Not To Be Used For Investing or Trading. See Terms & Conditions


One More Thing ... Get Best Stocks Delivered Daily!
Never Ever Miss A Move With Our Top Ten Stocks Lists
Find Best Stocks In Any Market - Bull or Bear Market
Take A Peek At Our Top Ten Stocks Lists: Daily, Weekly, Year-to-Date & Top Trends
Find Best Stocks In Any Market - Bull or Bear Market
Take A Peek At Our Top Ten Stocks Lists: Daily, Weekly, Year-to-Date & Top Trends
Smallcap Stocks With Best Up Trends [0-bearish to 100-bullish]: Humacyte [100], Old Second[100], Gannett Co[100], Tejon Ranch[100], Cricut [100], Victory Capital[100], United Fire[100], Century Aluminum[100], Portland General[100], Lantheus [100], Oscar Health[100]
Best Smallcap Stocks Year-to-Date:
Agenus [540.17%], CareMax [423.71%], Janux [336.95%], Viking [240.57%], Alpine Immune[238.42%], Longboard [194.11%], Arcutis Bio[181.42%], Avidity Biosciences[153.65%], Super Micro[151.19%], Vera [138.18%], Stoke [129.66%] Best Smallcap Stocks This Week:
Macatawa Bank[46.82%], Vertex Energy[43.27%], Snap One[29.61%], Vanda [24.03%], Humacyte [23.78%], ALX Oncology[22.49%], ContextLogic [20%], ProKidney [16.57%], Calavo Growers[16.33%], Badger Meter[15.61%], Accolade [13.45%] Best Smallcap Stocks Daily:
Tellurian [28.11%], Origin Materials[20.44%], Metropolitan Bank[18.01%], Vertex Energy[13.74%], Genelux [10.37%], Emergent BioSolutions[10.22%], Gevo [10.14%], Riot Blockchain[10.07%], Humacyte [9.86%], Marathon Patent[9.78%], Fossil Group[9.64%]