
 Login Sign Up


| |||||
 |  | ||||

| 12Stocks.com Market Intelligence |
Best SmallCap Stocks
|
| In a hurry? Small Cap Stock Lists: Performance Trends Table, Stock Charts
Sort Small Cap stocks: Daily, Weekly, Year-to-Date, Market Cap & Trends. Filter Small Cap stocks list by sector: Show all, Tech, Finance, Energy, Staples, Retail, Industrial, Materials, Utilities and HealthCare Filter Small Cap stocks list by size: All Large Medium Small and MicroCap |
| 12Stocks.com Small Cap Stocks Performances & Trends Daily | |||||||||
|
|  The overall Smart Investing & Trading Score is 75 (0-bearish to 100-bullish) which puts Small Cap index in short term neutral to bullish trend. The Smart Investing & Trading Score from previous trading session is 70 and hence an improvement of trend.
| ||||||||
Here are the Smart Investing & Trading Scores of the most requested small cap stocks at 12Stocks.com (click stock name for detailed review):
|


| 12Stocks.com: Investing in Smallcap Index with Stocks | |
|
The following table helps investors and traders sort through current performance and trends (as measured by Smart Investing & Trading Score) of various
stocks in the Smallcap Index. Quick View: Move mouse or cursor over stock symbol (ticker) to view short-term technical chart and over stock name to view long term chart. Click on  to add stock symbol to your watchlist and to add stock symbol to your watchlist and  to view watchlist. Click on any ticker or stock name for detailed market intelligence report for that stock. to view watchlist. Click on any ticker or stock name for detailed market intelligence report for that stock. |
12Stocks.com Performance of Stocks in Smallcap Index
| Ticker | Stock Name | Watchlist | Category | Recent Price | Smart Investing & Trading Score | Change % | YTD Change% |
| MLP | Maui Land |   | Financials | 20.31 | 85 | -0.44% | 27.82% |
| PLAB | Photronics | | Technology | 29.33 | 85 | -0.17% | -6.50% |
| GBIO | Generation Bio | | Health Care | 3.26 | 83 | 5.16% | 97.58% |
| SG | Sweetgreen | | Services & Goods | 23.89 | 83 | 2.73% | 111.37% |
| MGY | Magnolia Oil | | Energy | 26.47 | 83 | 2.28% | 24.33% |
| GERN | Geron | | Health Care | 3.88 | 83 | 1.84% | 83.89% |
| USCB | USCB Financial | | Financials | 12.28 | 83 | 1.15% | 0.00% |
| SAH | Sonic Automotive | | Services & Goods | 58.50 | 83 | 0.79% | 4.07% |
| ARRY | Array | | Technology | 12.51 | 83 | 0.00% | -25.54% |
| METCB | Ramaco Resources | | Materials | 11.66 | 83 | -6.65% | -12.00% |
| ORGN | Origin Materials | | Materials | 1.14 | 83 | -5.79% | 35.25% |
| GCBC | Greene County | | Financials | 29.86 | 83 | -4.54% | 5.89% |
| SMTC | Semtech | | Technology | 39.00 | 83 | -4.53% | 78.00% |
| KIND | Nextdoor | | Services & Goods | 2.36 | 83 | -4.07% | 27.57% |
| SMMT | Summit | | Health Care | 4.78 | 83 | -3.63% | 83.14% |
| IVAC | Intevac | | Technology | 4.17 | 83 | -2.11% | -3.47% |
| TRTX | TPG RE | | Financials | 8.72 | 83 | -1.02% | 34.15% |
| MCBC | Macatawa Bank | | Financials | 14.43 | 83 | -0.41% | 27.93% |
| EVER | EverQuote | | Financials | 23.73 | 83 | -0.38% | 93.87% |
| NGVC | Natural Grocers | | Services & Goods | 17.83 | 83 | -0.34% | 11.44% |
| DAN | Dana | | Consumer Staples | 13.58 | 83 | -0.22% | -7.05% |
| PRA | ProAssurance | | Financials | 14.70 | 83 | -0.14% | 6.60% |
| SMPL | Simply Good | | Consumer Staples | 37.27 | 83 | -0.04% | -5.87% |
| STOK | Stoke | | Health Care | 12.03 | 83 | 3.71% | 128.71% |
| OXM | Oxford Industries | | Consumer Staples | 110.08 | 83 | 3.14% | 10.08% |


| Too many stocks? View smallcap stocks filtered by marketcap & sector |
| Marketcap: All SmallCap Stocks (default-no microcap), Large, Mid-Range, Small |
| Smallcap Sector: Tech, Finance, Energy, Staples, Retail, Industrial, Materials, & Medical |
|
Get the most comprehensive stock market coverage daily at 12Stocks.com ➞ Best Stocks Today ➞ Best Stocks Weekly ➞ Best Stocks Year-to-Date ➞ Best Stocks Trends ➞  Best Stocks Today 12Stocks.com Best Nasdaq Stocks ➞ Best S&P 500 Stocks ➞ Best Tech Stocks ➞ Best Biotech Stocks ➞ |
| Detailed Overview of SmallCap Stocks |
| SmallCap Technical Overview, Leaders & Laggards, Top SmallCap ETF Funds & Detailed SmallCap Stocks List, Charts, Trends & More |
| Smallcap: Technical Analysis, Trends & YTD Performance | |
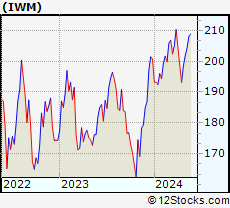
| SmallCap segment as represented by
IWM, an exchange-traded fund [ETF], holds basket of thousands of smallcap stocks from across all major sectors of the US stock market. The smallcap index (contains stocks like Riverbed & Sotheby's) is up by 2.57% and is currently underperforming the overall market by -6.11% year-to-date. Below is a quick view of technical charts and trends: | |
 IWM Weekly Chart |
|
| Long Term Trend: Very Good | |
| Medium Term Trend: Very Good | |
 IWM Daily Chart |
|
| Short Term Trend: Very Good | |
| Overall Trend Score: 75 | |
| YTD Performance: 2.57% | |
| **Trend Scores & Views Are Only For Educational Purposes And Not For Investing | |
| 12Stocks.com: Top Performing Small Cap Index Stocks | ||||||||||||||||||||||||||||||||||||||||||||||||
 The top performing Small Cap Index stocks year to date are
Now, more recently, over last week, the top performing Small Cap Index stocks on the move are


|
||||||||||||||||||||||||||||||||||||||||||||||||
| 12Stocks.com: Investing in Smallcap Index using Exchange Traded Funds | |
|
The following table shows list of key exchange traded funds (ETF) that
help investors track Smallcap index. The following list also includes leveraged ETF funds that track twice or thrice the daily returns of Smallcap indices. Short or inverse ETF funds move in the opposite direction to the index they track and are useful during market pullbacks or during bear markets. Quick View: Move mouse or cursor over ETF symbol (ticker) to view short-term technical chart and over ETF name to view long term chart. Click on ticker or stock name for detailed view. Click on to add stock symbol to your watchlist and to view watchlist. |
12Stocks.com List of ETFs that track Smallcap Index
| Ticker | ETF Name | Watchlist | Recent Price | Smart Investing & Trading Score | Change % | Week % | Year-to-date % |
| IWM | iShares Russell 2000 | | 205.86 | 75 | 1.02 | 1.96 | 2.57% |
| IJR | iShares Core S&P Small-Cap | | 109.56 | 88 | 1.20 | 2.27 | 1.21% |
| VTWO | Vanguard Russell 2000 ETF | | 83.19 | 70 | 0.96 | 1.94 | 2.58% |
| IWN | iShares Russell 2000 Value | | 157.15 | 88 | 1.15 | 1.91 | 1.17% |
| IWO | iShares Russell 2000 Growth | | 261.92 | 52 | 0.70 | 1.97 | 3.85% |
| IJS | iShares S&P Small-Cap 600 Value | | 100.98 | 70 | 1.18 | 2.29 | -2.03% |
| IJT | iShares S&P Small-Cap 600 Growth | | 130.53 | 83 | 1.19 | 2.16 | 4.3% |
| XSLV | PowerShares S&P SmallCap Low Volatil ETF | | 44.31 | 95 | 0.71 | 2.52 | 0.36% |
| SMLV | SPDR SSGA US Small Cap Low Volatil ETF | | 111.76 | 88 | 1.31 | 1.89 | -0.68% |
| SAA | ProShares Ultra SmallCap600 | | 24.45 | 83 | 1.00 | 3.64 | -2.01% |
| SBB | ProShares Short SmallCap600 | | 15.88 | 18 | -1.24 | -1.73 | -0.31% |
| SDD | ProShares UltraShort SmallCap600 | | 18.25 | 28 | -2.22 | -3.18 | -0.98% |
| 12Stocks.com: Charts, Trends, Fundamental Data and Performances of SmallCap Stocks | |
|
We now take in-depth look at all SmallCap stocks including charts, multi-period performances and overall trends (as measured by Smart Investing & Trading Score). One can sort SmallCap stocks (click link to choose) by Daily, Weekly and by Year-to-Date performances. Also, one can sort by size of the company or by market capitalization. |
| Select Your Default Chart Type: | |||||
| |||||
| Click on stock symbol or name for detailed view. Click on to add stock symbol to your watchlist and to view watchlist. Quick View: Move mouse or cursor over "Daily" to quickly view daily technical stock chart and over "Weekly" to view weekly technical stock chart. | |||||

 | MLP Maui Land & Pineapple Company, Inc. |
| Sector: Financials | |
| SubSector: Real Estate Development | |
| MarketCap: 186.619 Millions | |
| Recent Price: 20.31 Smart Investing & Trading Score: 85 | |
| Day Percent Change: -0.44% Day Change: -0.09 | |
| Week Change: 0.94% Year-to-date Change: 27.8% | |
| MLP Links: Profile News Message Board | |
| Charts:- Daily , Weekly | |
| Add MLP to Watchlist: View: Get Complete MLP Trend Analysis ➞ | |
 | PLAB Photronics, Inc. |
| Sector: Technology | |
| SubSector: Semiconductor Equipment & Materials | |
| MarketCap: 709.018 Millions | |
| Recent Price: 29.33 Smart Investing & Trading Score: 85 | |
| Day Percent Change: -0.17% Day Change: -0.05 | |
| Week Change: 1.91% Year-to-date Change: -6.5% | |
| PLAB Links: Profile News Message Board | |
| Charts:- Daily , Weekly | |
| Add PLAB to Watchlist: View: Get Complete PLAB Trend Analysis ➞ | |
 | GBIO Generation Bio Co. |
| Sector: Health Care | |
| SubSector: Biotechnology | |
| MarketCap: 17487 Millions | |
| Recent Price: 3.26 Smart Investing & Trading Score: 83 | |
| Day Percent Change: 5.16% Day Change: 0.16 | |
| Week Change: 2.52% Year-to-date Change: 97.6% | |
| GBIO Links: Profile News Message Board | |
| Charts:- Daily , Weekly | |
| Add GBIO to Watchlist: View: Get Complete GBIO Trend Analysis ➞ | |
 | SG Sweetgreen, Inc. |
| Sector: Services & Goods | |
| SubSector: Restaurants | |
| MarketCap: 1420 Millions | |
| Recent Price: 23.89 Smart Investing & Trading Score: 83 | |
| Day Percent Change: 2.73% Day Change: 0.64 | |
| Week Change: 8.08% Year-to-date Change: 111.4% | |
| SG Links: Profile News Message Board | |
| Charts:- Daily , Weekly | |
| Add SG to Watchlist: View: Get Complete SG Trend Analysis ➞ | |
 | MGY Magnolia Oil & Gas Corporation |
| Sector: Energy | |
| SubSector: Independent Oil & Gas | |
| MarketCap: 1088.93 Millions | |
| Recent Price: 26.47 Smart Investing & Trading Score: 83 | |
| Day Percent Change: 2.28% Day Change: 0.59 | |
| Week Change: 5.42% Year-to-date Change: 24.3% | |
| MGY Links: Profile News Message Board | |
| Charts:- Daily , Weekly | |
| Add MGY to Watchlist: View: Get Complete MGY Trend Analysis ➞ | |
 | GERN Geron Corporation |
| Sector: Health Care | |
| SubSector: Biotechnology | |
| MarketCap: 228.685 Millions | |
| Recent Price: 3.88 Smart Investing & Trading Score: 83 | |
| Day Percent Change: 1.84% Day Change: 0.07 | |
| Week Change: -1.27% Year-to-date Change: 83.9% | |
| GERN Links: Profile News Message Board | |
| Charts:- Daily , Weekly | |
| Add GERN to Watchlist: View: Get Complete GERN Trend Analysis ➞ | |
 | USCB USCB Financial Holdings, Inc. |
| Sector: Financials | |
| SubSector: Banks - Regional | |
| MarketCap: 198 Millions | |
| Recent Price: 12.28 Smart Investing & Trading Score: 83 | |
| Day Percent Change: 1.15% Day Change: 0.14 | |
| Week Change: 3.11% Year-to-date Change: 0.0% | |
| USCB Links: Profile News Message Board | |
| Charts:- Daily , Weekly | |
| Add USCB to Watchlist: View: Get Complete USCB Trend Analysis ➞ | |
 | SAH Sonic Automotive, Inc. |
| Sector: Services & Goods | |
| SubSector: Auto Dealerships | |
| MarketCap: 581.321 Millions | |
| Recent Price: 58.50 Smart Investing & Trading Score: 83 | |
| Day Percent Change: 0.79% Day Change: 0.46 | |
| Week Change: 3.67% Year-to-date Change: 4.1% | |
| SAH Links: Profile News Message Board | |
| Charts:- Daily , Weekly | |
| Add SAH to Watchlist: View: Get Complete SAH Trend Analysis ➞ | |
 | ARRY Array Technologies, Inc. |
| Sector: Technology | |
| SubSector: Solar | |
| MarketCap: 45887 Millions | |
| Recent Price: 12.51 Smart Investing & Trading Score: 83 | |
| Day Percent Change: 0.00% Day Change: 0.00 | |
| Week Change: -7.06% Year-to-date Change: -25.5% | |
| ARRY Links: Profile News Message Board | |
| Charts:- Daily , Weekly | |
| Add ARRY to Watchlist: View: Get Complete ARRY Trend Analysis ➞ | |
 | METCB Ramaco Resources, Inc. |
| Sector: Materials | |
| SubSector: Coking Coal | |
| MarketCap: 469 Millions | |
| Recent Price: 11.66 Smart Investing & Trading Score: 83 | |
| Day Percent Change: -6.65% Day Change: -0.83 | |
| Week Change: 5.14% Year-to-date Change: -12.0% | |
| METCB Links: Profile News Message Board | |
| Charts:- Daily , Weekly | |
| Add METCB to Watchlist: View: Get Complete METCB Trend Analysis ➞ | |
 | ORGN Origin Materials, Inc. |
| Sector: Materials | |
| SubSector: Chemicals | |
| MarketCap: 586 Millions | |
| Recent Price: 1.14 Smart Investing & Trading Score: 83 | |
| Day Percent Change: -5.79% Day Change: -0.07 | |
| Week Change: -2.56% Year-to-date Change: 35.3% | |
| ORGN Links: Profile News Message Board | |
| Charts:- Daily , Weekly | |
| Add ORGN to Watchlist: View: Get Complete ORGN Trend Analysis ➞ | |
 | GCBC Greene County Bancorp, Inc. |
| Sector: Financials | |
| SubSector: Savings & Loans | |
| MarketCap: 314.83 Millions | |
| Recent Price: 29.86 Smart Investing & Trading Score: 83 | |
| Day Percent Change: -4.54% Day Change: -1.42 | |
| Week Change: -3.86% Year-to-date Change: 5.9% | |
| GCBC Links: Profile News Message Board | |
| Charts:- Daily , Weekly | |
| Add GCBC to Watchlist: View: Get Complete GCBC Trend Analysis ➞ | |
 | SMTC Semtech Corporation |
| Sector: Technology | |
| SubSector: Semiconductor - Integrated Circuits | |
| MarketCap: 2285 Millions | |
| Recent Price: 39.00 Smart Investing & Trading Score: 83 | |
| Day Percent Change: -4.53% Day Change: -1.85 | |
| Week Change: -0.03% Year-to-date Change: 78.0% | |
| SMTC Links: Profile News Message Board | |
| Charts:- Daily , Weekly | |
| Add SMTC to Watchlist: View: Get Complete SMTC Trend Analysis ➞ | |
 | KIND Nextdoor Holdings, Inc. |
| Sector: Services & Goods | |
| SubSector: Internet Content & Information | |
| MarketCap: 1170 Millions | |
| Recent Price: 2.36 Smart Investing & Trading Score: 83 | |
| Day Percent Change: -4.07% Day Change: -0.10 | |
| Week Change: 9.72% Year-to-date Change: 27.6% | |
| KIND Links: Profile News Message Board | |
| Charts:- Daily , Weekly | |
| Add KIND to Watchlist: View: Get Complete KIND Trend Analysis ➞ | |
 | SMMT Summit Therapeutics plc |
| Sector: Health Care | |
| SubSector: Biotechnology | |
| MarketCap: 156.985 Millions | |
| Recent Price: 4.78 Smart Investing & Trading Score: 83 | |
| Day Percent Change: -3.63% Day Change: -0.18 | |
| Week Change: 8.88% Year-to-date Change: 83.1% | |
| SMMT Links: Profile News Message Board | |
| Charts:- Daily , Weekly | |
| Add SMMT to Watchlist: View: Get Complete SMMT Trend Analysis ➞ | |
 | IVAC Intevac, Inc. |
| Sector: Technology | |
| SubSector: Diversified Electronics | |
| MarketCap: 89.2396 Millions | |
| Recent Price: 4.17 Smart Investing & Trading Score: 83 | |
| Day Percent Change: -2.11% Day Change: -0.09 | |
| Week Change: -2.11% Year-to-date Change: -3.5% | |
| IVAC Links: Profile News Message Board | |
| Charts:- Daily , Weekly | |
| Add IVAC to Watchlist: View: Get Complete IVAC Trend Analysis ➞ | |
 | TRTX TPG RE Finance Trust, Inc. |
| Sector: Financials | |
| SubSector: Mortgage Investment | |
| MarketCap: 607.739 Millions | |
| Recent Price: 8.72 Smart Investing & Trading Score: 83 | |
| Day Percent Change: -1.02% Day Change: -0.09 | |
| Week Change: 4.31% Year-to-date Change: 34.2% | |
| TRTX Links: Profile News Message Board | |
| Charts:- Daily , Weekly | |
| Add TRTX to Watchlist: View: Get Complete TRTX Trend Analysis ➞ | |
 | MCBC Macatawa Bank Corporation |
| Sector: Financials | |
| SubSector: Regional - Midwest Banks | |
| MarketCap: 264.37 Millions | |
| Recent Price: 14.43 Smart Investing & Trading Score: 83 | |
| Day Percent Change: -0.41% Day Change: -0.06 | |
| Week Change: 0.07% Year-to-date Change: 27.9% | |
| MCBC Links: Profile News Message Board | |
| Charts:- Daily , Weekly | |
| Add MCBC to Watchlist: View: Get Complete MCBC Trend Analysis ➞ | |
 | EVER EverQuote, Inc. |
| Sector: Financials | |
| SubSector: Regional - Southeast Banks | |
| MarketCap: 767.135 Millions | |
| Recent Price: 23.73 Smart Investing & Trading Score: 83 | |
| Day Percent Change: -0.38% Day Change: -0.09 | |
| Week Change: 9.1% Year-to-date Change: 93.9% | |
| EVER Links: Profile News Message Board | |
| Charts:- Daily , Weekly | |
| Add EVER to Watchlist: View: Get Complete EVER Trend Analysis ➞ | |
 | NGVC Natural Grocers by Vitamin Cottage, Inc. |
| Sector: Services & Goods | |
| SubSector: Grocery Stores | |
| MarketCap: 185.475 Millions | |
| Recent Price: 17.83 Smart Investing & Trading Score: 83 | |
| Day Percent Change: -0.34% Day Change: -0.06 | |
| Week Change: 2.59% Year-to-date Change: 11.4% | |
| NGVC Links: Profile News Message Board | |
| Charts:- Daily , Weekly | |
| Add NGVC to Watchlist: View: Get Complete NGVC Trend Analysis ➞ | |
 | DAN Dana Incorporated |
| Sector: Consumer Staples | |
| SubSector: Auto Parts | |
| MarketCap: 1052.59 Millions | |
| Recent Price: 13.58 Smart Investing & Trading Score: 83 | |
| Day Percent Change: -0.22% Day Change: -0.03 | |
| Week Change: 2.03% Year-to-date Change: -7.1% | |
| DAN Links: Profile News Message Board | |
| Charts:- Daily , Weekly | |
| Add DAN to Watchlist: View: Get Complete DAN Trend Analysis ➞ | |
 | PRA ProAssurance Corporation |
| Sector: Financials | |
| SubSector: Accident & Health Insurance | |
| MarketCap: 1434.6 Millions | |
| Recent Price: 14.70 Smart Investing & Trading Score: 83 | |
| Day Percent Change: -0.14% Day Change: -0.02 | |
| Week Change: 6.29% Year-to-date Change: 6.6% | |
| PRA Links: Profile News Message Board | |
| Charts:- Daily , Weekly | |
| Add PRA to Watchlist: View: Get Complete PRA Trend Analysis ➞ | |
 | SMPL The Simply Good Foods Company |
| Sector: Consumer Staples | |
| SubSector: Food - Major Diversified | |
| MarketCap: 1501.63 Millions | |
| Recent Price: 37.27 Smart Investing & Trading Score: 83 | |
| Day Percent Change: -0.04% Day Change: -0.02 | |
| Week Change: -0.17% Year-to-date Change: -5.9% | |
| SMPL Links: Profile News Message Board | |
| Charts:- Daily , Weekly | |
| Add SMPL to Watchlist: View: Get Complete SMPL Trend Analysis ➞ | |
 | STOK Stoke Therapeutics, Inc. |
| Sector: Health Care | |
| SubSector: Biotechnology | |
| MarketCap: 772.485 Millions | |
| Recent Price: 12.03 Smart Investing & Trading Score: 83 | |
| Day Percent Change: 3.71% Day Change: 0.43 | |
| Week Change: 0.08% Year-to-date Change: 128.7% | |
| STOK Links: Profile News Message Board | |
| Charts:- Daily , Weekly | |
| Add STOK to Watchlist: View: Get Complete STOK Trend Analysis ➞ | |
 | OXM Oxford Industries, Inc. |
| Sector: Consumer Staples | |
| SubSector: Textile - Apparel Clothing | |
| MarketCap: 647.665 Millions | |
| Recent Price: 110.08 Smart Investing & Trading Score: 83 | |
| Day Percent Change: 3.14% Day Change: 3.35 | |
| Week Change: 1.16% Year-to-date Change: 10.1% | |
| OXM Links: Profile News Message Board | |
| Charts:- Daily , Weekly | |
| Add OXM to Watchlist: View: Get Complete OXM Trend Analysis ➞ | |
| Too many stocks? View smallcap stocks filtered by marketcap & sector |
| Marketcap: All SmallCap Stocks (default-no microcap), Large, Mid-Range, Small & MicroCap |
| Sector: Tech, Finance, Energy, Staples, Retail, Industrial, Materials, Utilities & Medical |
|
Best Stocks Today 12Stocks.com |
© 2024 12Stocks.com Terms & Conditions Privacy Contact Us
All Information Provided Only For Education And Not To Be Used For Investing or Trading. See Terms & Conditions


One More Thing ... Get Best Stocks Delivered Daily!
Never Ever Miss A Move With Our Top Ten Stocks Lists
Find Best Stocks In Any Market - Bull or Bear Market
Take A Peek At Our Top Ten Stocks Lists: Daily, Weekly, Year-to-Date & Top Trends
Find Best Stocks In Any Market - Bull or Bear Market
Take A Peek At Our Top Ten Stocks Lists: Daily, Weekly, Year-to-Date & Top Trends
Smallcap Stocks With Best Up Trends [0-bearish to 100-bullish]: Consensus Cloud[100], BRC [100], SiTime [100], Telephone and[100], PlayAGS [100], Vital Farms[100], Blue Bird[100], Warby Parker[100], Bakkt [100], Mayville Engineering[100], Red Violet[100]
Best Smallcap Stocks Year-to-Date:
CareMax [520.62%], Janux [383.39%], Bakkt [359.64%], Viking [330.95%], Longboard [259.9%], Alpine Immune[240.44%], Avidity Biosciences[199.78%], Super Micro[181.33%], Vera [173.45%], Cullinan Oncology[166.5%], Arcutis Bio[155.26%] Best Smallcap Stocks This Week:
Innodata [71.13%], DASAN Zhone[65.26%], Bakkt [53.44%], Perficient [52.94%], BRC [45.38%], Children s[45.24%], Consensus Cloud[44.87%], Latham Group[41.03%], Embecta [38.01%], Cricut [37.17%], Telephone and[37.05%] Best Smallcap Stocks Daily:
Embecta [37.88%], Seres [37.44%], Consensus Cloud[36.05%], BRC [31.22%], SiTime [28.79%], Telephone and[28.63%], PlayAGS [28.57%], Vital Farms[26.95%], Blue Bird[24.45%], Noodles & [24.28%], Compass [23.78%]