
 Login Sign Up


| |||||
 |  | ||||

| 12Stocks.com Market Intelligence |
Best Healthcare Stocks
 | "Discover best trending healthcare stocks with 12Stocks.com." |
| - Subu Vdaygiri, Founder, 12Stocks.com |
| In a hurry? Healthcare Stocks Lists: Performance Trends Table, Stock Charts
Sort Healthcare stocks: Daily, Weekly, Year-to-Date, Market Cap & Trends. Filter Healthcare stocks list by size:All Healthcare Large Mid-Range Small |
| 12Stocks.com Healthcare Stocks Performances & Trends Daily | |||||||||
|
|  The overall Smart Investing & Trading Score is 83 (0-bearish to 100-bullish) which puts Healthcare sector in short term bullish trend. The Smart Investing & Trading Score from previous trading session is 88 and hence a deterioration of trend.
| ||||||||
Here are the Smart Investing & Trading Scores of the most requested Healthcare stocks at 12Stocks.com (click stock name for detailed review):
|


| 12Stocks.com: Investing in Healthcare sector with Stocks | |
|
The following table helps investors and traders sort through current performance and trends (as measured by Smart Investing & Trading Score) of various
stocks in the Healthcare sector. Quick View: Move mouse or cursor over stock symbol (ticker) to view short-term Technical chart and over stock name to view long term chart. Click on  to add stock symbol to your watchlist and to add stock symbol to your watchlist and  to view watchlist. Click on any ticker or stock name for detailed market intelligence report for that stock. to view watchlist. Click on any ticker or stock name for detailed market intelligence report for that stock. |
12Stocks.com Performance of Stocks in Healthcare Sector
| Ticker | Stock Name | Watchlist | Category | Recent Price | Smart Investing & Trading Score | Change % | Weekly Change% |
| DNLI | Denali |   | Biotechnology | 20.13 | 61 | -1.85% | -1.85% |
| CHRS | Coherus BioSciences | | Biotechnology | 2.08 | 15 | -1.89% | -1.89% |
| SPRO | Spero | | Biotechnology | 1.56 | 0 | -1.89% | -1.89% |
| BBIO | BridgeBio Pharma | | Biotechnology | 29.52 | 25 | -1.89% | -1.89% |
| MLTX | MoonLake Immuno | | Biotechnology | 39.00 | 10 | -1.89% | -1.89% |
| BTMD | biote | | Medical Care Facilities | 5.64 | 10 | -1.91% | -1.91% |
| PTN | Palatin Technologies | | Biotechnology | 2.04 | 61 | -1.92% | -1.92% |
| AVTE | Aerovate | | Biotechnology | 20.17 | 7 | -1.94% | -1.94% |
| SLRN | Acelyrin | | Biotechnology | 4.30 | 20 | -1.94% | -1.94% |
| RPTX | Repare | | Biotechnology | 3.48 | 25 | -1.97% | -1.97% |
| TLRY | Tilray | | Pharmaceutical | 1.94 | 26 | -2.02% | -2.02% |
| IART | Integra LifeSciences | | Instruments | 26.98 | 35 | -2.03% | -2.03% |
| PRQR | ProQR | | Biotechnology | 1.92 | 10 | -2.04% | -2.04% |
| TBPH | Theravance Biopharma | | Biotechnology | 9.10 | 0 | -2.05% | -2.05% |
| GERN | Geron | | Biotechnology | 3.73 | 36 | -2.10% | -2.10% |
| IKNA | Ikena Oncology | | Biotechnology | 1.40 | 64 | -2.10% | -2.10% |
| PRTC | PureTech Health | | Biotechnology | 27.90 | 44 | -2.11% | -2.11% |
| JNJ | Johnson & Johnson | | Pharmaceutical | 151.27 | 42 | -2.18% | -2.18% |
| VVOS | Vivos | | Medical Devices | 2.24 | 30 | -2.18% | -2.18% |
| LNSR | LENSAR | | Medical Devices | 4.03 | 42 | -2.18% | -2.18% |
| FNA | Paragon 28 | | Medical Devices | 7.49 | 10 | -2.22% | -2.22% |
| ILMN | Illumina | | Biotechnology | 108.53 | 0 | -2.29% | -2.29% |
| CTKB | Cytek Biosciences | | Medical Devices | 5.96 | 10 | -2.30% | -2.30% |
| OSCR | Oscar Health | | Healthcare Plans | 22.00 | 70 | -2.31% | -2.31% |
| IVA | Inventiva S.A | | Biotechnology | 3.71 | 75 | -2.32% | -2.32% |
| For chart view version of above stock list: Chart View ➞ 0 - 25 , 25 - 50 , 50 - 75 , 75 - 100 , 100 - 125 , 125 - 150 , 150 - 175 , 175 - 200 , 200 - 225 , 225 - 250 , 250 - 275 , 275 - 300 , 300 - 325 , 325 - 350 , 350 - 375 , 375 - 400 , 400 - 425 , 425 - 450 , 450 - 475 , 475 - 500 , 500 - 525 , 525 - 550 , 550 - 575 , 575 - 600 , 600 - 625 , 625 - 650 , 650 - 675 , 675 - 700 , 700 - 725 | ||
 | Click To Change The Sort Order: By Market Cap or Company Size Performance: Year-to-date, Week and Day |  |
|
Get the most comprehensive stock market coverage daily at 12Stocks.com ➞ Best Stocks Today ➞ Best Stocks Weekly ➞ Best Stocks Year-to-Date ➞ Best Stocks Trends ➞  Best Stocks Today 12Stocks.com Best Nasdaq Stocks ➞ Best S&P 500 Stocks ➞ Best Tech Stocks ➞ Best Biotech Stocks ➞ |
| Detailed Overview of Healthcare Stocks |
| Healthcare Technical Overview, Leaders & Laggards, Top Healthcare ETF Funds & Detailed Healthcare Stocks List, Charts, Trends & More |
| Healthcare Sector: Technical Analysis, Trends & YTD Performance | |
| Healthcare sector is composed of stocks
from pharmaceutical, biotech, diagnostics labs, insurance providers
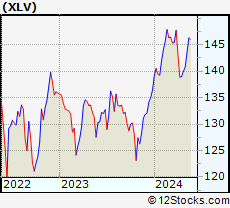
and healthcare services. Healthcare sector, as represented by XLV, an exchange-traded fund [ETF] that holds basket of Healthcare stocks (e.g, Merck, Amgen) is up by 7.05% and is currently underperforming the overall market by -3.64% year-to-date. Below is a quick view of Technical charts and trends: |
|
 XLV Weekly Chart |
|
| Long Term Trend: Very Good | |
| Medium Term Trend: Very Good | |
 XLV Daily Chart |
|
| Short Term Trend: Not Good | |
| Overall Trend Score: 83 | |
| YTD Performance: 7.05% | |
| **Trend Scores & Views Are Only For Educational Purposes And Not For Investing | |
| 12Stocks.com: Top Performing Healthcare Sector Stocks | ||||||||||||||||||||||||||||||||||||||||||||||||
 The top performing Healthcare sector stocks year to date are
Now, more recently, over last week, the top performing Healthcare sector stocks on the move are


|
||||||||||||||||||||||||||||||||||||||||||||||||
| 12Stocks.com: Investing in Healthcare Sector using Exchange Traded Funds | |
|
The following table shows list of key exchange traded funds (ETF) that
help investors track Healthcare Index. For detailed view, check out our ETF Funds section of our website. Quick View: Move mouse or cursor over ETF symbol (ticker) to view short-term Technical chart and over ETF name to view long term chart. Click on ticker or stock name for detailed view. Click on to add stock symbol to your watchlist and to view watchlist. |
12Stocks.com List of ETFs that track Healthcare Index
| Ticker | ETF Name | Watchlist | Recent Price | Smart Investing & Trading Score | Change % | Week % | Year-to-date % |
| XLV | Health Care | | 146.00 | 83 | -0.21 | -0.21 | 7.05% |
| XBI | Biotech | | 92.27 | 38 | 1.20 | 1.2 | 3.34% |
| IBB | Biotechnology | | 137.51 | 70 | 0.60 | 0.6 | 1.22% |
| BBH | Biotech | | 168.59 | 83 | 0.36 | 0.36 | 1.98% |
| VHT | Health Care | | 266.85 | 63 | -0.10 | -0.1 | 6.44% |
| IYH | Healthcare | | 61.24 | 63 | -0.16 | -0.16 | 6.97% |
| IHF | Healthcare Providers | | 53.54 | 76 | -0.69 | -0.69 | 1.96% |
| IHI | Medical Devices | | 56.45 | 38 | -0.42 | -0.42 | 4.6% |
| BIB | Biotechnology | | 57.89 | 82 | 1.63 | 1.63 | 1.47% |
| BIS | Short Biotech | | 17.33 | 18 | -1.48 | -1.48 | -4.1% |
| XHE | Health Care Equipment | | 87.50 | 69 | 0.06 | 0.06 | 3.85% |
| CURE | Healthcare Bull 3X | | 118.25 | 56 | -0.72 | -0.72 | 16.22% |
| LABU | Biotech Bull 3X | | 115.80 | 30 | 3.59 | 3.59 | -5.06% |
| LABD | Biotech Bear 3X | | 7.67 | 61 | -3.52 | -3.52 | -20.85% |
| PSCH | SmallCap Health Care | | 43.45 | 71 | 0.13 | 0.13 | 1.52% |
| XHS | Health Care Services | | 91.88 | 83 | 0.36 | 0.36 | 3.29% |
| PTH | DWA Healthcare Momentum | | 43.11 | 37 | 1.13 | 1.13 | 10.14% |
| BTEC | Principal Healthcare Innovators | | 36.94 | 22 | 1.26 | 1.26 | 1.68% |
| RXL | Health Care | | 102.89 | 70 | 0.13 | 0.13 | 12.57% |
| RXD | Short Health Care | | 10.57 | 25 | 0.07 | 0.07 | -11.36% |
| 12Stocks.com: Charts, Trends, Fundamental Data and Performances of Healthcare Stocks | |
|
We now take in-depth look at all Healthcare stocks including charts, multi-period performances and overall trends (as measured by Smart Investing & Trading Score). One can sort Healthcare stocks (click link to choose) by Daily, Weekly and by Year-to-Date performances. Also, one can sort by size of the company or by market capitalization. |
| Select Your Default Chart Type: | |||||
| |||||
| Click on stock symbol or name for detailed view. Click on to add stock symbol to your watchlist and to view watchlist. Quick View: Move mouse or cursor over "Daily" to quickly view daily Technical stock chart and over "Weekly" to view weekly Technical stock chart. | |||||

 | DNLI Denali Therapeutics Inc. |
| Sector: Health Care | |
| SubSector: Biotechnology | |
| MarketCap: 2020.05 Millions | |
| Recent Price: 20.13 Smart Investing & Trading Score: 61 | |
| Day Percent Change: -1.85% Day Change: -0.38 | |
| Week Change: -1.85% Year-to-date Change: -6.2% | |
| DNLI Links: Profile News Message Board | |
| Charts:- Daily , Weekly | |
| Add DNLI to Watchlist: View: Get Complete DNLI Trend Analysis ➞ | |
 | CHRS Coherus BioSciences, Inc. |
| Sector: Health Care | |
| SubSector: Biotechnology | |
| MarketCap: 1073.45 Millions | |
| Recent Price: 2.08 Smart Investing & Trading Score: 15 | |
| Day Percent Change: -1.89% Day Change: -0.04 | |
| Week Change: -1.89% Year-to-date Change: -37.5% | |
| CHRS Links: Profile News Message Board | |
| Charts:- Daily , Weekly | |
| Add CHRS to Watchlist: View: Get Complete CHRS Trend Analysis ➞ | |
 | SPRO Spero Therapeutics, Inc. |
| Sector: Health Care | |
| SubSector: Biotechnology | |
| MarketCap: 121.085 Millions | |
| Recent Price: 1.56 Smart Investing & Trading Score: 0 | |
| Day Percent Change: -1.89% Day Change: -0.03 | |
| Week Change: -1.89% Year-to-date Change: 6.1% | |
| SPRO Links: Profile News Message Board | |
| Charts:- Daily , Weekly | |
| Add SPRO to Watchlist: View: Get Complete SPRO Trend Analysis ➞ | |
 | BBIO BridgeBio Pharma, Inc. |
| Sector: Health Care | |
| SubSector: Biotechnology | |
| MarketCap: 3879.35 Millions | |
| Recent Price: 29.52 Smart Investing & Trading Score: 25 | |
| Day Percent Change: -1.89% Day Change: -0.57 | |
| Week Change: -1.89% Year-to-date Change: -26.9% | |
| BBIO Links: Profile News Message Board | |
| Charts:- Daily , Weekly | |
| Add BBIO to Watchlist: View: Get Complete BBIO Trend Analysis ➞ | |
 | MLTX MoonLake Immunotherapeutics |
| Sector: Health Care | |
| SubSector: Biotechnology | |
| MarketCap: 2670 Millions | |
| Recent Price: 39.00 Smart Investing & Trading Score: 10 | |
| Day Percent Change: -1.89% Day Change: -0.75 | |
| Week Change: -1.89% Year-to-date Change: -37.9% | |
| MLTX Links: Profile News Message Board | |
| Charts:- Daily , Weekly | |
| Add MLTX to Watchlist: View: Get Complete MLTX Trend Analysis ➞ | |
 | BTMD biote Corp. |
| Sector: Health Care | |
| SubSector: Medical Care Facilities | |
| MarketCap: 468 Millions | |
| Recent Price: 5.64 Smart Investing & Trading Score: 10 | |
| Day Percent Change: -1.91% Day Change: -0.11 | |
| Week Change: -1.91% Year-to-date Change: 13.7% | |
| BTMD Links: Profile News Message Board | |
| Charts:- Daily , Weekly | |
| Add BTMD to Watchlist: View: Get Complete BTMD Trend Analysis ➞ | |
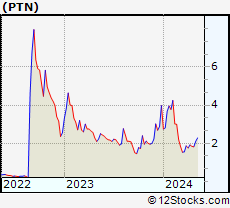 | PTN Palatin Technologies, Inc. |
| Sector: Health Care | |
| SubSector: Biotechnology | |
| MarketCap: 109.285 Millions | |
| Recent Price: 2.04 Smart Investing & Trading Score: 61 | |
| Day Percent Change: -1.92% Day Change: -0.04 | |
| Week Change: -1.92% Year-to-date Change: -48.7% | |
| PTN Links: Profile News Message Board | |
| Charts:- Daily , Weekly | |
| Add PTN to Watchlist: View: Get Complete PTN Trend Analysis ➞ | |
 | AVTE Aerovate Therapeutics, Inc. |
| Sector: Health Care | |
| SubSector: Biotechnology | |
| MarketCap: 478 Millions | |
| Recent Price: 20.17 Smart Investing & Trading Score: 7 | |
| Day Percent Change: -1.94% Day Change: -0.40 | |
| Week Change: -1.94% Year-to-date Change: -10.6% | |
| AVTE Links: Profile News Message Board | |
| Charts:- Daily , Weekly | |
| Add AVTE to Watchlist: View: Get Complete AVTE Trend Analysis ➞ | |
 | SLRN Acelyrin, Inc. |
| Sector: Health Care | |
| SubSector: Biotechnology | |
| MarketCap: 2030 Millions | |
| Recent Price: 4.30 Smart Investing & Trading Score: 20 | |
| Day Percent Change: -1.94% Day Change: -0.08 | |
| Week Change: -1.94% Year-to-date Change: -41.6% | |
| SLRN Links: Profile News Message Board | |
| Charts:- Daily , Weekly | |
| Add SLRN to Watchlist: View: Get Complete SLRN Trend Analysis ➞ | |
 | RPTX Repare Therapeutics Inc. |
| Sector: Health Care | |
| SubSector: Biotechnology | |
| MarketCap: 13687 Millions | |
| Recent Price: 3.48 Smart Investing & Trading Score: 25 | |
| Day Percent Change: -1.97% Day Change: -0.07 | |
| Week Change: -1.97% Year-to-date Change: -52.3% | |
| RPTX Links: Profile News Message Board | |
| Charts:- Daily , Weekly | |
| Add RPTX to Watchlist: View: Get Complete RPTX Trend Analysis ➞ | |
 | TLRY Tilray, Inc. |
| Sector: Health Care | |
| SubSector: Drug Manufacturers - Other | |
| MarketCap: 452.533 Millions | |
| Recent Price: 1.94 Smart Investing & Trading Score: 26 | |
| Day Percent Change: -2.02% Day Change: -0.04 | |
| Week Change: -2.02% Year-to-date Change: -15.7% | |
| TLRY Links: Profile News Message Board | |
| Charts:- Daily , Weekly | |
| Add TLRY to Watchlist: View: Get Complete TLRY Trend Analysis ➞ | |
 | IART Integra LifeSciences Holdings Corporation |
| Sector: Health Care | |
| SubSector: Medical Instruments & Supplies | |
| MarketCap: 3510.4 Millions | |
| Recent Price: 26.98 Smart Investing & Trading Score: 35 | |
| Day Percent Change: -2.03% Day Change: -0.56 | |
| Week Change: -2.03% Year-to-date Change: -38.1% | |
| IART Links: Profile News Message Board | |
| Charts:- Daily , Weekly | |
| Add IART to Watchlist: View: Get Complete IART Trend Analysis ➞ | |
 | PRQR ProQR Therapeutics N.V. |
| Sector: Health Care | |
| SubSector: Biotechnology | |
| MarketCap: 324.385 Millions | |
| Recent Price: 1.92 Smart Investing & Trading Score: 10 | |
| Day Percent Change: -2.04% Day Change: -0.04 | |
| Week Change: -2.04% Year-to-date Change: -3.0% | |
| PRQR Links: Profile News Message Board | |
| Charts:- Daily , Weekly | |
| Add PRQR to Watchlist: View: Get Complete PRQR Trend Analysis ➞ | |
 | TBPH Theravance Biopharma, Inc. |
| Sector: Health Care | |
| SubSector: Biotechnology | |
| MarketCap: 1404.55 Millions | |
| Recent Price: 9.10 Smart Investing & Trading Score: 0 | |
| Day Percent Change: -2.05% Day Change: -0.19 | |
| Week Change: -2.05% Year-to-date Change: -19.0% | |
| TBPH Links: Profile News Message Board | |
| Charts:- Daily , Weekly | |
| Add TBPH to Watchlist: View: Get Complete TBPH Trend Analysis ➞ | |
 | GERN Geron Corporation |
| Sector: Health Care | |
| SubSector: Biotechnology | |
| MarketCap: 228.685 Millions | |
| Recent Price: 3.73 Smart Investing & Trading Score: 36 | |
| Day Percent Change: -2.10% Day Change: -0.08 | |
| Week Change: -2.1% Year-to-date Change: 76.8% | |
| GERN Links: Profile News Message Board | |
| Charts:- Daily , Weekly | |
| Add GERN to Watchlist: View: Get Complete GERN Trend Analysis ➞ | |
 | IKNA Ikena Oncology, Inc. |
| Sector: Health Care | |
| SubSector: Biotechnology | |
| MarketCap: 277 Millions | |
| Recent Price: 1.40 Smart Investing & Trading Score: 64 | |
| Day Percent Change: -2.10% Day Change: -0.03 | |
| Week Change: -2.1% Year-to-date Change: -30.0% | |
| IKNA Links: Profile News Message Board | |
| Charts:- Daily , Weekly | |
| Add IKNA to Watchlist: View: Get Complete IKNA Trend Analysis ➞ | |
 | PRTC PureTech Health plc |
| Sector: Health Care | |
| SubSector: Biotechnology | |
| MarketCap: 819 Millions | |
| Recent Price: 27.90 Smart Investing & Trading Score: 44 | |
| Day Percent Change: -2.11% Day Change: -0.60 | |
| Week Change: -2.11% Year-to-date Change: 16.7% | |
| PRTC Links: Profile News Message Board | |
| Charts:- Daily , Weekly | |
| Add PRTC to Watchlist: View: Get Complete PRTC Trend Analysis ➞ | |
 | JNJ Johnson & Johnson |
| Sector: Health Care | |
| SubSector: Drug Manufacturers - Major | |
| MarketCap: 331972 Millions | |
| Recent Price: 151.27 Smart Investing & Trading Score: 42 | |
| Day Percent Change: -2.18% Day Change: -3.37 | |
| Week Change: -2.18% Year-to-date Change: -3.5% | |
| JNJ Links: Profile News Message Board | |
| Charts:- Daily , Weekly | |
| Add JNJ to Watchlist: View: Get Complete JNJ Trend Analysis ➞ | |
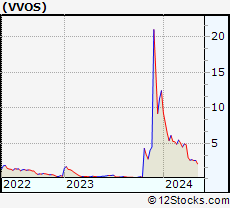 | VVOS Vivos Therapeutics, Inc. |
| Sector: Health Care | |
| SubSector: Medical Devices | |
| MarketCap: 21487 Millions | |
| Recent Price: 2.24 Smart Investing & Trading Score: 30 | |
| Day Percent Change: -2.18% Day Change: -0.05 | |
| Week Change: -2.18% Year-to-date Change: -82.0% | |
| VVOS Links: Profile News Message Board | |
| Charts:- Daily , Weekly | |
| Add VVOS to Watchlist: View: Get Complete VVOS Trend Analysis ➞ | |
 | LNSR LENSAR, Inc. |
| Sector: Health Care | |
| SubSector: Medical Devices | |
| MarketCap: 91487 Millions | |
| Recent Price: 4.03 Smart Investing & Trading Score: 42 | |
| Day Percent Change: -2.18% Day Change: -0.09 | |
| Week Change: -2.18% Year-to-date Change: 14.8% | |
| LNSR Links: Profile News Message Board | |
| Charts:- Daily , Weekly | |
| Add LNSR to Watchlist: View: Get Complete LNSR Trend Analysis ➞ | |
 | FNA Paragon 28, Inc. |
| Sector: Health Care | |
| SubSector: Medical Devices | |
| MarketCap: 1420 Millions | |
| Recent Price: 7.49 Smart Investing & Trading Score: 10 | |
| Day Percent Change: -2.22% Day Change: -0.17 | |
| Week Change: -2.22% Year-to-date Change: -39.9% | |
| FNA Links: Profile News Message Board | |
| Charts:- Daily , Weekly | |
| Add FNA to Watchlist: View: Get Complete FNA Trend Analysis ➞ | |
 | ILMN Illumina, Inc. |
| Sector: Health Care | |
| SubSector: Biotechnology | |
| MarketCap: 39194.3 Millions | |
| Recent Price: 108.53 Smart Investing & Trading Score: 0 | |
| Day Percent Change: -2.29% Day Change: -2.54 | |
| Week Change: -2.29% Year-to-date Change: -22.1% | |
| ILMN Links: Profile News Message Board | |
| Charts:- Daily , Weekly | |
| Add ILMN to Watchlist: View: Get Complete ILMN Trend Analysis ➞ | |
 | CTKB Cytek Biosciences, Inc. |
| Sector: Health Care | |
| SubSector: Medical Devices | |
| MarketCap: 1140 Millions | |
| Recent Price: 5.96 Smart Investing & Trading Score: 10 | |
| Day Percent Change: -2.30% Day Change: -0.14 | |
| Week Change: -2.3% Year-to-date Change: -35.2% | |
| CTKB Links: Profile News Message Board | |
| Charts:- Daily , Weekly | |
| Add CTKB to Watchlist: View: Get Complete CTKB Trend Analysis ➞ | |
 | OSCR Oscar Health, Inc. |
| Sector: Health Care | |
| SubSector: Healthcare Plans | |
| MarketCap: 1790 Millions | |
| Recent Price: 22.00 Smart Investing & Trading Score: 70 | |
| Day Percent Change: -2.31% Day Change: -0.52 | |
| Week Change: -2.31% Year-to-date Change: 141.6% | |
| OSCR Links: Profile News Message Board | |
| Charts:- Daily , Weekly | |
| Add OSCR to Watchlist: View: Get Complete OSCR Trend Analysis ➞ | |
 | IVA Inventiva S.A. |
| Sector: Health Care | |
| SubSector: Biotechnology | |
| MarketCap: 46487 Millions | |
| Recent Price: 3.71 Smart Investing & Trading Score: 75 | |
| Day Percent Change: -2.32% Day Change: -0.09 | |
| Week Change: -2.32% Year-to-date Change: -17.8% | |
| IVA Links: Profile News Message Board | |
| Charts:- Daily , Weekly | |
| Add IVA to Watchlist: View: Get Complete IVA Trend Analysis ➞ | |
| For tabular summary view of above stock list: Summary View ➞ 0 - 25 , 25 - 50 , 50 - 75 , 75 - 100 , 100 - 125 , 125 - 150 , 150 - 175 , 175 - 200 , 200 - 225 , 225 - 250 , 250 - 275 , 275 - 300 , 300 - 325 , 325 - 350 , 350 - 375 , 375 - 400 , 400 - 425 , 425 - 450 , 450 - 475 , 475 - 500 , 500 - 525 , 525 - 550 , 550 - 575 , 575 - 600 , 600 - 625 , 625 - 650 , 650 - 675 , 675 - 700 , 700 - 725 | ||
| Click To Change The Sort Order: By Market Cap or Company Size Performance: Year-to-date, Week and Day | |
| Select Chart Type: | ||
|
Best Stocks Today 12Stocks.com |
© 2024 12Stocks.com Terms & Conditions Privacy Contact Us
All Information Provided Only For Education And Not To Be Used For Investing or Trading. See Terms & Conditions


One More Thing ... Get Best Stocks Delivered Daily!
Never Ever Miss A Move With Our Top Ten Stocks Lists
Find Best Stocks In Any Market - Bull or Bear Market
Take A Peek At Our Top Ten Stocks Lists: Daily, Weekly, Year-to-Date & Top Trends
Find Best Stocks In Any Market - Bull or Bear Market
Take A Peek At Our Top Ten Stocks Lists: Daily, Weekly, Year-to-Date & Top Trends
Healthcare Stocks With Best Up Trends [0-bearish to 100-bullish]: PTC [100], Stoke [100], Humacyte [100], NovoCure [100], Reneo [100], Vericel [100], Corbus [100], Genfit SA[100], Heron [100], Moderna [100], Innate Pharma[100]
Best Healthcare Stocks Year-to-Date:
Pieris [6081.32%], Precision BioSciences[3417.81%], Avenue [2266.46%], Inovio [2078.43%], Assembly Biosciences[1724.17%], Aurora Cannabis[1453.97%], Agenus [1192.43%], NuCana [1117.04%], Adverum Biotechnologies[995.91%], Affimed N.V[725.6%], Burning Rock[706.3%] Best Healthcare Stocks This Week:
Scilex Holding[34.44%], Nobilis Health[29.64%], Dyne [27.82%], BioTelemetry [21.98%], PTC [21.23%], Concord [19.24%], Genelux [17.81%], Sutro Biopharma[16.71%], iBio [16.53%], InnovAge Holding[16.49%], Atara Bio[16.39%] Best Healthcare Stocks Daily:
Scilex Holding[34.44%], Nobilis Health[29.64%], Dyne [27.82%], BioTelemetry [21.98%], PTC [21.23%], Concord [19.24%], Genelux [17.81%], Sutro Biopharma[16.71%], iBio [16.53%], InnovAge Holding[16.49%], Atara Bio[16.39%]