
 Login Sign Up


| |||||
 |  | ||||

| 12Stocks.com Market Intelligence |
Best Healthcare Stocks
 | "Discover best trending healthcare stocks with 12Stocks.com." |
| - Subu Vdaygiri, Founder, 12Stocks.com |
| In a hurry? Healthcare Stocks Lists: Performance Trends Table, Stock Charts
Sort Healthcare stocks: Daily, Weekly, Year-to-Date, Market Cap & Trends. Filter Healthcare stocks list by size:All Healthcare Large Mid-Range Small |
| 12Stocks.com Healthcare Stocks Performances & Trends Daily | |||||||||
|
|  The overall Smart Investing & Trading Score is 83 (0-bearish to 100-bullish) which puts Healthcare sector in short term bullish trend. The Smart Investing & Trading Score from previous trading session is 88 and hence a deterioration of trend.
| ||||||||
Here are the Smart Investing & Trading Scores of the most requested Healthcare stocks at 12Stocks.com (click stock name for detailed review):
|


| 12Stocks.com: Investing in Healthcare sector with Stocks | |
|
The following table helps investors and traders sort through current performance and trends (as measured by Smart Investing & Trading Score) of various
stocks in the Healthcare sector. Quick View: Move mouse or cursor over stock symbol (ticker) to view short-term Technical chart and over stock name to view long term chart. Click on  to add stock symbol to your watchlist and to add stock symbol to your watchlist and  to view watchlist. Click on any ticker or stock name for detailed market intelligence report for that stock. to view watchlist. Click on any ticker or stock name for detailed market intelligence report for that stock. |
12Stocks.com Performance of Stocks in Healthcare Sector
| Ticker | Stock Name | Watchlist | Category | Recent Price | Smart Investing & Trading Score | Change % | Weekly Change% |
| BEAM | Beam |   | Biotechnology | 24.84 | 52 | 0.89% | 0.89% |
| ROIV | Roivant Sciences | | Biotechnology | 11.33 | 25 | 0.89% | 0.89% |
| HLN | Haleon | | Drug Manufacturers - Specialty & Generic | 8.59 | 77 | 0.88% | 0.88% |
| PETS | PetMed Express | | Delivery | 4.62 | 64 | 0.87% | 0.87% |
| BGNE | BeiGene | | Biotechnology | 174.32 | 95 | 0.85% | 0.85% |
| NCNA | NuCana | | Biotechnology | 3.60 | 46 | 0.84% | 0.84% |
| CYH | Community Health | | Hospitals | 3.64 | 68 | 0.83% | 0.83% |
| NARI | Inari | | Medical Devices | 46.13 | 55 | 0.83% | 0.83% |
| DVA | DaVita | | Specialized | 140.93 | 90 | 0.79% | 0.79% |
| CNMD | CONMED | | Equipment | 75.31 | 62 | 0.79% | 0.79% |
| PRCT | PROCEPT BioRobotics | | Medical Devices | 68.64 | 75 | 0.79% | 0.79% |
| NVO | Novo Nordisk | | Biotechnology | 132.91 | 70 | 0.77% | 0.77% |
| VKTX | Viking | | Biotechnology | 67.52 | 0 | 0.77% | 0.77% |
| EHC | Encompass Health | | Hospitals | 86.11 | 58 | 0.77% | 0.77% |
| HYPR | Hyperfine | | Medical Devices | 0.90 | 62 | 0.77% | 0.77% |
| CLSD | Clearside Bio | | Biotechnology | 1.33 | 64 | 0.76% | 0.76% |
| NEO | NeoGenomics | | Laboratories | 14.91 | 10 | 0.74% | 0.74% |
| EW | Edwards Lifesciences | | Equipment | 89.78 | 81 | 0.72% | 0.72% |
| EXEL | Exelixis | | Biotechnology | 21.06 | 18 | 0.72% | 0.72% |
| PGEN | Precigen | | Biotechnology | 1.39 | 25 | 0.72% | 0.72% |
| LBPH | Longboard | | Biotechnology | 20.84 | 34 | 0.72% | 0.72% |
| ENLV | Enlivex | | Biotechnology | 1.42 | 22 | 0.71% | 0.71% |
| HCA | HCA | | Hospitals | 325.05 | 88 | 0.68% | 0.68% |
| CIVI | Civitas | | Long-Term | 74.99 | 22 | 0.68% | 0.68% |
| OFIX | Orthofix | | Equipment | 15.10 | 75 | 0.67% | 0.67% |
| For chart view version of above stock list: Chart View ➞ 0 - 25 , 25 - 50 , 50 - 75 , 75 - 100 , 100 - 125 , 125 - 150 , 150 - 175 , 175 - 200 , 200 - 225 , 225 - 250 , 250 - 275 , 275 - 300 , 300 - 325 , 325 - 350 , 350 - 375 , 375 - 400 , 400 - 425 , 425 - 450 , 450 - 475 , 475 - 500 , 500 - 525 , 525 - 550 , 550 - 575 , 575 - 600 , 600 - 625 , 625 - 650 , 650 - 675 , 675 - 700 , 700 - 725 | ||
 | Click To Change The Sort Order: By Market Cap or Company Size Performance: Year-to-date, Week and Day |  |
|
Get the most comprehensive stock market coverage daily at 12Stocks.com ➞ Best Stocks Today ➞ Best Stocks Weekly ➞ Best Stocks Year-to-Date ➞ Best Stocks Trends ➞  Best Stocks Today 12Stocks.com Best Nasdaq Stocks ➞ Best S&P 500 Stocks ➞ Best Tech Stocks ➞ Best Biotech Stocks ➞ |
| Detailed Overview of Healthcare Stocks |
| Healthcare Technical Overview, Leaders & Laggards, Top Healthcare ETF Funds & Detailed Healthcare Stocks List, Charts, Trends & More |
| Healthcare Sector: Technical Analysis, Trends & YTD Performance | |
| Healthcare sector is composed of stocks
from pharmaceutical, biotech, diagnostics labs, insurance providers
and healthcare services. Healthcare sector, as represented by XLV, an exchange-traded fund [ETF] that holds basket of Healthcare stocks (e.g, Merck, Amgen) is up by 7.05% and is currently underperforming the overall market by -3.64% year-to-date. Below is a quick view of Technical charts and trends: |
|
 XLV Weekly Chart |
|
| Long Term Trend: Very Good | |
| Medium Term Trend: Very Good | |
 XLV Daily Chart |
|
| Short Term Trend: Not Good | |
| Overall Trend Score: 83 | |
| YTD Performance: 7.05% | |
| **Trend Scores & Views Are Only For Educational Purposes And Not For Investing | |
| 12Stocks.com: Top Performing Healthcare Sector Stocks | ||||||||||||||||||||||||||||||||||||||||||||||||
 The top performing Healthcare sector stocks year to date are
Now, more recently, over last week, the top performing Healthcare sector stocks on the move are


|
||||||||||||||||||||||||||||||||||||||||||||||||
| 12Stocks.com: Investing in Healthcare Sector using Exchange Traded Funds | |
|
The following table shows list of key exchange traded funds (ETF) that
help investors track Healthcare Index. For detailed view, check out our ETF Funds section of our website. Quick View: Move mouse or cursor over ETF symbol (ticker) to view short-term Technical chart and over ETF name to view long term chart. Click on ticker or stock name for detailed view. Click on to add stock symbol to your watchlist and to view watchlist. |
12Stocks.com List of ETFs that track Healthcare Index
| Ticker | ETF Name | Watchlist | Recent Price | Smart Investing & Trading Score | Change % | Week % | Year-to-date % |
| XLV | Health Care | | 146.00 | 83 | -0.21 | -0.21 | 7.05% |
| XBI | Biotech | | 92.27 | 38 | 1.20 | 1.2 | 3.34% |
| IBB | Biotechnology | | 137.51 | 70 | 0.60 | 0.6 | 1.22% |
| BBH | Biotech | | 168.59 | 83 | 0.36 | 0.36 | 1.98% |
| VHT | Health Care | | 266.85 | 63 | -0.10 | -0.1 | 6.44% |
| IYH | Healthcare | | 61.24 | 63 | -0.16 | -0.16 | 6.97% |
| IHF | Healthcare Providers | | 53.54 | 76 | -0.69 | -0.69 | 1.96% |
| IHI | Medical Devices | | 56.45 | 38 | -0.42 | -0.42 | 4.6% |
| BIB | Biotechnology | | 57.89 | 82 | 1.63 | 1.63 | 1.47% |
| BIS | Short Biotech | | 17.33 | 18 | -1.48 | -1.48 | -4.1% |
| XHE | Health Care Equipment | | 87.50 | 69 | 0.06 | 0.06 | 3.85% |
| CURE | Healthcare Bull 3X | | 118.25 | 56 | -0.72 | -0.72 | 16.22% |
| LABU | Biotech Bull 3X | | 115.80 | 30 | 3.59 | 3.59 | -5.06% |
| LABD | Biotech Bear 3X | | 7.67 | 61 | -3.52 | -3.52 | -20.85% |
| PSCH | SmallCap Health Care | | 43.45 | 71 | 0.13 | 0.13 | 1.52% |
| XHS | Health Care Services | | 91.88 | 83 | 0.36 | 0.36 | 3.29% |
| PTH | DWA Healthcare Momentum | | 43.11 | 37 | 1.13 | 1.13 | 10.14% |
| BTEC | Principal Healthcare Innovators | | 36.94 | 22 | 1.26 | 1.26 | 1.68% |
| RXL | Health Care | | 102.89 | 70 | 0.13 | 0.13 | 12.57% |
| RXD | Short Health Care | | 10.57 | 25 | 0.07 | 0.07 | -11.36% |
| 12Stocks.com: Charts, Trends, Fundamental Data and Performances of Healthcare Stocks | |
|
We now take in-depth look at all Healthcare stocks including charts, multi-period performances and overall trends (as measured by Smart Investing & Trading Score). One can sort Healthcare stocks (click link to choose) by Daily, Weekly and by Year-to-Date performances. Also, one can sort by size of the company or by market capitalization. |
| Select Your Default Chart Type: | |||||
| |||||
| Click on stock symbol or name for detailed view. Click on to add stock symbol to your watchlist and to view watchlist. Quick View: Move mouse or cursor over "Daily" to quickly view daily Technical stock chart and over "Weekly" to view weekly Technical stock chart. | |||||

 | BEAM Beam Therapeutics Inc. |
| Sector: Health Care | |
| SubSector: Biotechnology | |
| MarketCap: 44987 Millions | |
| Recent Price: 24.84 Smart Investing & Trading Score: 52 | |
| Day Percent Change: 0.89% Day Change: 0.22 | |
| Week Change: 0.89% Year-to-date Change: -8.7% | |
| BEAM Links: Profile News Message Board | |
| Charts:- Daily , Weekly | |
| Add BEAM to Watchlist: View: Get Complete BEAM Trend Analysis ➞ | |
 | ROIV Roivant Sciences Ltd. |
| Sector: Health Care | |
| SubSector: Biotechnology | |
| MarketCap: 7780 Millions | |
| Recent Price: 11.33 Smart Investing & Trading Score: 25 | |
| Day Percent Change: 0.89% Day Change: 0.10 | |
| Week Change: 0.89% Year-to-date Change: 2.0% | |
| ROIV Links: Profile News Message Board | |
| Charts:- Daily , Weekly | |
| Add ROIV to Watchlist: View: Get Complete ROIV Trend Analysis ➞ | |
 | HLN Haleon plc |
| Sector: Health Care | |
| SubSector: Drug Manufacturers - Specialty & Generic | |
| MarketCap: 38310 Millions | |
| Recent Price: 8.59 Smart Investing & Trading Score: 77 | |
| Day Percent Change: 0.88% Day Change: 0.08 | |
| Week Change: 0.88% Year-to-date Change: 4.3% | |
| HLN Links: Profile News Message Board | |
| Charts:- Daily , Weekly | |
| Add HLN to Watchlist: View: Get Complete HLN Trend Analysis ➞ | |
 | PETS PetMed Express, Inc. |
| Sector: Health Care | |
| SubSector: Drug Delivery | |
| MarketCap: 528.23 Millions | |
| Recent Price: 4.62 Smart Investing & Trading Score: 64 | |
| Day Percent Change: 0.87% Day Change: 0.04 | |
| Week Change: 0.87% Year-to-date Change: -38.9% | |
| PETS Links: Profile News Message Board | |
| Charts:- Daily , Weekly | |
| Add PETS to Watchlist: View: Get Complete PETS Trend Analysis ➞ | |
 | BGNE BeiGene, Ltd. |
| Sector: Health Care | |
| SubSector: Biotechnology | |
| MarketCap: 10838.5 Millions | |
| Recent Price: 174.32 Smart Investing & Trading Score: 95 | |
| Day Percent Change: 0.85% Day Change: 1.47 | |
| Week Change: 0.85% Year-to-date Change: -3.4% | |
| BGNE Links: Profile News Message Board | |
| Charts:- Daily , Weekly | |
| Add BGNE to Watchlist: View: Get Complete BGNE Trend Analysis ➞ | |
 | NCNA NuCana plc |
| Sector: Health Care | |
| SubSector: Biotechnology | |
| MarketCap: 185.785 Millions | |
| Recent Price: 3.60 Smart Investing & Trading Score: 46 | |
| Day Percent Change: 0.84% Day Change: 0.03 | |
| Week Change: 0.84% Year-to-date Change: 1,117.0% | |
| NCNA Links: Profile News Message Board | |
| Charts:- Daily , Weekly | |
| Add NCNA to Watchlist: View: Get Complete NCNA Trend Analysis ➞ | |
 | CYH Community Health Systems, Inc. |
| Sector: Health Care | |
| SubSector: Hospitals | |
| MarketCap: 371.546 Millions | |
| Recent Price: 3.64 Smart Investing & Trading Score: 68 | |
| Day Percent Change: 0.83% Day Change: 0.03 | |
| Week Change: 0.83% Year-to-date Change: 16.3% | |
| CYH Links: Profile News Message Board | |
| Charts:- Daily , Weekly | |
| Add CYH to Watchlist: View: Get Complete CYH Trend Analysis ➞ | |
 | NARI Inari Medical, Inc. |
| Sector: Health Care | |
| SubSector: Medical Devices | |
| MarketCap: 33287 Millions | |
| Recent Price: 46.13 Smart Investing & Trading Score: 55 | |
| Day Percent Change: 0.83% Day Change: 0.38 | |
| Week Change: 0.83% Year-to-date Change: -29.0% | |
| NARI Links: Profile News Message Board | |
| Charts:- Daily , Weekly | |
| Add NARI to Watchlist: View: Get Complete NARI Trend Analysis ➞ | |
 | DVA DaVita Inc. |
| Sector: Health Care | |
| SubSector: Specialized Health Services | |
| MarketCap: 8954.36 Millions | |
| Recent Price: 140.93 Smart Investing & Trading Score: 90 | |
| Day Percent Change: 0.79% Day Change: 1.11 | |
| Week Change: 0.79% Year-to-date Change: 34.5% | |
| DVA Links: Profile News Message Board | |
| Charts:- Daily , Weekly | |
| Add DVA to Watchlist: View: Get Complete DVA Trend Analysis ➞ | |
 | CNMD CONMED Corporation |
| Sector: Health Care | |
| SubSector: Medical Appliances & Equipment | |
| MarketCap: 1589.2 Millions | |
| Recent Price: 75.31 Smart Investing & Trading Score: 62 | |
| Day Percent Change: 0.79% Day Change: 0.59 | |
| Week Change: 0.79% Year-to-date Change: -31.2% | |
| CNMD Links: Profile News Message Board | |
| Charts:- Daily , Weekly | |
| Add CNMD to Watchlist: View: Get Complete CNMD Trend Analysis ➞ | |
 | PRCT PROCEPT BioRobotics Corporation |
| Sector: Health Care | |
| SubSector: Medical Devices | |
| MarketCap: 1600 Millions | |
| Recent Price: 68.64 Smart Investing & Trading Score: 75 | |
| Day Percent Change: 0.79% Day Change: 0.54 | |
| Week Change: 0.79% Year-to-date Change: 62.1% | |
| PRCT Links: Profile News Message Board | |
| Charts:- Daily , Weekly | |
| Add PRCT to Watchlist: View: Get Complete PRCT Trend Analysis ➞ | |
 | NVO Novo Nordisk A/S |
| Sector: Health Care | |
| SubSector: Biotechnology | |
| MarketCap: 100744 Millions | |
| Recent Price: 132.91 Smart Investing & Trading Score: 70 | |
| Day Percent Change: 0.77% Day Change: 1.02 | |
| Week Change: 0.77% Year-to-date Change: 28.5% | |
| NVO Links: Profile News Message Board | |
| Charts:- Daily , Weekly | |
| Add NVO to Watchlist: View: Get Complete NVO Trend Analysis ➞ | |
 | VKTX Viking Therapeutics, Inc. |
| Sector: Health Care | |
| SubSector: Biotechnology | |
| MarketCap: 388.585 Millions | |
| Recent Price: 67.52 Smart Investing & Trading Score: 0 | |
| Day Percent Change: 0.77% Day Change: 0.52 | |
| Week Change: 0.77% Year-to-date Change: 262.8% | |
| VKTX Links: Profile News Message Board | |
| Charts:- Daily , Weekly | |
| Add VKTX to Watchlist: View: Get Complete VKTX Trend Analysis ➞ | |
 | EHC Encompass Health Corporation |
| Sector: Health Care | |
| SubSector: Hospitals | |
| MarketCap: 5384.06 Millions | |
| Recent Price: 86.11 Smart Investing & Trading Score: 58 | |
| Day Percent Change: 0.77% Day Change: 0.66 | |
| Week Change: 0.77% Year-to-date Change: 29.1% | |
| EHC Links: Profile News Message Board | |
| Charts:- Daily , Weekly | |
| Add EHC to Watchlist: View: Get Complete EHC Trend Analysis ➞ | |
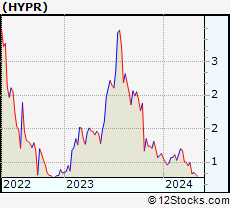 | HYPR Hyperfine, Inc. |
| Sector: Health Care | |
| SubSector: Medical Devices | |
| MarketCap: 154 Millions | |
| Recent Price: 0.90 Smart Investing & Trading Score: 62 | |
| Day Percent Change: 0.77% Day Change: 0.01 | |
| Week Change: 0.77% Year-to-date Change: -20.4% | |
| HYPR Links: Profile News Message Board | |
| Charts:- Daily , Weekly | |
| Add HYPR to Watchlist: View: Get Complete HYPR Trend Analysis ➞ | |
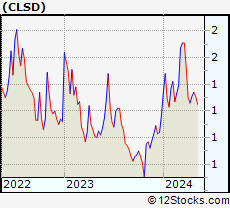 | CLSD Clearside Biomedical, Inc. |
| Sector: Health Care | |
| SubSector: Biotechnology | |
| MarketCap: 73.2785 Millions | |
| Recent Price: 1.33 Smart Investing & Trading Score: 64 | |
| Day Percent Change: 0.76% Day Change: 0.01 | |
| Week Change: 0.76% Year-to-date Change: 13.7% | |
| CLSD Links: Profile News Message Board | |
| Charts:- Daily , Weekly | |
| Add CLSD to Watchlist: View: Get Complete CLSD Trend Analysis ➞ | |
 | NEO NeoGenomics, Inc. |
| Sector: Health Care | |
| SubSector: Medical Laboratories & Research | |
| MarketCap: 2763.8 Millions | |
| Recent Price: 14.91 Smart Investing & Trading Score: 10 | |
| Day Percent Change: 0.74% Day Change: 0.11 | |
| Week Change: 0.74% Year-to-date Change: -7.9% | |
| NEO Links: Profile News Message Board | |
| Charts:- Daily , Weekly | |
| Add NEO to Watchlist: View: Get Complete NEO Trend Analysis ➞ | |
 | EW Edwards Lifesciences Corporation |
| Sector: Health Care | |
| SubSector: Medical Appliances & Equipment | |
| MarketCap: 36735.5 Millions | |
| Recent Price: 89.78 Smart Investing & Trading Score: 81 | |
| Day Percent Change: 0.72% Day Change: 0.64 | |
| Week Change: 0.72% Year-to-date Change: 17.7% | |
| EW Links: Profile News Message Board | |
| Charts:- Daily , Weekly | |
| Add EW to Watchlist: View: Get Complete EW Trend Analysis ➞ | |
 | EXEL Exelixis, Inc. |
| Sector: Health Care | |
| SubSector: Biotechnology | |
| MarketCap: 5254.75 Millions | |
| Recent Price: 21.06 Smart Investing & Trading Score: 18 | |
| Day Percent Change: 0.72% Day Change: 0.15 | |
| Week Change: 0.72% Year-to-date Change: -12.2% | |
| EXEL Links: Profile News Message Board | |
| Charts:- Daily , Weekly | |
| Add EXEL to Watchlist: View: Get Complete EXEL Trend Analysis ➞ | |
 | PGEN Precigen, Inc. |
| Sector: Health Care | |
| SubSector: Biotechnology | |
| MarketCap: 564.785 Millions | |
| Recent Price: 1.39 Smart Investing & Trading Score: 25 | |
| Day Percent Change: 0.72% Day Change: 0.01 | |
| Week Change: 0.72% Year-to-date Change: 3.7% | |
| PGEN Links: Profile News Message Board | |
| Charts:- Daily , Weekly | |
| Add PGEN to Watchlist: View: Get Complete PGEN Trend Analysis ➞ | |
 | LBPH Longboard Pharmaceuticals, Inc. |
| Sector: Health Care | |
| SubSector: Biotechnology | |
| MarketCap: 169 Millions | |
| Recent Price: 20.84 Smart Investing & Trading Score: 34 | |
| Day Percent Change: 0.72% Day Change: 0.15 | |
| Week Change: 0.72% Year-to-date Change: 241.1% | |
| LBPH Links: Profile News Message Board | |
| Charts:- Daily , Weekly | |
| Add LBPH to Watchlist: View: Get Complete LBPH Trend Analysis ➞ | |
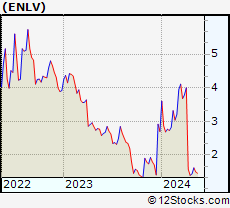 | ENLV Enlivex Therapeutics Ltd. |
| Sector: Health Care | |
| SubSector: Biotechnology | |
| MarketCap: 50.7785 Millions | |
| Recent Price: 1.42 Smart Investing & Trading Score: 22 | |
| Day Percent Change: 0.71% Day Change: 0.01 | |
| Week Change: 0.71% Year-to-date Change: -47.4% | |
| ENLV Links: Profile News Message Board | |
| Charts:- Daily , Weekly | |
| Add ENLV to Watchlist: View: Get Complete ENLV Trend Analysis ➞ | |
 | HCA HCA Healthcare, Inc. |
| Sector: Health Care | |
| SubSector: Hospitals | |
| MarketCap: 29466.6 Millions | |
| Recent Price: 325.05 Smart Investing & Trading Score: 88 | |
| Day Percent Change: 0.68% Day Change: 2.19 | |
| Week Change: 0.68% Year-to-date Change: 20.1% | |
| HCA Links: Profile News Message Board | |
| Charts:- Daily , Weekly | |
| Add HCA to Watchlist: View: Get Complete HCA Trend Analysis ➞ | |
 | CIVI Civitas Solutions, Inc. |
| Sector: Health Care | |
| SubSector: Long-Term Care Facilities | |
| MarketCap: 625.74 Millions | |
| Recent Price: 74.99 Smart Investing & Trading Score: 22 | |
| Day Percent Change: 0.68% Day Change: 0.51 | |
| Week Change: 0.68% Year-to-date Change: 9.7% | |
| CIVI Links: Profile News Message Board | |
| Charts:- Daily , Weekly | |
| Add CIVI to Watchlist: View: Get Complete CIVI Trend Analysis ➞ | |
 | OFIX Orthofix Medical Inc. |
| Sector: Health Care | |
| SubSector: Medical Appliances & Equipment | |
| MarketCap: 508.18 Millions | |
| Recent Price: 15.10 Smart Investing & Trading Score: 75 | |
| Day Percent Change: 0.67% Day Change: 0.10 | |
| Week Change: 0.67% Year-to-date Change: 12.0% | |
| OFIX Links: Profile News Message Board | |
| Charts:- Daily , Weekly | |
| Add OFIX to Watchlist: View: Get Complete OFIX Trend Analysis ➞ | |
| For tabular summary view of above stock list: Summary View ➞ 0 - 25 , 25 - 50 , 50 - 75 , 75 - 100 , 100 - 125 , 125 - 150 , 150 - 175 , 175 - 200 , 200 - 225 , 225 - 250 , 250 - 275 , 275 - 300 , 300 - 325 , 325 - 350 , 350 - 375 , 375 - 400 , 400 - 425 , 425 - 450 , 450 - 475 , 475 - 500 , 500 - 525 , 525 - 550 , 550 - 575 , 575 - 600 , 600 - 625 , 625 - 650 , 650 - 675 , 675 - 700 , 700 - 725 | ||
| Click To Change The Sort Order: By Market Cap or Company Size Performance: Year-to-date, Week and Day | |
| Select Chart Type: | ||
|
Best Stocks Today 12Stocks.com |
© 2024 12Stocks.com Terms & Conditions Privacy Contact Us
All Information Provided Only For Education And Not To Be Used For Investing or Trading. See Terms & Conditions


One More Thing ... Get Best Stocks Delivered Daily!
Never Ever Miss A Move With Our Top Ten Stocks Lists
Find Best Stocks In Any Market - Bull or Bear Market
Take A Peek At Our Top Ten Stocks Lists: Daily, Weekly, Year-to-Date & Top Trends
Find Best Stocks In Any Market - Bull or Bear Market
Take A Peek At Our Top Ten Stocks Lists: Daily, Weekly, Year-to-Date & Top Trends
Healthcare Stocks With Best Up Trends [0-bearish to 100-bullish]: PTC [100], Stoke [100], Humacyte [100], NovoCure [100], Reneo [100], Vericel [100], Corbus [100], Genfit SA[100], Heron [100], Moderna [100], Innate Pharma[100]
Best Healthcare Stocks Year-to-Date:
Pieris [6081.32%], Precision BioSciences[3417.81%], Avenue [2266.46%], Inovio [2078.43%], Assembly Biosciences[1724.17%], Aurora Cannabis[1453.97%], Agenus [1192.43%], NuCana [1117.04%], Adverum Biotechnologies[995.91%], Affimed N.V[725.6%], Burning Rock[706.3%] Best Healthcare Stocks This Week:
Scilex Holding[34.44%], Nobilis Health[29.64%], Dyne [27.82%], BioTelemetry [21.98%], PTC [21.23%], Concord [19.24%], Genelux [17.81%], Sutro Biopharma[16.71%], iBio [16.53%], InnovAge Holding[16.49%], Atara Bio[16.39%] Best Healthcare Stocks Daily:
Scilex Holding[34.44%], Nobilis Health[29.64%], Dyne [27.82%], BioTelemetry [21.98%], PTC [21.23%], Concord [19.24%], Genelux [17.81%], Sutro Biopharma[16.71%], iBio [16.53%], InnovAge Holding[16.49%], Atara Bio[16.39%]