
 Login Sign Up


| |||||
 |  | ||||

| 12Stocks.com Market Intelligence |
Best Healthcare Stocks
 | "Discover best trending healthcare stocks with 12Stocks.com." |
| - Subu Vdaygiri, Founder, 12Stocks.com |
| In a hurry? Healthcare Stocks Lists: Performance Trends Table, Stock Charts
Sort Healthcare stocks: Daily, Weekly, Year-to-Date, Market Cap & Trends. Filter Healthcare stocks list by size:All Healthcare Large Mid-Range Small |
| 12Stocks.com Healthcare Stocks Performances & Trends Daily | |||||||||
|
|  The overall Smart Investing & Trading Score is 83 (0-bearish to 100-bullish) which puts Healthcare sector in short term bullish trend. The Smart Investing & Trading Score from previous trading session is 88 and a deterioration of trend continues.
| ||||||||
Here are the Smart Investing & Trading Scores of the most requested Healthcare stocks at 12Stocks.com (click stock name for detailed review):
|


| 12Stocks.com: Investing in Healthcare sector with Stocks | |
|
The following table helps investors and traders sort through current performance and trends (as measured by Smart Investing & Trading Score) of various
stocks in the Healthcare sector. Quick View: Move mouse or cursor over stock symbol (ticker) to view short-term Technical chart and over stock name to view long term chart. Click on  to add stock symbol to your watchlist and to add stock symbol to your watchlist and  to view watchlist. Click on any ticker or stock name for detailed market intelligence report for that stock. to view watchlist. Click on any ticker or stock name for detailed market intelligence report for that stock. |
12Stocks.com Performance of Stocks in Healthcare Sector
| Ticker | Stock Name | Watchlist | Category | Recent Price | Smart Investing & Trading Score | Change % | Weekly Change% |
| KRON | Kronos Bio |   | Biotechnology | 1.03 | 55 | -0.96% | 0.98% |
| RDY | Dr. Reddy | | Pharmaceutical | 68.92 | 17 | 0.31% | 0.97% |
| WVE | Wave Life | | Biotechnology | 6.32 | 100 | -0.94% | 0.96% |
| APLT | Applied | | Biotechnology | 4.23 | 18 | 0.71% | 0.95% |
| XOMA | XOMA | | Biotechnology | 25.90 | 61 | 3.48% | 0.94% |
| MORF | Morphic Holding | | Biotechnology | 29.50 | 52 | -2.98% | 0.94% |
| ARWR | Arrowhead | | Biotechnology | 25.02 | 52 | 0.81% | 0.93% |
| SEM | Select | | Hospitals | 34.24 | 83 | 1.27% | 0.85% |
| MEDP | Medpace | | Laboratories | 396.65 | 33 | -0.15% | 0.85% |
| BWAY | Brainsway | | Laboratories | 5.42 | 25 | -1.18% | 0.84% |
| AXGN | AxoGen | | Equipment | 6.09 | 37 | -1.77% | 0.83% |
| ISRG | Intuitive Surgical | | Instruments | 402.11 | 78 | 0.52% | 0.82% |
| ALKS | Alkermes | | Biotechnology | 24.34 | 47 | -0.16% | 0.79% |
| RVMD | Revolution Medicines | | Biotechnology | 39.72 | 66 | -0.77% | 0.79% |
| SRDX | Surmodics | | Diagnostic | 34.89 | 90 | -0.48% | 0.78% |
| IOVA | Iovance Bio | | Biotechnology | 10.32 | 10 | -0.29% | 0.78% |
| AMGN | Amgen | | Biotechnology | 314.85 | 68 | 0.10% | 0.76% |
| BEAM | Beam | | Biotechnology | 24.80 | 50 | -0.16% | 0.73% |
| TGTX | TG | | Biotechnology | 16.60 | 42 | 0.73% | 0.73% |
| PBH | Prestige Consumer | | Equipment | 65.05 | 32 | 0.54% | 0.62% |
| KALA | Kala | | Biotechnology | 6.59 | 10 | -0.60% | 0.61% |
| SYBX | Synlogic | | Biotechnology | 1.66 | 10 | 2.47% | 0.61% |
| TYRA | Tyra Biosciences | | Biotechnology | 18.37 | 27 | -1.87% | 0.60% |
| SNY | Sanofi | | Pharmaceutical | 48.95 | 73 | 1.09% | 0.58% |
| BYSI | BeyondSpring | | Biotechnology | 2.69 | 63 | 2.28% | 0.56% |
| For chart view version of above stock list: Chart View ➞ 0 - 25 , 25 - 50 , 50 - 75 , 75 - 100 , 100 - 125 , 125 - 150 , 150 - 175 , 175 - 200 , 200 - 225 , 225 - 250 , 250 - 275 , 275 - 300 , 300 - 325 , 325 - 350 , 350 - 375 , 375 - 400 , 400 - 425 , 425 - 450 , 450 - 475 , 475 - 500 , 500 - 525 , 525 - 550 , 550 - 575 , 575 - 600 , 600 - 625 , 625 - 650 , 650 - 675 , 675 - 700 , 700 - 725 | ||
 | Click To Change The Sort Order: By Market Cap or Company Size Performance: Year-to-date, Week and Day |  |
|
Get the most comprehensive stock market coverage daily at 12Stocks.com ➞ Best Stocks Today ➞ Best Stocks Weekly ➞ Best Stocks Year-to-Date ➞ Best Stocks Trends ➞  Best Stocks Today 12Stocks.com Best Nasdaq Stocks ➞ Best S&P 500 Stocks ➞ Best Tech Stocks ➞ Best Biotech Stocks ➞ |
| Detailed Overview of Healthcare Stocks |
| Healthcare Technical Overview, Leaders & Laggards, Top Healthcare ETF Funds & Detailed Healthcare Stocks List, Charts, Trends & More |
| Healthcare Sector: Technical Analysis, Trends & YTD Performance | |
| Healthcare sector is composed of stocks
from pharmaceutical, biotech, diagnostics labs, insurance providers
and healthcare services. Healthcare sector, as represented by XLV, an exchange-traded fund [ETF] that holds basket of Healthcare stocks (e.g, Merck, Amgen) is up by 7.24% and is currently underperforming the overall market by -3.67% year-to-date. Below is a quick view of Technical charts and trends: |
|
 XLV Weekly Chart |
|
| Long Term Trend: Very Good | |
| Medium Term Trend: Very Good | |
 XLV Daily Chart |
|
| Short Term Trend: Not Good | |
| Overall Trend Score: 83 | |
| YTD Performance: 7.24% | |
| **Trend Scores & Views Are Only For Educational Purposes And Not For Investing | |
| 12Stocks.com: Top Performing Healthcare Sector Stocks | ||||||||||||||||||||||||||||||||||||||||||||||||
 The top performing Healthcare sector stocks year to date are
Now, more recently, over last week, the top performing Healthcare sector stocks on the move are


|
||||||||||||||||||||||||||||||||||||||||||||||||
| 12Stocks.com: Investing in Healthcare Sector using Exchange Traded Funds | |
|
The following table shows list of key exchange traded funds (ETF) that
help investors track Healthcare Index. For detailed view, check out our ETF Funds section of our website. Quick View: Move mouse or cursor over ETF symbol (ticker) to view short-term Technical chart and over ETF name to view long term chart. Click on ticker or stock name for detailed view. Click on to add stock symbol to your watchlist and to view watchlist. |
12Stocks.com List of ETFs that track Healthcare Index
| Ticker | ETF Name | Watchlist | Recent Price | Smart Investing & Trading Score | Change % | Week % | Year-to-date % |
| XLV | Health Care | | 146.25 | 83 | 0.17 | -0.04 | 7.24% |
| XBI | Biotech | | 91.57 | 45 | -0.76 | 0.43 | 2.55% |
| IBB | Biotechnology | | 136.91 | 70 | -0.44 | 0.16 | 0.78% |
| BBH | Biotech | | 168.15 | 83 | -0.26 | 0.1 | 1.72% |
| VHT | Health Care | | 266.91 | 67 | 0.02 | -0.07 | 6.47% |
| IYH | Healthcare | | 61.39 | 62 | 0.24 | 0.08 | 7.24% |
| IHF | Healthcare Providers | | 53.71 | 76 | 0.32 | -0.37 | 2.29% |
| IHI | Medical Devices | | 56.36 | 30 | -0.16 | -0.58 | 4.43% |
| BIB | Biotechnology | | 57.47 | 63 | -0.73 | 0.9 | 0.74% |
| BIS | Short Biotech | | 17.59 | 18 | 1.47 | -0.03 | -2.68% |
| XHE | Health Care Equipment | | 86.97 | 61 | -0.61 | -0.55 | 3.22% |
| CURE | Healthcare Bull 3X | | 118.89 | 70 | 0.55 | -0.18 | 16.86% |
| LABU | Biotech Bull 3X | | 113.12 | 32 | -2.31 | 1.19 | -7.26% |
| LABD | Biotech Bear 3X | | 7.83 | 61 | 2.09 | -1.51 | -19.2% |
| PSCH | SmallCap Health Care | | 43.31 | 56 | -0.31 | -0.19 | 1.2% |
| XHS | Health Care Services | | 91.28 | 73 | -0.65 | -0.29 | 2.62% |
| PTH | DWA Healthcare Momentum | | 42.76 | 35 | -0.81 | 0.3 | 9.25% |
| BTEC | Principal Healthcare Innovators | | 36.49 | 28 | -1.23 | 0.02 | 0.43% |
| RXL | Health Care | | 103.09 | 83 | 0.19 | 0.32 | 12.79% |
| RXD | Short Health Care | | 10.57 | 25 | 0.00 | 0.07 | -11.36% |
| 12Stocks.com: Charts, Trends, Fundamental Data and Performances of Healthcare Stocks | |
|
We now take in-depth look at all Healthcare stocks including charts, multi-period performances and overall trends (as measured by Smart Investing & Trading Score). One can sort Healthcare stocks (click link to choose) by Daily, Weekly and by Year-to-Date performances. Also, one can sort by size of the company or by market capitalization. |
| Select Your Default Chart Type: | |||||
| |||||
| Click on stock symbol or name for detailed view. Click on to add stock symbol to your watchlist and to view watchlist. Quick View: Move mouse or cursor over "Daily" to quickly view daily Technical stock chart and over "Weekly" to view weekly Technical stock chart. | |||||

 | KRON Kronos Bio, Inc. |
| Sector: Health Care | |
| SubSector: Biotechnology | |
| MarketCap: 17287 Millions | |
| Recent Price: 1.03 Smart Investing & Trading Score: 55 | |
| Day Percent Change: -0.96% Day Change: -0.01 | |
| Week Change: 0.98% Year-to-date Change: -17.6% | |
| KRON Links: Profile News Message Board | |
| Charts:- Daily , Weekly | |
| Add KRON to Watchlist: View: Get Complete KRON Trend Analysis ➞ | |
 | RDY Dr. Reddy s Laboratories Limited |
| Sector: Health Care | |
| SubSector: Drug Manufacturers - Other | |
| MarketCap: 6590.23 Millions | |
| Recent Price: 68.92 Smart Investing & Trading Score: 17 | |
| Day Percent Change: 0.31% Day Change: 0.21 | |
| Week Change: 0.97% Year-to-date Change: -1.0% | |
| RDY Links: Profile News Message Board | |
| Charts:- Daily , Weekly | |
| Add RDY to Watchlist: View: Get Complete RDY Trend Analysis ➞ | |
 | WVE Wave Life Sciences Ltd. |
| Sector: Health Care | |
| SubSector: Biotechnology | |
| MarketCap: 452.785 Millions | |
| Recent Price: 6.32 Smart Investing & Trading Score: 100 | |
| Day Percent Change: -0.94% Day Change: -0.06 | |
| Week Change: 0.96% Year-to-date Change: 25.2% | |
| WVE Links: Profile News Message Board | |
| Charts:- Daily , Weekly | |
| Add WVE to Watchlist: View: Get Complete WVE Trend Analysis ➞ | |
 | APLT Applied Therapeutics, Inc. |
| Sector: Health Care | |
| SubSector: Biotechnology | |
| MarketCap: 641.285 Millions | |
| Recent Price: 4.23 Smart Investing & Trading Score: 18 | |
| Day Percent Change: 0.71% Day Change: 0.03 | |
| Week Change: 0.95% Year-to-date Change: 26.3% | |
| APLT Links: Profile News Message Board | |
| Charts:- Daily , Weekly | |
| Add APLT to Watchlist: View: Get Complete APLT Trend Analysis ➞ | |
 | XOMA XOMA Corporation |
| Sector: Health Care | |
| SubSector: Biotechnology | |
| MarketCap: 174.885 Millions | |
| Recent Price: 25.90 Smart Investing & Trading Score: 61 | |
| Day Percent Change: 3.48% Day Change: 0.87 | |
| Week Change: 0.94% Year-to-date Change: 40.0% | |
| XOMA Links: Profile News Message Board | |
| Charts:- Daily , Weekly | |
| Add XOMA to Watchlist: View: Get Complete XOMA Trend Analysis ➞ | |
 | MORF Morphic Holding, Inc. |
| Sector: Health Care | |
| SubSector: Biotechnology | |
| MarketCap: 484.885 Millions | |
| Recent Price: 29.50 Smart Investing & Trading Score: 52 | |
| Day Percent Change: -2.98% Day Change: -0.91 | |
| Week Change: 0.94% Year-to-date Change: 2.2% | |
| MORF Links: Profile News Message Board | |
| Charts:- Daily , Weekly | |
| Add MORF to Watchlist: View: Get Complete MORF Trend Analysis ➞ | |
 | ARWR Arrowhead Pharmaceuticals, Inc. |
| Sector: Health Care | |
| SubSector: Biotechnology | |
| MarketCap: 3226.15 Millions | |
| Recent Price: 25.02 Smart Investing & Trading Score: 52 | |
| Day Percent Change: 0.81% Day Change: 0.20 | |
| Week Change: 0.93% Year-to-date Change: -18.2% | |
| ARWR Links: Profile News Message Board | |
| Charts:- Daily , Weekly | |
| Add ARWR to Watchlist: View: Get Complete ARWR Trend Analysis ➞ | |
 | SEM Select Medical Holdings Corporation |
| Sector: Health Care | |
| SubSector: Hospitals | |
| MarketCap: 1765.96 Millions | |
| Recent Price: 34.24 Smart Investing & Trading Score: 83 | |
| Day Percent Change: 1.27% Day Change: 0.43 | |
| Week Change: 0.85% Year-to-date Change: 45.7% | |
| SEM Links: Profile News Message Board | |
| Charts:- Daily , Weekly | |
| Add SEM to Watchlist: View: Get Complete SEM Trend Analysis ➞ | |
 | MEDP Medpace Holdings, Inc. |
| Sector: Health Care | |
| SubSector: Medical Laboratories & Research | |
| MarketCap: 2888.7 Millions | |
| Recent Price: 396.65 Smart Investing & Trading Score: 33 | |
| Day Percent Change: -0.15% Day Change: -0.60 | |
| Week Change: 0.85% Year-to-date Change: 29.4% | |
| MEDP Links: Profile News Message Board | |
| Charts:- Daily , Weekly | |
| Add MEDP to Watchlist: View: Get Complete MEDP Trend Analysis ➞ | |
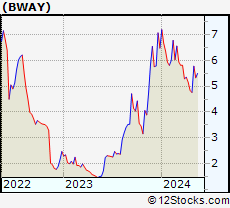 | BWAY Brainsway Ltd. |
| Sector: Health Care | |
| SubSector: Medical Laboratories & Research | |
| MarketCap: 65.03 Millions | |
| Recent Price: 5.42 Smart Investing & Trading Score: 25 | |
| Day Percent Change: -1.18% Day Change: -0.07 | |
| Week Change: 0.84% Year-to-date Change: -16.3% | |
| BWAY Links: Profile News Message Board | |
| Charts:- Daily , Weekly | |
| Add BWAY to Watchlist: View: Get Complete BWAY Trend Analysis ➞ | |
 | AXGN AxoGen, Inc. |
| Sector: Health Care | |
| SubSector: Medical Appliances & Equipment | |
| MarketCap: 349.28 Millions | |
| Recent Price: 6.09 Smart Investing & Trading Score: 37 | |
| Day Percent Change: -1.77% Day Change: -0.11 | |
| Week Change: 0.83% Year-to-date Change: -10.8% | |
| AXGN Links: Profile News Message Board | |
| Charts:- Daily , Weekly | |
| Add AXGN to Watchlist: View: Get Complete AXGN Trend Analysis ➞ | |
 | ISRG Intuitive Surgical, Inc. |
| Sector: Health Care | |
| SubSector: Medical Instruments & Supplies | |
| MarketCap: 50917.5 Millions | |
| Recent Price: 402.11 Smart Investing & Trading Score: 78 | |
| Day Percent Change: 0.52% Day Change: 2.08 | |
| Week Change: 0.82% Year-to-date Change: 19.2% | |
| ISRG Links: Profile News Message Board | |
| Charts:- Daily , Weekly | |
| Add ISRG to Watchlist: View: Get Complete ISRG Trend Analysis ➞ | |
 | ALKS Alkermes plc |
| Sector: Health Care | |
| SubSector: Biotechnology | |
| MarketCap: 2311.95 Millions | |
| Recent Price: 24.34 Smart Investing & Trading Score: 47 | |
| Day Percent Change: -0.16% Day Change: -0.04 | |
| Week Change: 0.79% Year-to-date Change: -12.3% | |
| ALKS Links: Profile News Message Board | |
| Charts:- Daily , Weekly | |
| Add ALKS to Watchlist: View: Get Complete ALKS Trend Analysis ➞ | |
 | RVMD Revolution Medicines, Inc. |
| Sector: Health Care | |
| SubSector: Biotechnology | |
| MarketCap: 28087 Millions | |
| Recent Price: 39.72 Smart Investing & Trading Score: 66 | |
| Day Percent Change: -0.77% Day Change: -0.31 | |
| Week Change: 0.79% Year-to-date Change: 38.5% | |
| RVMD Links: Profile News Message Board | |
| Charts:- Daily , Weekly | |
| Add RVMD to Watchlist: View: Get Complete RVMD Trend Analysis ➞ | |
 | SRDX Surmodics, Inc. |
| Sector: Health Care | |
| SubSector: Diagnostic Substances | |
| MarketCap: 388.171 Millions | |
| Recent Price: 34.89 Smart Investing & Trading Score: 90 | |
| Day Percent Change: -0.48% Day Change: -0.17 | |
| Week Change: 0.78% Year-to-date Change: -4.0% | |
| SRDX Links: Profile News Message Board | |
| Charts:- Daily , Weekly | |
| Add SRDX to Watchlist: View: Get Complete SRDX Trend Analysis ➞ | |
 | IOVA Iovance Biotherapeutics, Inc. |
| Sector: Health Care | |
| SubSector: Biotechnology | |
| MarketCap: 3533.35 Millions | |
| Recent Price: 10.32 Smart Investing & Trading Score: 10 | |
| Day Percent Change: -0.29% Day Change: -0.03 | |
| Week Change: 0.78% Year-to-date Change: 26.9% | |
| IOVA Links: Profile News Message Board | |
| Charts:- Daily , Weekly | |
| Add IOVA to Watchlist: View: Get Complete IOVA Trend Analysis ➞ | |
 | AMGN Amgen Inc. |
| Sector: Health Care | |
| SubSector: Biotechnology | |
| MarketCap: 121030 Millions | |
| Recent Price: 314.85 Smart Investing & Trading Score: 68 | |
| Day Percent Change: 0.10% Day Change: 0.31 | |
| Week Change: 0.76% Year-to-date Change: 9.3% | |
| AMGN Links: Profile News Message Board | |
| Charts:- Daily , Weekly | |
| Add AMGN to Watchlist: View: Get Complete AMGN Trend Analysis ➞ | |
 | BEAM Beam Therapeutics Inc. |
| Sector: Health Care | |
| SubSector: Biotechnology | |
| MarketCap: 44987 Millions | |
| Recent Price: 24.80 Smart Investing & Trading Score: 50 | |
| Day Percent Change: -0.16% Day Change: -0.04 | |
| Week Change: 0.73% Year-to-date Change: -8.9% | |
| BEAM Links: Profile News Message Board | |
| Charts:- Daily , Weekly | |
| Add BEAM to Watchlist: View: Get Complete BEAM Trend Analysis ➞ | |
 | TGTX TG Therapeutics, Inc. |
| Sector: Health Care | |
| SubSector: Biotechnology | |
| MarketCap: 1022.85 Millions | |
| Recent Price: 16.60 Smart Investing & Trading Score: 42 | |
| Day Percent Change: 0.73% Day Change: 0.12 | |
| Week Change: 0.73% Year-to-date Change: -2.8% | |
| TGTX Links: Profile News Message Board | |
| Charts:- Daily , Weekly | |
| Add TGTX to Watchlist: View: Get Complete TGTX Trend Analysis ➞ | |
 | PBH Prestige Consumer Healthcare Inc. |
| Sector: Health Care | |
| SubSector: Medical Appliances & Equipment | |
| MarketCap: 1639.6 Millions | |
| Recent Price: 65.05 Smart Investing & Trading Score: 32 | |
| Day Percent Change: 0.54% Day Change: 0.35 | |
| Week Change: 0.62% Year-to-date Change: 6.3% | |
| PBH Links: Profile News Message Board | |
| Charts:- Daily , Weekly | |
| Add PBH to Watchlist: View: Get Complete PBH Trend Analysis ➞ | |
 | KALA Kala Pharmaceuticals, Inc. |
| Sector: Health Care | |
| SubSector: Biotechnology | |
| MarketCap: 276.485 Millions | |
| Recent Price: 6.59 Smart Investing & Trading Score: 10 | |
| Day Percent Change: -0.60% Day Change: -0.04 | |
| Week Change: 0.61% Year-to-date Change: -5.9% | |
| KALA Links: Profile News Message Board | |
| Charts:- Daily , Weekly | |
| Add KALA to Watchlist: View: Get Complete KALA Trend Analysis ➞ | |
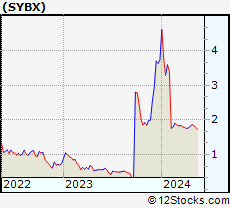 | SYBX Synlogic, Inc. |
| Sector: Health Care | |
| SubSector: Biotechnology | |
| MarketCap: 65.4785 Millions | |
| Recent Price: 1.66 Smart Investing & Trading Score: 10 | |
| Day Percent Change: 2.47% Day Change: 0.04 | |
| Week Change: 0.61% Year-to-date Change: -55.7% | |
| SYBX Links: Profile News Message Board | |
| Charts:- Daily , Weekly | |
| Add SYBX to Watchlist: View: Get Complete SYBX Trend Analysis ➞ | |
 | TYRA Tyra Biosciences, Inc. |
| Sector: Health Care | |
| SubSector: Biotechnology | |
| MarketCap: 732 Millions | |
| Recent Price: 18.37 Smart Investing & Trading Score: 27 | |
| Day Percent Change: -1.87% Day Change: -0.35 | |
| Week Change: 0.6% Year-to-date Change: 37.8% | |
| TYRA Links: Profile News Message Board | |
| Charts:- Daily , Weekly | |
| Add TYRA to Watchlist: View: Get Complete TYRA Trend Analysis ➞ | |
 | SNY Sanofi |
| Sector: Health Care | |
| SubSector: Drug Manufacturers - Major | |
| MarketCap: 104761 Millions | |
| Recent Price: 48.95 Smart Investing & Trading Score: 73 | |
| Day Percent Change: 1.09% Day Change: 0.53 | |
| Week Change: 0.58% Year-to-date Change: -1.6% | |
| SNY Links: Profile News Message Board | |
| Charts:- Daily , Weekly | |
| Add SNY to Watchlist: View: Get Complete SNY Trend Analysis ➞ | |
 | BYSI BeyondSpring Inc. |
| Sector: Health Care | |
| SubSector: Biotechnology | |
| MarketCap: 432.785 Millions | |
| Recent Price: 2.69 Smart Investing & Trading Score: 63 | |
| Day Percent Change: 2.28% Day Change: 0.06 | |
| Week Change: 0.56% Year-to-date Change: 198.9% | |
| BYSI Links: Profile News Message Board | |
| Charts:- Daily , Weekly | |
| Add BYSI to Watchlist: View: Get Complete BYSI Trend Analysis ➞ | |
| For tabular summary view of above stock list: Summary View ➞ 0 - 25 , 25 - 50 , 50 - 75 , 75 - 100 , 100 - 125 , 125 - 150 , 150 - 175 , 175 - 200 , 200 - 225 , 225 - 250 , 250 - 275 , 275 - 300 , 300 - 325 , 325 - 350 , 350 - 375 , 375 - 400 , 400 - 425 , 425 - 450 , 450 - 475 , 475 - 500 , 500 - 525 , 525 - 550 , 550 - 575 , 575 - 600 , 600 - 625 , 625 - 650 , 650 - 675 , 675 - 700 , 700 - 725 | ||
| Click To Change The Sort Order: By Market Cap or Company Size Performance: Year-to-date, Week and Day | |
| Select Chart Type: | ||
|
Best Stocks Today 12Stocks.com |
© 2024 12Stocks.com Terms & Conditions Privacy Contact Us
All Information Provided Only For Education And Not To Be Used For Investing or Trading. See Terms & Conditions


One More Thing ... Get Best Stocks Delivered Daily!
Never Ever Miss A Move With Our Top Ten Stocks Lists
Find Best Stocks In Any Market - Bull or Bear Market
Take A Peek At Our Top Ten Stocks Lists: Daily, Weekly, Year-to-Date & Top Trends
Find Best Stocks In Any Market - Bull or Bear Market
Take A Peek At Our Top Ten Stocks Lists: Daily, Weekly, Year-to-Date & Top Trends
Healthcare Stocks With Best Up Trends [0-bearish to 100-bullish]: Brainstorm Cell[100], Third Harmonic[100], Concord [100], Arbutus Biopharma[100], Tandem Diabetes[100], PureTech Health[100], Genfit SA[100], Heron [100], Integer [100], Vericel [100], Boston Scientific[100]
Best Healthcare Stocks Year-to-Date:
Pieris [6042.86%], Precision BioSciences[3472.6%], Avenue [2266.46%], Inovio [2054.9%], Assembly Biosciences[1748.56%], Aurora Cannabis[1398.32%], Agenus [1243.16%], NuCana [1103.52%], Adverum Biotechnologies[944.1%], Affimed N.V[724%], Burning Rock[690.76%] Best Healthcare Stocks This Week:
DURECT [37.07%], Genelux [31.78%], Nobilis Health[29.53%], Concord [29.19%], iBio [26.29%], Pulse Biosciences[24.58%], Accelerate Diagnostics[23.02%], Scilex Holding[22.22%], Dyne [17.88%], PTC [17.39%], CareMax [16.61%] Best Healthcare Stocks Daily:
DURECT [24.04%], Accelerate Diagnostics[23.66%], CareMax [17.83%], RAPT [15.00%], Pulse Biosciences[13.40%], Genelux [11.86%], Relay [11.58%], Sol-Gel Technologies[10.62%], Brainstorm Cell[9.35%], Vaxxinity [9.30%], Third Harmonic[8.54%]