
 Login Sign Up


| |||||
 |  | ||||

| 12Stocks.com Market Intelligence |
Best Healthcare Stocks
 | "Discover best trending healthcare stocks with 12Stocks.com." |
| - Subu Vdaygiri, Founder, 12Stocks.com |
| In a hurry? Healthcare Stocks Lists: Performance Trends Table, Stock Charts
Sort Healthcare stocks: Daily, Weekly, Year-to-Date, Market Cap & Trends. Filter Healthcare stocks list by size:All Healthcare Large Mid-Range Small |
| 12Stocks.com Healthcare Stocks Performances & Trends Daily | |||||||||
|
|  The overall Smart Investing & Trading Score is 18 (0-bearish to 100-bullish) which puts Healthcare sector in short term bearish trend. The Smart Investing & Trading Score from previous trading session is 10 and an improvement of trend continues.
| ||||||||
Here are the Smart Investing & Trading Scores of the most requested Healthcare stocks at 12Stocks.com (click stock name for detailed review):
|


| 12Stocks.com: Investing in Healthcare sector with Stocks | |
|
The following table helps investors and traders sort through current performance and trends (as measured by Smart Investing & Trading Score) of various
stocks in the Healthcare sector. Quick View: Move mouse or cursor over stock symbol (ticker) to view short-term Technical chart and over stock name to view long term chart. Click on  to add stock symbol to your watchlist and to add stock symbol to your watchlist and  to view watchlist. Click on any ticker or stock name for detailed market intelligence report for that stock. to view watchlist. Click on any ticker or stock name for detailed market intelligence report for that stock. |
12Stocks.com Performance of Stocks in Healthcare Sector
| Ticker | Stock Name | Watchlist | Category | Recent Price | Smart Investing & Trading Score | Change % | Weekly Change% |
| ZYXI | Zynex |   | Equipment | 11.45 | 0 | -5.14% | -3.86% |
| BIIB | Biogen | | Biotechnology | 190.52 | 0 | -0.85% | -3.87% |
| BLFS | BioLife | | Instruments | 15.86 | 35 | 4.76% | -3.88% |
| FNA | Paragon 28 | | Medical Devices | 9.85 | 35 | 1.23% | -3.90% |
| TEVA | Teva | | Pharmaceutical | 12.78 | 26 | -3.03% | -3.91% |
| ANGO | AngioDynamics | | Instruments | 6.12 | 51 | -3.32% | -3.92% |
| ACHC | Acadia | | Specialized | 70.28 | 0 | 0.04% | -3.96% |
| MORF | Morphic Holding | | Biotechnology | 27.51 | 10 | -1.29% | -4.01% |
| IDXX | IDEXX | | Diagnostic | 477.79 | 10 | -0.09% | -4.02% |
| TRVN | Trevena | | Biotechnology | 0.37 | 0 | -8.96% | -4.04% |
| SPRB | Spruce Biosciences | | Biotechnology | 0.71 | 37 | 0.24% | -4.05% |
| AMLX | Amylyx | | Biotechnology | 2.02 | 22 | 1.26% | -4.05% |
| MIRM | Mirum | | Biotechnology | 23.57 | 0 | -1.17% | -4.11% |
| ELMD | Electromed | | Equipment | 13.94 | 36 | -1.34% | -4.13% |
| ZBH | Zimmer Biomet | | Equipment | 119.33 | 0 | -1.62% | -4.14% |
| MOH | Molina | | Insurance | 360.94 | 51 | 0.30% | -4.15% |
| TMO | Thermo Fisher | | Laboratories | 541.52 | 13 | -1.05% | -4.19% |
| NVCT | Nuvectis Pharma | | Biotechnology | 6.72 | 25 | -0.07% | -4.20% |
| DVAX | Dynavax Technologies | | Biotechnology | 11.34 | 0 | -0.79% | -4.22% |
| SMMT | Summit | | Biotechnology | 3.51 | 7 | -1.68% | -4.23% |
| EW | Edwards Lifesciences | | Equipment | 86.45 | 36 | -0.91% | -4.24% |
| AXON | Axovant Sciences | | Biotechnology | 297.59 | 33 | -0.74% | -4.25% |
| SYK | Stryker | | Equipment | 327.45 | 0 | -2.55% | -4.27% |
| TBPH | Theravance Biopharma | | Biotechnology | 9.20 | 32 | -3.36% | -4.27% |
| AVAH | Aveanna | | Medical Care Facilities | 2.24 | 17 | 1.13% | -4.27% |
| For chart view version of above stock list: Chart View ➞ 0 - 25 , 25 - 50 , 50 - 75 , 75 - 100 , 100 - 125 , 125 - 150 , 150 - 175 , 175 - 200 , 200 - 225 , 225 - 250 , 250 - 275 , 275 - 300 , 300 - 325 , 325 - 350 , 350 - 375 , 375 - 400 , 400 - 425 , 425 - 450 , 450 - 475 , 475 - 500 , 500 - 525 , 525 - 550 , 550 - 575 , 575 - 600 , 600 - 625 , 625 - 650 , 650 - 675 , 675 - 700 , 700 - 725 | ||
 | Click To Change The Sort Order: By Market Cap or Company Size Performance: Year-to-date, Week and Day |  |
|
Get the most comprehensive stock market coverage daily at 12Stocks.com ➞ Best Stocks Today ➞ Best Stocks Weekly ➞ Best Stocks Year-to-Date ➞ Best Stocks Trends ➞  Best Stocks Today 12Stocks.com Best Nasdaq Stocks ➞ Best S&P 500 Stocks ➞ Best Tech Stocks ➞ Best Biotech Stocks ➞ |
| Detailed Overview of Healthcare Stocks |
| Healthcare Technical Overview, Leaders & Laggards, Top Healthcare ETF Funds & Detailed Healthcare Stocks List, Charts, Trends & More |
| Healthcare Sector: Technical Analysis, Trends & YTD Performance | |
| Healthcare sector is composed of stocks
from pharmaceutical, biotech, diagnostics labs, insurance providers
and healthcare services. Healthcare sector, as represented by XLV, an exchange-traded fund [ETF] that holds basket of Healthcare stocks (e.g, Merck, Amgen) is up by 1.5% and is currently underperforming the overall market by -2.69% year-to-date. Below is a quick view of Technical charts and trends: |
|
 XLV Weekly Chart |
|
| Long Term Trend: Not Good | |
| Medium Term Trend: Not Good | |
 XLV Daily Chart |
|
| Short Term Trend: Deteriorating | |
| Overall Trend Score: 18 | |
| YTD Performance: 1.5% | |
| **Trend Scores & Views Are Only For Educational Purposes And Not For Investing | |
| 12Stocks.com: Top Performing Healthcare Sector Stocks | ||||||||||||||||||||||||||||||||||||||||||||||||
 The top performing Healthcare sector stocks year to date are
Now, more recently, over last week, the top performing Healthcare sector stocks on the move are


|
||||||||||||||||||||||||||||||||||||||||||||||||
| 12Stocks.com: Investing in Healthcare Sector using Exchange Traded Funds | |
|
The following table shows list of key exchange traded funds (ETF) that
help investors track Healthcare Index. For detailed view, check out our ETF Funds section of our website. Quick View: Move mouse or cursor over ETF symbol (ticker) to view short-term Technical chart and over ETF name to view long term chart. Click on ticker or stock name for detailed view. Click on to add stock symbol to your watchlist and to view watchlist. |
12Stocks.com List of ETFs that track Healthcare Index
| Ticker | ETF Name | Watchlist | Recent Price | Smart Investing & Trading Score | Change % | Week % | Year-to-date % |
| XLV | Health Care | | 138.43 | 18 | -0.01 | -0.35 | 1.5% |
| XBI | Biotech | | 83.48 | 10 | -1.38 | -5.3 | -6.51% |
| IBB | Biotechnology | | 124.64 | 0 | -0.99 | -3.81 | -8.25% |
| BBH | Biotech | | 152.35 | 10 | -0.43 | -3.33 | -7.84% |
| VHT | Health Care | | 252.83 | 18 | -0.12 | -0.76 | 0.85% |
| IYH | Healthcare | | 58.05 | 10 | -0.02 | -0.6 | 1.4% |
| IHF | Healthcare Providers | | 51.55 | 32 | 0.93 | 1.99 | -1.84% |
| IHI | Medical Devices | | 54.53 | 5 | -0.46 | -2.8 | 1.04% |
| BIB | Biotechnology | | 47.94 | 0 | -2.02 | -6.71 | -15.97% |
| BIS | Short Biotech | | 20.87 | 100 | 1.69 | 6.46 | 15.47% |
| XHE | Health Care Equipment | | 81.44 | 20 | -0.74 | -2.93 | -3.35% |
| CURE | Healthcare Bull 3X | | 102.22 | 18 | -0.44 | -1.14 | 0.47% |
| LABU | Biotech Bull 3X | | 88.04 | 10 | -4.33 | -15.63 | -27.82% |
| LABD | Biotech Bear 3X | | 10.52 | 82 | 4.37 | 17.15 | 8.57% |
| PSCH | SmallCap Health Care | | 40.08 | 20 | -0.87 | -3.26 | -6.36% |
| XHS | Health Care Services | | 86.19 | 10 | -0.16 | -2.07 | -3.1% |
| PTH | DWA Healthcare Momentum | | 39.57 | 46 | -2.18 | -5.4 | 1.1% |
| BTEC | Principal Healthcare Innovators | | 34.09 | 0 | -1.51 | -5.29 | -6.17% |
| RXL | Health Care | | 92.44 | 10 | -0.61 | -0.88 | 1.13% |
| RXD | Short Health Care | | 11.67 | 76 | -0.05 | 0.64 | -2.11% |
| 12Stocks.com: Charts, Trends, Fundamental Data and Performances of Healthcare Stocks | |
|
We now take in-depth look at all Healthcare stocks including charts, multi-period performances and overall trends (as measured by Smart Investing & Trading Score). One can sort Healthcare stocks (click link to choose) by Daily, Weekly and by Year-to-Date performances. Also, one can sort by size of the company or by market capitalization. |
| Select Your Default Chart Type: | |||||
| |||||
| Click on stock symbol or name for detailed view. Click on to add stock symbol to your watchlist and to view watchlist. Quick View: Move mouse or cursor over "Daily" to quickly view daily Technical stock chart and over "Weekly" to view weekly Technical stock chart. | |||||

 | ZYXI Zynex, Inc. |
| Sector: Health Care | |
| SubSector: Medical Appliances & Equipment | |
| MarketCap: 388.58 Millions | |
| Recent Price: 11.45 Smart Investing & Trading Score: 0 | |
| Day Percent Change: -5.14% Day Change: -0.62 | |
| Week Change: -3.86% Year-to-date Change: 5.1% | |
| ZYXI Links: Profile News Message Board | |
| Charts:- Daily , Weekly | |
| Add ZYXI to Watchlist: View: Get Complete ZYXI Trend Analysis ➞ | |
 | BIIB Biogen Inc. |
| Sector: Health Care | |
| SubSector: Biotechnology | |
| MarketCap: 53102.6 Millions | |
| Recent Price: 190.52 Smart Investing & Trading Score: 0 | |
| Day Percent Change: -0.85% Day Change: -1.64 | |
| Week Change: -3.87% Year-to-date Change: -26.4% | |
| BIIB Links: Profile News Message Board | |
| Charts:- Daily , Weekly | |
| Add BIIB to Watchlist: View: Get Complete BIIB Trend Analysis ➞ | |
 | BLFS BioLife Solutions, Inc. |
| Sector: Health Care | |
| SubSector: Medical Instruments & Supplies | |
| MarketCap: 264.36 Millions | |
| Recent Price: 15.86 Smart Investing & Trading Score: 35 | |
| Day Percent Change: 4.76% Day Change: 0.72 | |
| Week Change: -3.88% Year-to-date Change: -2.4% | |
| BLFS Links: Profile News Message Board | |
| Charts:- Daily , Weekly | |
| Add BLFS to Watchlist: View: Get Complete BLFS Trend Analysis ➞ | |
 | FNA Paragon 28, Inc. |
| Sector: Health Care | |
| SubSector: Medical Devices | |
| MarketCap: 1420 Millions | |
| Recent Price: 9.85 Smart Investing & Trading Score: 35 | |
| Day Percent Change: 1.23% Day Change: 0.12 | |
| Week Change: -3.9% Year-to-date Change: -21.0% | |
| FNA Links: Profile News Message Board | |
| Charts:- Daily , Weekly | |
| Add FNA to Watchlist: View: Get Complete FNA Trend Analysis ➞ | |
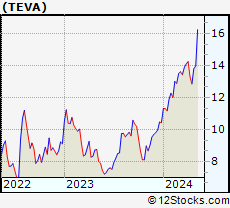 | TEVA Teva Pharmaceutical Industries Limited |
| Sector: Health Care | |
| SubSector: Drug Manufacturers - Other | |
| MarketCap: 9369.93 Millions | |
| Recent Price: 12.78 Smart Investing & Trading Score: 26 | |
| Day Percent Change: -3.03% Day Change: -0.40 | |
| Week Change: -3.91% Year-to-date Change: 22.4% | |
| TEVA Links: Profile News Message Board | |
| Charts:- Daily , Weekly | |
| Add TEVA to Watchlist: View: Get Complete TEVA Trend Analysis ➞ | |
 | ANGO AngioDynamics, Inc. |
| Sector: Health Care | |
| SubSector: Medical Instruments & Supplies | |
| MarketCap: 370.86 Millions | |
| Recent Price: 6.12 Smart Investing & Trading Score: 51 | |
| Day Percent Change: -3.32% Day Change: -0.21 | |
| Week Change: -3.92% Year-to-date Change: -21.9% | |
| ANGO Links: Profile News Message Board | |
| Charts:- Daily , Weekly | |
| Add ANGO to Watchlist: View: Get Complete ANGO Trend Analysis ➞ | |
 | ACHC Acadia Healthcare Company, Inc. |
| Sector: Health Care | |
| SubSector: Specialized Health Services | |
| MarketCap: 1331.56 Millions | |
| Recent Price: 70.28 Smart Investing & Trading Score: 0 | |
| Day Percent Change: 0.04% Day Change: 0.03 | |
| Week Change: -3.96% Year-to-date Change: -9.6% | |
| ACHC Links: Profile News Message Board | |
| Charts:- Daily , Weekly | |
| Add ACHC to Watchlist: View: Get Complete ACHC Trend Analysis ➞ | |
 | MORF Morphic Holding, Inc. |
| Sector: Health Care | |
| SubSector: Biotechnology | |
| MarketCap: 484.885 Millions | |
| Recent Price: 27.51 Smart Investing & Trading Score: 10 | |
| Day Percent Change: -1.29% Day Change: -0.36 | |
| Week Change: -4.01% Year-to-date Change: -4.7% | |
| MORF Links: Profile News Message Board | |
| Charts:- Daily , Weekly | |
| Add MORF to Watchlist: View: Get Complete MORF Trend Analysis ➞ | |
 | IDXX IDEXX Laboratories, Inc. |
| Sector: Health Care | |
| SubSector: Diagnostic Substances | |
| MarketCap: 15937.1 Millions | |
| Recent Price: 477.79 Smart Investing & Trading Score: 10 | |
| Day Percent Change: -0.09% Day Change: -0.45 | |
| Week Change: -4.02% Year-to-date Change: -13.9% | |
| IDXX Links: Profile News Message Board | |
| Charts:- Daily , Weekly | |
| Add IDXX to Watchlist: View: Get Complete IDXX Trend Analysis ➞ | |
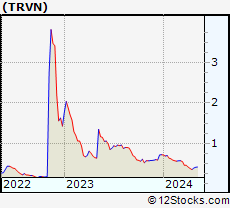 | TRVN Trevena, Inc. |
| Sector: Health Care | |
| SubSector: Biotechnology | |
| MarketCap: 57.7785 Millions | |
| Recent Price: 0.37 Smart Investing & Trading Score: 0 | |
| Day Percent Change: -8.96% Day Change: -0.04 | |
| Week Change: -4.04% Year-to-date Change: -49.3% | |
| TRVN Links: Profile News Message Board | |
| Charts:- Daily , Weekly | |
| Add TRVN to Watchlist: View: Get Complete TRVN Trend Analysis ➞ | |
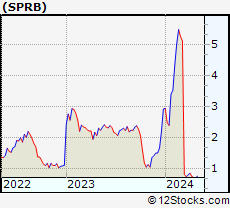 | SPRB Spruce Biosciences, Inc. |
| Sector: Health Care | |
| SubSector: Biotechnology | |
| MarketCap: 49487 Millions | |
| Recent Price: 0.71 Smart Investing & Trading Score: 37 | |
| Day Percent Change: 0.24% Day Change: 0.00 | |
| Week Change: -4.05% Year-to-date Change: -75.8% | |
| SPRB Links: Profile News Message Board | |
| Charts:- Daily , Weekly | |
| Add SPRB to Watchlist: View: Get Complete SPRB Trend Analysis ➞ | |
 | AMLX Amylyx Pharmaceuticals, Inc. |
| Sector: Health Care | |
| SubSector: Biotechnology | |
| MarketCap: 1500 Millions | |
| Recent Price: 2.02 Smart Investing & Trading Score: 22 | |
| Day Percent Change: 1.26% Day Change: 0.03 | |
| Week Change: -4.05% Year-to-date Change: -86.1% | |
| AMLX Links: Profile News Message Board | |
| Charts:- Daily , Weekly | |
| Add AMLX to Watchlist: View: Get Complete AMLX Trend Analysis ➞ | |
 | MIRM Mirum Pharmaceuticals, Inc. |
| Sector: Health Care | |
| SubSector: Biotechnology | |
| MarketCap: 309.585 Millions | |
| Recent Price: 23.57 Smart Investing & Trading Score: 0 | |
| Day Percent Change: -1.17% Day Change: -0.28 | |
| Week Change: -4.11% Year-to-date Change: -20.2% | |
| MIRM Links: Profile News Message Board | |
| Charts:- Daily , Weekly | |
| Add MIRM to Watchlist: View: Get Complete MIRM Trend Analysis ➞ | |
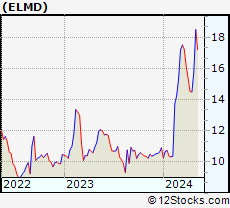 | ELMD Electromed, Inc. |
| Sector: Health Care | |
| SubSector: Medical Appliances & Equipment | |
| MarketCap: 75.708 Millions | |
| Recent Price: 13.94 Smart Investing & Trading Score: 36 | |
| Day Percent Change: -1.34% Day Change: -0.19 | |
| Week Change: -4.13% Year-to-date Change: 27.8% | |
| ELMD Links: Profile News Message Board | |
| Charts:- Daily , Weekly | |
| Add ELMD to Watchlist: View: Get Complete ELMD Trend Analysis ➞ | |
 | ZBH Zimmer Biomet Holdings, Inc. |
| Sector: Health Care | |
| SubSector: Medical Appliances & Equipment | |
| MarketCap: 19339.4 Millions | |
| Recent Price: 119.33 Smart Investing & Trading Score: 0 | |
| Day Percent Change: -1.62% Day Change: -1.97 | |
| Week Change: -4.14% Year-to-date Change: -2.0% | |
| ZBH Links: Profile News Message Board | |
| Charts:- Daily , Weekly | |
| Add ZBH to Watchlist: View: Get Complete ZBH Trend Analysis ➞ | |
 | MOH Molina Healthcare, Inc. |
| Sector: Health Care | |
| SubSector: Health Care Plans | |
| MarketCap: 7235.6 Millions | |
| Recent Price: 360.94 Smart Investing & Trading Score: 51 | |
| Day Percent Change: 0.30% Day Change: 1.09 | |
| Week Change: -4.15% Year-to-date Change: -0.1% | |
| MOH Links: Profile News Message Board | |
| Charts:- Daily , Weekly | |
| Add MOH to Watchlist: View: Get Complete MOH Trend Analysis ➞ | |
 | TMO Thermo Fisher Scientific Inc. |
| Sector: Health Care | |
| SubSector: Medical Laboratories & Research | |
| MarketCap: 112999 Millions | |
| Recent Price: 541.52 Smart Investing & Trading Score: 13 | |
| Day Percent Change: -1.05% Day Change: -5.73 | |
| Week Change: -4.19% Year-to-date Change: 2.0% | |
| TMO Links: Profile News Message Board | |
| Charts:- Daily , Weekly | |
| Add TMO to Watchlist: View: Get Complete TMO Trend Analysis ➞ | |
 | NVCT Nuvectis Pharma, Inc. |
| Sector: Health Care | |
| SubSector: Biotechnology | |
| MarketCap: 258 Millions | |
| Recent Price: 6.72 Smart Investing & Trading Score: 25 | |
| Day Percent Change: -0.07% Day Change: -0.01 | |
| Week Change: -4.2% Year-to-date Change: -18.7% | |
| NVCT Links: Profile News Message Board | |
| Charts:- Daily , Weekly | |
| Add NVCT to Watchlist: View: Get Complete NVCT Trend Analysis ➞ | |
 | DVAX Dynavax Technologies Corporation |
| Sector: Health Care | |
| SubSector: Biotechnology | |
| MarketCap: 276.885 Millions | |
| Recent Price: 11.34 Smart Investing & Trading Score: 0 | |
| Day Percent Change: -0.79% Day Change: -0.09 | |
| Week Change: -4.22% Year-to-date Change: -18.9% | |
| DVAX Links: Profile News Message Board | |
| Charts:- Daily , Weekly | |
| Add DVAX to Watchlist: View: Get Complete DVAX Trend Analysis ➞ | |
 | SMMT Summit Therapeutics plc |
| Sector: Health Care | |
| SubSector: Biotechnology | |
| MarketCap: 156.985 Millions | |
| Recent Price: 3.51 Smart Investing & Trading Score: 7 | |
| Day Percent Change: -1.68% Day Change: -0.06 | |
| Week Change: -4.23% Year-to-date Change: 34.5% | |
| SMMT Links: Profile News Message Board | |
| Charts:- Daily , Weekly | |
| Add SMMT to Watchlist: View: Get Complete SMMT Trend Analysis ➞ | |
 | EW Edwards Lifesciences Corporation |
| Sector: Health Care | |
| SubSector: Medical Appliances & Equipment | |
| MarketCap: 36735.5 Millions | |
| Recent Price: 86.45 Smart Investing & Trading Score: 36 | |
| Day Percent Change: -0.91% Day Change: -0.79 | |
| Week Change: -4.24% Year-to-date Change: 13.4% | |
| EW Links: Profile News Message Board | |
| Charts:- Daily , Weekly | |
| Add EW to Watchlist: View: Get Complete EW Trend Analysis ➞ | |
 | AXON Axovant Sciences Ltd. |
| Sector: Health Care | |
| SubSector: Biotechnology | |
| MarketCap: 1492.04 Millions | |
| Recent Price: 297.59 Smart Investing & Trading Score: 33 | |
| Day Percent Change: -0.74% Day Change: -2.23 | |
| Week Change: -4.25% Year-to-date Change: 15.2% | |
| AXON Links: Profile News Message Board | |
| Charts:- Daily , Weekly | |
| Add AXON to Watchlist: View: Get Complete AXON Trend Analysis ➞ | |
 | SYK Stryker Corporation |
| Sector: Health Care | |
| SubSector: Medical Appliances & Equipment | |
| MarketCap: 59441.3 Millions | |
| Recent Price: 327.45 Smart Investing & Trading Score: 0 | |
| Day Percent Change: -2.55% Day Change: -8.58 | |
| Week Change: -4.27% Year-to-date Change: 9.4% | |
| SYK Links: Profile News Message Board | |
| Charts:- Daily , Weekly | |
| Add SYK to Watchlist: View: Get Complete SYK Trend Analysis ➞ | |
 | TBPH Theravance Biopharma, Inc. |
| Sector: Health Care | |
| SubSector: Biotechnology | |
| MarketCap: 1404.55 Millions | |
| Recent Price: 9.20 Smart Investing & Trading Score: 32 | |
| Day Percent Change: -3.36% Day Change: -0.32 | |
| Week Change: -4.27% Year-to-date Change: -18.2% | |
| TBPH Links: Profile News Message Board | |
| Charts:- Daily , Weekly | |
| Add TBPH to Watchlist: View: Get Complete TBPH Trend Analysis ➞ | |
 | AVAH Aveanna Healthcare Holdings Inc. |
| Sector: Health Care | |
| SubSector: Medical Care Facilities | |
| MarketCap: 305 Millions | |
| Recent Price: 2.24 Smart Investing & Trading Score: 17 | |
| Day Percent Change: 1.13% Day Change: 0.03 | |
| Week Change: -4.27% Year-to-date Change: -16.9% | |
| AVAH Links: Profile News Message Board | |
| Charts:- Daily , Weekly | |
| Add AVAH to Watchlist: View: Get Complete AVAH Trend Analysis ➞ | |
| For tabular summary view of above stock list: Summary View ➞ 0 - 25 , 25 - 50 , 50 - 75 , 75 - 100 , 100 - 125 , 125 - 150 , 150 - 175 , 175 - 200 , 200 - 225 , 225 - 250 , 250 - 275 , 275 - 300 , 300 - 325 , 325 - 350 , 350 - 375 , 375 - 400 , 400 - 425 , 425 - 450 , 450 - 475 , 475 - 500 , 500 - 525 , 525 - 550 , 550 - 575 , 575 - 600 , 600 - 625 , 625 - 650 , 650 - 675 , 675 - 700 , 700 - 725 | ||
| Click To Change The Sort Order: By Market Cap or Company Size Performance: Year-to-date, Week and Day | |
| Select Chart Type: | ||
|
Best Stocks Today 12Stocks.com |
© 2024 12Stocks.com Terms & Conditions Privacy Contact Us
All Information Provided Only For Education And Not To Be Used For Investing or Trading. See Terms & Conditions


One More Thing ... Get Best Stocks Delivered Daily!
Never Ever Miss A Move With Our Top Ten Stocks Lists
Find Best Stocks In Any Market - Bull or Bear Market
Take A Peek At Our Top Ten Stocks Lists: Daily, Weekly, Year-to-Date & Top Trends
Find Best Stocks In Any Market - Bull or Bear Market
Take A Peek At Our Top Ten Stocks Lists: Daily, Weekly, Year-to-Date & Top Trends
Healthcare Stocks With Best Up Trends [0-bearish to 100-bullish]: Zhongchao [100], Cullinan Oncology[100], Oscar Health[100], ALX Oncology[100], Zura Bio[93], PROCEPT BioRobotics[93], NuCana [93], Reneo [93], Vanda [93], Lantheus [93], Aurora Cannabis[88]
Best Healthcare Stocks Year-to-Date:
Precision BioSciences[2836.99%], Inovio [1900%], Assembly Biosciences[1525.41%], Adverum Biotechnologies[1381.14%], Aurora Cannabis[1272.32%], NuCana [1269.17%], Zhongchao [825.77%], Affimed N.V[711.2%], Corbus [504.8%], Agenus [500.31%], CareMax [417.53%] Best Healthcare Stocks This Week:
NuCana [1708.84%], Zhongchao [106.1%], Regencell Bioscience[37.01%], 23andMe Holding[33.3%], ProKidney [32%], ALX Oncology[20.64%], Vanda [20.63%], Galera [16.43%], Venus Concept[15.35%], Cullinan Oncology[13.89%], Rani [13.15%] Best Healthcare Stocks Daily:
Zhongchao [146.72%], 23andMe Holding[65.91%], Veru [22.41%], Canopy Growth[20.65%], Zura Bio[17.20%], Aurora Cannabis[12.87%], Bicycle [12.33%], Regencell Bioscience[10.20%], Vaxxinity [10.05%], DURECT [9.77%], Annovis Bio[9.57%]