
 Login Sign Up


| |||||
 |  | ||||

| 12Stocks.com Market Intelligence |
Best Healthcare Stocks
 | "Discover best trending healthcare stocks with 12Stocks.com." |
| - Subu Vdaygiri, Founder, 12Stocks.com |
| In a hurry? Healthcare Stocks Lists: Performance Trends Table, Stock Charts
Sort Healthcare stocks: Daily, Weekly, Year-to-Date, Market Cap & Trends. Filter Healthcare stocks list by size:All Healthcare Large Mid-Range Small |
| 12Stocks.com Healthcare Stocks Performances & Trends Daily | |||||||||
|
|  The overall Smart Investing & Trading Score is 52 (0-bearish to 100-bullish) which puts Healthcare sector in short term neutral trend. The Smart Investing & Trading Score from previous trading session is 38 and an improvement of trend continues.
| ||||||||
Here are the Smart Investing & Trading Scores of the most requested Healthcare stocks at 12Stocks.com (click stock name for detailed review):
|


| 12Stocks.com: Investing in Healthcare sector with Stocks | |
|
The following table helps investors and traders sort through current performance and trends (as measured by Smart Investing & Trading Score) of various
stocks in the Healthcare sector. Quick View: Move mouse or cursor over stock symbol (ticker) to view short-term Technical chart and over stock name to view long term chart. Click on  to add stock symbol to your watchlist and to add stock symbol to your watchlist and  to view watchlist. Click on any ticker or stock name for detailed market intelligence report for that stock. to view watchlist. Click on any ticker or stock name for detailed market intelligence report for that stock. |
12Stocks.com Performance of Stocks in Healthcare Sector
| Ticker | Stock Name | Watchlist | Category | Recent Price | Smart Investing & Trading Score | Change % | Weekly Change% |
| CELC | Celcuity |   | Laboratories | 16.90 | 46 | -1.97% | -1.86% |
| INZY | Inozyme Pharma | | Biotechnology | 4.40 | 17 | 0.00% | -1.90% |
| DOCS | Doximity | | Health Information | 24.15 | 0 | -1.75% | -1.95% |
| CLLS | Cellectis S.A | | Biotechnology | 2.50 | 15 | -4.58% | -1.96% |
| UBX | Unity Biotechnology | | Biotechnology | 1.47 | 10 | -1.34% | -2.00% |
| ANTX | AN2 | | Biotechnology | 2.42 | 22 | 1.68% | -2.02% |
| LGND | Ligand | | Biotechnology | 71.00 | 20 | 1.59% | -2.03% |
| NARI | Inari | | Medical Devices | 38.18 | 35 | 2.88% | -2.03% |
| CKPT | Checkpoint | | Biotechnology | 1.44 | 10 | 0.35% | -2.04% |
| CORT | Corcept | | Biotechnology | 22.48 | 36 | -2.26% | -2.05% |
| APLT | Applied | | Biotechnology | 4.31 | 36 | -3.36% | -2.05% |
| UTMD | Utah | | Instruments | 67.16 | 20 | -0.59% | -2.07% |
| FDMT | 4D Molecular | | Biotechnology | 24.73 | 36 | -0.18% | -2.08% |
| SPRY | ARS | | Biotechnology | 8.29 | 46 | -2.24% | -2.13% |
| REPL | Replimune | | Biotechnology | 6.33 | 10 | -1.40% | -2.16% |
| BTAI | BioXcel | | Biotechnology | 2.71 | 47 | -8.75% | -2.17% |
| DCGO | DocGo | | Medical Care Facilities | 3.49 | 35 | -0.43% | -2.24% |
| DERM | Dermira | | Biotechnology | 3.40 | 10 | -3.95% | -2.30% |
| SIBN | SI-BONE | | Equipment | 15.08 | 17 | -1.24% | -2.33% |
| DRTS | Alpha Tau | | Biotechnology | 2.50 | 10 | -0.20% | -2.34% |
| QURE | uniQure N.V | | Biotechnology | 4.56 | 10 | -5.69% | -2.36% |
| GALT | Galectin | | Biotechnology | 3.29 | 53 | -2.66% | -2.37% |
| BMRA | Biomerica | | Instruments | 0.71 | 0 | -1.25% | -2.37% |
| TALK | Talkspace | | Health Information | 3.06 | 36 | -2.70% | -2.39% |
| CTMX | CytomX | | Biotechnology | 1.63 | 44 | -2.98% | -2.40% |
| For chart view version of above stock list: Chart View ➞ 0 - 25 , 25 - 50 , 50 - 75 , 75 - 100 , 100 - 125 , 125 - 150 , 150 - 175 , 175 - 200 , 200 - 225 , 225 - 250 , 250 - 275 , 275 - 300 , 300 - 325 , 325 - 350 , 350 - 375 , 375 - 400 , 400 - 425 , 425 - 450 , 450 - 475 , 475 - 500 , 500 - 525 , 525 - 550 , 550 - 575 , 575 - 600 , 600 - 625 , 625 - 650 , 650 - 675 , 675 - 700 , 700 - 725 | ||
 | Click To Change The Sort Order: By Market Cap or Company Size Performance: Year-to-date, Week and Day |  |
|
Get the most comprehensive stock market coverage daily at 12Stocks.com ➞ Best Stocks Today ➞ Best Stocks Weekly ➞ Best Stocks Year-to-Date ➞ Best Stocks Trends ➞  Best Stocks Today 12Stocks.com Best Nasdaq Stocks ➞ Best S&P 500 Stocks ➞ Best Tech Stocks ➞ Best Biotech Stocks ➞ |
| Detailed Overview of Healthcare Stocks |
| Healthcare Technical Overview, Leaders & Laggards, Top Healthcare ETF Funds & Detailed Healthcare Stocks List, Charts, Trends & More |
| Healthcare Sector: Technical Analysis, Trends & YTD Performance | |
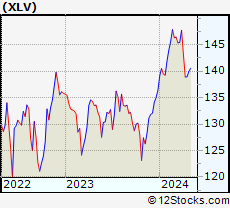
| Healthcare sector is composed of stocks
from pharmaceutical, biotech, diagnostics labs, insurance providers
and healthcare services. Healthcare sector, as represented by XLV, an exchange-traded fund [ETF] that holds basket of Healthcare stocks (e.g, Merck, Amgen) is up by 3.28% and is currently underperforming the overall market by -2.38% year-to-date. Below is a quick view of Technical charts and trends: |
|
 XLV Weekly Chart |
|
| Long Term Trend: Good | |
| Medium Term Trend: Not Good | |
 XLV Daily Chart |
|
| Short Term Trend: Very Good | |
| Overall Trend Score: 52 | |
| YTD Performance: 3.28% | |
| **Trend Scores & Views Are Only For Educational Purposes And Not For Investing | |
| 12Stocks.com: Top Performing Healthcare Sector Stocks | ||||||||||||||||||||||||||||||||||||||||||||||||
 The top performing Healthcare sector stocks year to date are
Now, more recently, over last week, the top performing Healthcare sector stocks on the move are


|
||||||||||||||||||||||||||||||||||||||||||||||||
| 12Stocks.com: Investing in Healthcare Sector using Exchange Traded Funds | |
|
The following table shows list of key exchange traded funds (ETF) that
help investors track Healthcare Index. For detailed view, check out our ETF Funds section of our website. Quick View: Move mouse or cursor over ETF symbol (ticker) to view short-term Technical chart and over ETF name to view long term chart. Click on ticker or stock name for detailed view. Click on to add stock symbol to your watchlist and to view watchlist. |
12Stocks.com List of ETFs that track Healthcare Index
| Ticker | ETF Name | Watchlist | Recent Price | Smart Investing & Trading Score | Change % | Week % | Year-to-date % |
| XLV | Health Care | | 140.86 | 52 | -0.31 | 1.37 | 3.28% |
| XBI | Biotech | | 83.94 | 25 | -0.89 | 1.34 | -5.99% |
| IBB | Biotechnology | | 127.76 | 32 | -0.20 | 2.44 | -5.96% |
| BBH | Biotech | | 157.33 | 49 | 0.03 | 3.26 | -4.83% |
| VHT | Health Care | | 257.26 | 30 | -0.22 | 1.55 | 2.62% |
| IYH | Healthcare | | 59.09 | 30 | -0.20 | 1.6 | 3.22% |
| IHF | Healthcare Providers | | 52.26 | 48 | -0.11 | 0.1 | -0.48% |
| IHI | Medical Devices | | 55.64 | 35 | 0.23 | 2.35 | 3.09% |
| BIB | Biotechnology | | 50.18 | 32 | -0.30 | 4.11 | -12.04% |
| BIS | Short Biotech | | 20.09 | 61 | 0.75 | -3.85 | 11.18% |
| XHE | Health Care Equipment | | 83.21 | 35 | 0.24 | 2.39 | -1.25% |
| CURE | Healthcare Bull 3X | | 107.85 | 32 | -0.25 | 4.37 | 6.01% |
| LABU | Biotech Bull 3X | | 89.40 | 25 | -2.80 | 3.89 | -26.7% |
| LABD | Biotech Bear 3X | | 10.37 | 62 | 2.98 | -3.98 | 7.02% |
| PSCH | SmallCap Health Care | | 41.12 | 41 | -0.23 | 2.35 | -3.92% |
| XHS | Health Care Services | | 88.70 | 53 | -0.06 | 1.85 | -0.28% |
| PTH | DWA Healthcare Momentum | | 39.63 | 46 | -1.34 | 0.25 | 1.25% |
| BTEC | Principal Healthcare Innovators | | 34.20 | 18 | -1.73 | 1.02 | -5.85% |
| RXL | Health Care | | 96.00 | 45 | -0.15 | 2.99 | 5.03% |
| RXD | Short Health Care | | 11.34 | 45 | 0.88 | -2.54 | -4.87% |
| 12Stocks.com: Charts, Trends, Fundamental Data and Performances of Healthcare Stocks | |
|
We now take in-depth look at all Healthcare stocks including charts, multi-period performances and overall trends (as measured by Smart Investing & Trading Score). One can sort Healthcare stocks (click link to choose) by Daily, Weekly and by Year-to-Date performances. Also, one can sort by size of the company or by market capitalization. |
| Select Your Default Chart Type: | |||||
| |||||
| Click on stock symbol or name for detailed view. Click on to add stock symbol to your watchlist and to view watchlist. Quick View: Move mouse or cursor over "Daily" to quickly view daily Technical stock chart and over "Weekly" to view weekly Technical stock chart. | |||||

 | CELC Celcuity Inc. |
| Sector: Health Care | |
| SubSector: Medical Laboratories & Research | |
| MarketCap: 70.53 Millions | |
| Recent Price: 16.90 Smart Investing & Trading Score: 46 | |
| Day Percent Change: -1.97% Day Change: -0.34 | |
| Week Change: -1.86% Year-to-date Change: 15.3% | |
| CELC Links: Profile News Message Board | |
| Charts:- Daily , Weekly | |
| Add CELC to Watchlist: View: Get Complete CELC Trend Analysis ➞ | |
 | INZY Inozyme Pharma, Inc. |
| Sector: Health Care | |
| SubSector: Biotechnology | |
| MarketCap: 53487 Millions | |
| Recent Price: 4.40 Smart Investing & Trading Score: 17 | |
| Day Percent Change: 0.00% Day Change: 0.00 | |
| Week Change: -1.9% Year-to-date Change: 3.4% | |
| INZY Links: Profile News Message Board | |
| Charts:- Daily , Weekly | |
| Add INZY to Watchlist: View: Get Complete INZY Trend Analysis ➞ | |
 | DOCS Doximity, Inc. |
| Sector: Health Care | |
| SubSector: Health Information Services | |
| MarketCap: 6540 Millions | |
| Recent Price: 24.15 Smart Investing & Trading Score: 0 | |
| Day Percent Change: -1.75% Day Change: -0.43 | |
| Week Change: -1.95% Year-to-date Change: -15.1% | |
| DOCS Links: Profile News Message Board | |
| Charts:- Daily , Weekly | |
| Add DOCS to Watchlist: View: Get Complete DOCS Trend Analysis ➞ | |
 | CLLS Cellectis S.A. |
| Sector: Health Care | |
| SubSector: Biotechnology | |
| MarketCap: 398.685 Millions | |
| Recent Price: 2.50 Smart Investing & Trading Score: 15 | |
| Day Percent Change: -4.58% Day Change: -0.12 | |
| Week Change: -1.96% Year-to-date Change: -18.8% | |
| CLLS Links: Profile News Message Board | |
| Charts:- Daily , Weekly | |
| Add CLLS to Watchlist: View: Get Complete CLLS Trend Analysis ➞ | |
 | UBX Unity Biotechnology, Inc. |
| Sector: Health Care | |
| SubSector: Biotechnology | |
| MarketCap: 254.985 Millions | |
| Recent Price: 1.47 Smart Investing & Trading Score: 10 | |
| Day Percent Change: -1.34% Day Change: -0.02 | |
| Week Change: -2% Year-to-date Change: -23.8% | |
| UBX Links: Profile News Message Board | |
| Charts:- Daily , Weekly | |
| Add UBX to Watchlist: View: Get Complete UBX Trend Analysis ➞ | |
 | ANTX AN2 Therapeutics, Inc. |
| Sector: Health Care | |
| SubSector: Biotechnology | |
| MarketCap: 163 Millions | |
| Recent Price: 2.42 Smart Investing & Trading Score: 22 | |
| Day Percent Change: 1.68% Day Change: 0.04 | |
| Week Change: -2.02% Year-to-date Change: -88.2% | |
| ANTX Links: Profile News Message Board | |
| Charts:- Daily , Weekly | |
| Add ANTX to Watchlist: View: Get Complete ANTX Trend Analysis ➞ | |
 | LGND Ligand Pharmaceuticals Incorporated |
| Sector: Health Care | |
| SubSector: Biotechnology | |
| MarketCap: 1344.45 Millions | |
| Recent Price: 71.00 Smart Investing & Trading Score: 20 | |
| Day Percent Change: 1.59% Day Change: 1.11 | |
| Week Change: -2.03% Year-to-date Change: -0.6% | |
| LGND Links: Profile News Message Board | |
| Charts:- Daily , Weekly | |
| Add LGND to Watchlist: View: Get Complete LGND Trend Analysis ➞ | |
 | NARI Inari Medical, Inc. |
| Sector: Health Care | |
| SubSector: Medical Devices | |
| MarketCap: 33287 Millions | |
| Recent Price: 38.18 Smart Investing & Trading Score: 35 | |
| Day Percent Change: 2.88% Day Change: 1.07 | |
| Week Change: -2.03% Year-to-date Change: -41.2% | |
| NARI Links: Profile News Message Board | |
| Charts:- Daily , Weekly | |
| Add NARI to Watchlist: View: Get Complete NARI Trend Analysis ➞ | |
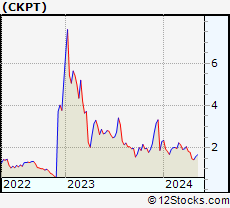 | CKPT Checkpoint Therapeutics, Inc. |
| Sector: Health Care | |
| SubSector: Biotechnology | |
| MarketCap: 78.4785 Millions | |
| Recent Price: 1.44 Smart Investing & Trading Score: 10 | |
| Day Percent Change: 0.35% Day Change: 0.00 | |
| Week Change: -2.04% Year-to-date Change: -37.1% | |
| CKPT Links: Profile News Message Board | |
| Charts:- Daily , Weekly | |
| Add CKPT to Watchlist: View: Get Complete CKPT Trend Analysis ➞ | |
 | CORT Corcept Therapeutics Incorporated |
| Sector: Health Care | |
| SubSector: Biotechnology | |
| MarketCap: 1228.45 Millions | |
| Recent Price: 22.48 Smart Investing & Trading Score: 36 | |
| Day Percent Change: -2.26% Day Change: -0.52 | |
| Week Change: -2.05% Year-to-date Change: -30.8% | |
| CORT Links: Profile News Message Board | |
| Charts:- Daily , Weekly | |
| Add CORT to Watchlist: View: Get Complete CORT Trend Analysis ➞ | |
 | APLT Applied Therapeutics, Inc. |
| Sector: Health Care | |
| SubSector: Biotechnology | |
| MarketCap: 641.285 Millions | |
| Recent Price: 4.31 Smart Investing & Trading Score: 36 | |
| Day Percent Change: -3.36% Day Change: -0.15 | |
| Week Change: -2.05% Year-to-date Change: 28.7% | |
| APLT Links: Profile News Message Board | |
| Charts:- Daily , Weekly | |
| Add APLT to Watchlist: View: Get Complete APLT Trend Analysis ➞ | |
 | UTMD Utah Medical Products, Inc. |
| Sector: Health Care | |
| SubSector: Medical Instruments & Supplies | |
| MarketCap: 285.86 Millions | |
| Recent Price: 67.16 Smart Investing & Trading Score: 20 | |
| Day Percent Change: -0.59% Day Change: -0.40 | |
| Week Change: -2.07% Year-to-date Change: -20.3% | |
| UTMD Links: Profile News Message Board | |
| Charts:- Daily , Weekly | |
| Add UTMD to Watchlist: View: Get Complete UTMD Trend Analysis ➞ | |
 | FDMT 4D Molecular Therapeutics, Inc. |
| Sector: Health Care | |
| SubSector: Biotechnology | |
| MarketCap: 772 Millions | |
| Recent Price: 24.73 Smart Investing & Trading Score: 36 | |
| Day Percent Change: -0.18% Day Change: -0.04 | |
| Week Change: -2.08% Year-to-date Change: 19.4% | |
| FDMT Links: Profile News Message Board | |
| Charts:- Daily , Weekly | |
| Add FDMT to Watchlist: View: Get Complete FDMT Trend Analysis ➞ | |
 | SPRY ARS Pharmaceuticals, Inc. |
| Sector: Health Care | |
| SubSector: Biotechnology | |
| MarketCap: 632 Millions | |
| Recent Price: 8.29 Smart Investing & Trading Score: 46 | |
| Day Percent Change: -2.24% Day Change: -0.19 | |
| Week Change: -2.13% Year-to-date Change: 45.8% | |
| SPRY Links: Profile News Message Board | |
| Charts:- Daily , Weekly | |
| Add SPRY to Watchlist: View: Get Complete SPRY Trend Analysis ➞ | |
 | REPL Replimune Group, Inc. |
| Sector: Health Care | |
| SubSector: Biotechnology | |
| MarketCap: 367.885 Millions | |
| Recent Price: 6.33 Smart Investing & Trading Score: 10 | |
| Day Percent Change: -1.40% Day Change: -0.09 | |
| Week Change: -2.16% Year-to-date Change: -24.9% | |
| REPL Links: Profile News Message Board | |
| Charts:- Daily , Weekly | |
| Add REPL to Watchlist: View: Get Complete REPL Trend Analysis ➞ | |
 | BTAI BioXcel Therapeutics, Inc. |
| Sector: Health Care | |
| SubSector: Biotechnology | |
| MarketCap: 487.485 Millions | |
| Recent Price: 2.71 Smart Investing & Trading Score: 47 | |
| Day Percent Change: -8.75% Day Change: -0.26 | |
| Week Change: -2.17% Year-to-date Change: -8.1% | |
| BTAI Links: Profile News Message Board | |
| Charts:- Daily , Weekly | |
| Add BTAI to Watchlist: View: Get Complete BTAI Trend Analysis ➞ | |
 | DCGO DocGo Inc. |
| Sector: Health Care | |
| SubSector: Medical Care Facilities | |
| MarketCap: 972 Millions | |
| Recent Price: 3.49 Smart Investing & Trading Score: 35 | |
| Day Percent Change: -0.43% Day Change: -0.01 | |
| Week Change: -2.24% Year-to-date Change: -37.6% | |
| DCGO Links: Profile News Message Board | |
| Charts:- Daily , Weekly | |
| Add DCGO to Watchlist: View: Get Complete DCGO Trend Analysis ➞ | |
 | DERM Dermira, Inc. |
| Sector: Health Care | |
| SubSector: Biotechnology | |
| MarketCap: 1312.25 Millions | |
| Recent Price: 3.40 Smart Investing & Trading Score: 10 | |
| Day Percent Change: -3.95% Day Change: -0.14 | |
| Week Change: -2.3% Year-to-date Change: -41.0% | |
| DERM Links: Profile News Message Board | |
| Charts:- Daily , Weekly | |
| Add DERM to Watchlist: View: Get Complete DERM Trend Analysis ➞ | |
 | SIBN SI-BONE, Inc. |
| Sector: Health Care | |
| SubSector: Medical Appliances & Equipment | |
| MarketCap: 234.78 Millions | |
| Recent Price: 15.08 Smart Investing & Trading Score: 17 | |
| Day Percent Change: -1.24% Day Change: -0.19 | |
| Week Change: -2.33% Year-to-date Change: -28.2% | |
| SIBN Links: Profile News Message Board | |
| Charts:- Daily , Weekly | |
| Add SIBN to Watchlist: View: Get Complete SIBN Trend Analysis ➞ | |
 | DRTS Alpha Tau Medical Ltd. |
| Sector: Health Care | |
| SubSector: Biotechnology | |
| MarketCap: 300 Millions | |
| Recent Price: 2.50 Smart Investing & Trading Score: 10 | |
| Day Percent Change: -0.20% Day Change: 0.00 | |
| Week Change: -2.34% Year-to-date Change: -16.4% | |
| DRTS Links: Profile News Message Board | |
| Charts:- Daily , Weekly | |
| Add DRTS to Watchlist: View: Get Complete DRTS Trend Analysis ➞ | |
 | QURE uniQure N.V. |
| Sector: Health Care | |
| SubSector: Biotechnology | |
| MarketCap: 2267.25 Millions | |
| Recent Price: 4.56 Smart Investing & Trading Score: 10 | |
| Day Percent Change: -5.69% Day Change: -0.28 | |
| Week Change: -2.36% Year-to-date Change: -32.6% | |
| QURE Links: Profile News Message Board | |
| Charts:- Daily , Weekly | |
| Add QURE to Watchlist: View: Get Complete QURE Trend Analysis ➞ | |
 | GALT Galectin Therapeutics, Inc. |
| Sector: Health Care | |
| SubSector: Biotechnology | |
| MarketCap: 114.185 Millions | |
| Recent Price: 3.29 Smart Investing & Trading Score: 53 | |
| Day Percent Change: -2.66% Day Change: -0.09 | |
| Week Change: -2.37% Year-to-date Change: 98.2% | |
| GALT Links: Profile News Message Board | |
| Charts:- Daily , Weekly | |
| Add GALT to Watchlist: View: Get Complete GALT Trend Analysis ➞ | |
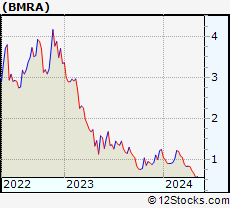 | BMRA Biomerica, Inc. |
| Sector: Health Care | |
| SubSector: Medical Instruments & Supplies | |
| MarketCap: 80.286 Millions | |
| Recent Price: 0.71 Smart Investing & Trading Score: 0 | |
| Day Percent Change: -1.25% Day Change: -0.01 | |
| Week Change: -2.37% Year-to-date Change: -43.0% | |
| BMRA Links: Profile News Message Board | |
| Charts:- Daily , Weekly | |
| Add BMRA to Watchlist: View: Get Complete BMRA Trend Analysis ➞ | |
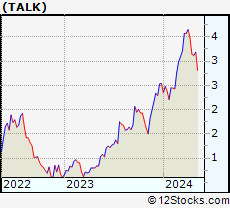 | TALK Talkspace, Inc. |
| Sector: Health Care | |
| SubSector: Health Information Services | |
| MarketCap: 209 Millions | |
| Recent Price: 3.06 Smart Investing & Trading Score: 36 | |
| Day Percent Change: -2.70% Day Change: -0.08 | |
| Week Change: -2.39% Year-to-date Change: 20.7% | |
| TALK Links: Profile News Message Board | |
| Charts:- Daily , Weekly | |
| Add TALK to Watchlist: View: Get Complete TALK Trend Analysis ➞ | |
 | CTMX CytomX Therapeutics, Inc. |
| Sector: Health Care | |
| SubSector: Biotechnology | |
| MarketCap: 264.885 Millions | |
| Recent Price: 1.63 Smart Investing & Trading Score: 44 | |
| Day Percent Change: -2.98% Day Change: -0.05 | |
| Week Change: -2.4% Year-to-date Change: 5.2% | |
| CTMX Links: Profile News Message Board | |
| Charts:- Daily , Weekly | |
| Add CTMX to Watchlist: View: Get Complete CTMX Trend Analysis ➞ | |
| For tabular summary view of above stock list: Summary View ➞ 0 - 25 , 25 - 50 , 50 - 75 , 75 - 100 , 100 - 125 , 125 - 150 , 150 - 175 , 175 - 200 , 200 - 225 , 225 - 250 , 250 - 275 , 275 - 300 , 300 - 325 , 325 - 350 , 350 - 375 , 375 - 400 , 400 - 425 , 425 - 450 , 450 - 475 , 475 - 500 , 500 - 525 , 525 - 550 , 550 - 575 , 575 - 600 , 600 - 625 , 625 - 650 , 650 - 675 , 675 - 700 , 700 - 725 | ||
| Click To Change The Sort Order: By Market Cap or Company Size Performance: Year-to-date, Week and Day | |
| Select Chart Type: | ||
|
Best Stocks Today 12Stocks.com |
© 2024 12Stocks.com Terms & Conditions Privacy Contact Us
All Information Provided Only For Education And Not To Be Used For Investing or Trading. See Terms & Conditions


One More Thing ... Get Best Stocks Delivered Daily!
Never Ever Miss A Move With Our Top Ten Stocks Lists
Find Best Stocks In Any Market - Bull or Bear Market
Take A Peek At Our Top Ten Stocks Lists: Daily, Weekly, Year-to-Date & Top Trends
Find Best Stocks In Any Market - Bull or Bear Market
Take A Peek At Our Top Ten Stocks Lists: Daily, Weekly, Year-to-Date & Top Trends
Healthcare Stocks With Best Up Trends [0-bearish to 100-bullish]: Annovis Bio[100], Boston Scientific[100], Integer [100], Quest Diagnostics[100], AstraZeneca [100], Oscar Health[100], PureTech Health[100], Glaukos [100], Agios [100], Pieris [100], Avadel [100]
Best Healthcare Stocks Year-to-Date:
Pieris [6427.47%], Precision BioSciences[2590.41%], Inovio [1892.16%], Assembly Biosciences[1543.7%], Aurora Cannabis[1411.97%], Adverum Biotechnologies[1253.61%], NuCana [1198.17%], Agenus [796.24%], Affimed N.V[680.8%], CareMax [574.23%], Corbus [488.41%] Best Healthcare Stocks This Week:
Pieris [8093.1%], Aesthetic [53.58%], Agenus [39.74%], BeyondSpring [35%], Seres [30.29%], VolitionRx [29.87%], Annovis Bio[27.4%], CareMax [27.24%], ProKidney [23.28%], GeneDx [22.61%], Cullinan Oncology[20.69%] Best Healthcare Stocks Daily:
Aesthetic [44.75%], Agenus [14.86%], Apyx [13.64%], Cullinan Oncology[13.55%], Amneal [12.04%], HOOKIPA Pharma[11.11%], Gritstone Oncology[10.06%], DURECT [9.75%], Sage [8.11%], Relay [7.46%], Annovis Bio[7.24%]