
 Login Sign Up


| |||||
 |  | ||||

| 12Stocks.com Market Intelligence |
Best Healthcare Stocks
 | "Discover best trending healthcare stocks with 12Stocks.com." |
| - Subu Vdaygiri, Founder, 12Stocks.com |
| In a hurry? Healthcare Stocks Lists: Performance Trends Table, Stock Charts
Sort Healthcare stocks: Daily, Weekly, Year-to-Date, Market Cap & Trends. Filter Healthcare stocks list by size:All Healthcare Large Mid-Range Small |
| 12Stocks.com Healthcare Stocks Performances & Trends Daily | |||||||||
|
|  The overall Smart Investing & Trading Score is 25 (0-bearish to 100-bullish) which puts Healthcare sector in short term bearish to neutral trend. The Smart Investing & Trading Score from previous trading session is 18 and hence an improvement of trend.
| ||||||||
Here are the Smart Investing & Trading Scores of the most requested Healthcare stocks at 12Stocks.com (click stock name for detailed review):
|


| 12Stocks.com: Investing in Healthcare sector with Stocks | |
|
The following table helps investors and traders sort through current performance and trends (as measured by Smart Investing & Trading Score) of various
stocks in the Healthcare sector. Quick View: Move mouse or cursor over stock symbol (ticker) to view short-term Technical chart and over stock name to view long term chart. Click on  to add stock symbol to your watchlist and to add stock symbol to your watchlist and  to view watchlist. Click on any ticker or stock name for detailed market intelligence report for that stock. to view watchlist. Click on any ticker or stock name for detailed market intelligence report for that stock. |
12Stocks.com Performance of Stocks in Healthcare Sector
| Ticker | Stock Name | Watchlist | Category | Recent Price | Smart Investing & Trading Score | Change % | Weekly Change% |
| CODX | Co-Diagnostics |   | Laboratories | 1.16 | 37 | 0.00% | -3.33% |
| PRTC | PureTech Health | | Biotechnology | 26.15 | 56 | -2.91% | -3.33% |
| LLY | Eli Lilly | | Pharmaceutical | 726.31 | 26 | -2.63% | -3.37% |
| TRVI | Trevi | | Biotechnology | 2.82 | 68 | 5.22% | -3.42% |
| FLGT | Fulgent Genetics | | Laboratories | 20.34 | 37 | 1.09% | -3.46% |
| USPH | U.S. Physical | | Specialized | 99.09 | 56 | 1.64% | -3.52% |
| MRNA | Moderna | | Biotechnology | 101.44 | 23 | -0.55% | -3.52% |
| SEM | Select | | Hospitals | 27.06 | 53 | 2.38% | -3.56% |
| XXII | 22nd Century | | Biotechnology | 1.62 | 51 | -5.26% | -3.57% |
| CRNX | Crinetics | | Biotechnology | 42.98 | 41 | -0.07% | -3.61% |
| TMO | Thermo Fisher | | Laboratories | 544.78 | 53 | 0.60% | -3.62% |
| PAVM | PAVmed | | Equipment | 1.86 | 8 | -4.62% | -3.63% |
| TFX | Teleflex | | Instruments | 206.56 | 0 | -0.40% | -3.67% |
| VMD | Viemed | | Equipment | 7.88 | 10 | 1.03% | -3.67% |
| ATRC | AtriCure | | Instruments | 23.20 | 18 | -0.81% | -3.69% |
| RMD | ResMed | | Instruments | 178.85 | 20 | 0.70% | -3.77% |
| IMVT | Immunovant | | Biotechnology | 28.24 | 10 | -0.28% | -3.78% |
| VCYT | Veracyte | | Biotechnology | 19.45 | 42 | 1.30% | -3.86% |
| GLPG | Galapagos NV | | Biotechnology | 29.08 | 10 | 0.59% | -3.87% |
| BLFS | BioLife | | Instruments | 15.86 | 35 | 0.00% | -3.88% |
| BMRN | BioMarin | | Biotechnology | 88.63 | 55 | -1.60% | -3.89% |
| CSTL | Castle Biosciences | | Laboratories | 19.28 | 25 | 0.42% | -3.89% |
| MLTX | MoonLake Immuno | | Biotechnology | 42.19 | 0 | -2.77% | -3.92% |
| CRBP | Corbus | | Biotechnology | 39.24 | 60 | 7.42% | -3.94% |
| DH | Definitive | | Health Information | 7.06 | 5 | -2.89% | -3.95% |
| For chart view version of above stock list: Chart View ➞ 0 - 25 , 25 - 50 , 50 - 75 , 75 - 100 , 100 - 125 , 125 - 150 , 150 - 175 , 175 - 200 , 200 - 225 , 225 - 250 , 250 - 275 , 275 - 300 , 300 - 325 , 325 - 350 , 350 - 375 , 375 - 400 , 400 - 425 , 425 - 450 , 450 - 475 , 475 - 500 , 500 - 525 , 525 - 550 , 550 - 575 , 575 - 600 , 600 - 625 , 625 - 650 , 650 - 675 , 675 - 700 , 700 - 725 | ||
 | Click To Change The Sort Order: By Market Cap or Company Size Performance: Year-to-date, Week and Day |  |
|
Get the most comprehensive stock market coverage daily at 12Stocks.com ➞ Best Stocks Today ➞ Best Stocks Weekly ➞ Best Stocks Year-to-Date ➞ Best Stocks Trends ➞  Best Stocks Today 12Stocks.com Best Nasdaq Stocks ➞ Best S&P 500 Stocks ➞ Best Tech Stocks ➞ Best Biotech Stocks ➞ |
| Detailed Overview of Healthcare Stocks |
| Healthcare Technical Overview, Leaders & Laggards, Top Healthcare ETF Funds & Detailed Healthcare Stocks List, Charts, Trends & More |
| Healthcare Sector: Technical Analysis, Trends & YTD Performance | |
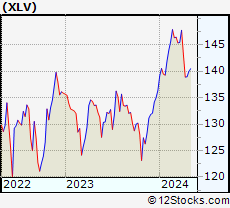
| Healthcare sector is composed of stocks
from pharmaceutical, biotech, diagnostics labs, insurance providers
and healthcare services. Healthcare sector, as represented by XLV, an exchange-traded fund [ETF] that holds basket of Healthcare stocks (e.g, Merck, Amgen) is up by 1.88% and is currently underperforming the overall market by -1.5% year-to-date. Below is a quick view of Technical charts and trends: |
|
 XLV Weekly Chart |
|
| Long Term Trend: Not Good | |
| Medium Term Trend: Not Good | |
 XLV Daily Chart |
|
| Short Term Trend: Very Good | |
| Overall Trend Score: 25 | |
| YTD Performance: 1.88% | |
| **Trend Scores & Views Are Only For Educational Purposes And Not For Investing | |
| 12Stocks.com: Top Performing Healthcare Sector Stocks | ||||||||||||||||||||||||||||||||||||||||||||||||
 The top performing Healthcare sector stocks year to date are
Now, more recently, over last week, the top performing Healthcare sector stocks on the move are


|
||||||||||||||||||||||||||||||||||||||||||||||||
| 12Stocks.com: Investing in Healthcare Sector using Exchange Traded Funds | |
|
The following table shows list of key exchange traded funds (ETF) that
help investors track Healthcare Index. For detailed view, check out our ETF Funds section of our website. Quick View: Move mouse or cursor over ETF symbol (ticker) to view short-term Technical chart and over ETF name to view long term chart. Click on ticker or stock name for detailed view. Click on to add stock symbol to your watchlist and to view watchlist. |
12Stocks.com List of ETFs that track Healthcare Index
| Ticker | ETF Name | Watchlist | Recent Price | Smart Investing & Trading Score | Change % | Week % | Year-to-date % |
| XLV | Health Care | | 138.95 | 25 | 0.38 | 0.03 | 1.88% |
| XBI | Biotech | | 82.83 | 10 | -0.78 | -6.04 | -7.23% |
| IBB | Biotechnology | | 124.72 | 10 | 0.06 | -3.75 | -8.19% |
| BBH | Biotech | | 152.36 | 10 | 0.01 | -3.32 | -7.83% |
| VHT | Health Care | | 253.33 | 18 | 0.20 | -0.57 | 1.05% |
| IYH | Healthcare | | 58.16 | 18 | 0.19 | -0.41 | 1.59% |
| IHF | Healthcare Providers | | 52.21 | 62 | 1.29 | 3.3 | -0.57% |
| IHI | Medical Devices | | 54.36 | 10 | -0.31 | -3.1 | 0.72% |
| BIB | Biotechnology | | 48.20 | 10 | 0.54 | -6.21 | -15.51% |
| BIS | Short Biotech | | 20.90 | 95 | 0.14 | 6.61 | 15.63% |
| XHE | Health Care Equipment | | 81.27 | 10 | -0.20 | -3.13 | -3.55% |
| CURE | Healthcare Bull 3X | | 103.33 | 25 | 1.09 | -0.06 | 1.56% |
| LABU | Biotech Bull 3X | | 86.05 | 10 | -2.26 | -17.54 | -29.45% |
| LABD | Biotech Bear 3X | | 10.80 | 100 | 2.66 | 20.27 | 11.46% |
| PSCH | SmallCap Health Care | | 40.18 | 20 | 0.25 | -3.02 | -6.12% |
| XHS | Health Care Services | | 87.08 | 38 | 1.04 | -1.05 | -2.1% |
| PTH | DWA Healthcare Momentum | | 39.53 | 23 | -0.10 | -5.5 | 1% |
| BTEC | Principal Healthcare Innovators | | 33.86 | 0 | -0.67 | -5.92 | -6.8% |
| RXL | Health Care | | 93.22 | 25 | 0.85 | -0.03 | 1.99% |
| RXD | Short Health Care | | 11.64 | 76 | -0.29 | 0.34 | -2.39% |
| 12Stocks.com: Charts, Trends, Fundamental Data and Performances of Healthcare Stocks | |
|
We now take in-depth look at all Healthcare stocks including charts, multi-period performances and overall trends (as measured by Smart Investing & Trading Score). One can sort Healthcare stocks (click link to choose) by Daily, Weekly and by Year-to-Date performances. Also, one can sort by size of the company or by market capitalization. |
| Select Your Default Chart Type: | |||||
| |||||
| Click on stock symbol or name for detailed view. Click on to add stock symbol to your watchlist and to view watchlist. Quick View: Move mouse or cursor over "Daily" to quickly view daily Technical stock chart and over "Weekly" to view weekly Technical stock chart. | |||||

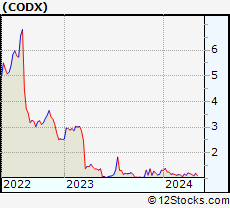 | CODX Co-Diagnostics, Inc. |
| Sector: Health Care | |
| SubSector: Medical Laboratories & Research | |
| MarketCap: 297.5 Millions | |
| Recent Price: 1.16 Smart Investing & Trading Score: 37 | |
| Day Percent Change: 0.00% Day Change: 0.00 | |
| Week Change: -3.33% Year-to-date Change: -12.8% | |
| CODX Links: Profile News Message Board | |
| Charts:- Daily , Weekly | |
| Add CODX to Watchlist: View: Get Complete CODX Trend Analysis ➞ | |
 | PRTC PureTech Health plc |
| Sector: Health Care | |
| SubSector: Biotechnology | |
| MarketCap: 819 Millions | |
| Recent Price: 26.15 Smart Investing & Trading Score: 56 | |
| Day Percent Change: -2.91% Day Change: -0.79 | |
| Week Change: -3.33% Year-to-date Change: 9.4% | |
| PRTC Links: Profile News Message Board | |
| Charts:- Daily , Weekly | |
| Add PRTC to Watchlist: View: Get Complete PRTC Trend Analysis ➞ | |
 | LLY Eli Lilly and Company |
| Sector: Health Care | |
| SubSector: Drug Manufacturers - Major | |
| MarketCap: 130066 Millions | |
| Recent Price: 726.31 Smart Investing & Trading Score: 26 | |
| Day Percent Change: -2.63% Day Change: -19.64 | |
| Week Change: -3.37% Year-to-date Change: 24.6% | |
| LLY Links: Profile News Message Board | |
| Charts:- Daily , Weekly | |
| Add LLY to Watchlist: View: Get Complete LLY Trend Analysis ➞ | |
 | TRVI Trevi Therapeutics, Inc. |
| Sector: Health Care | |
| SubSector: Biotechnology | |
| MarketCap: 50.6785 Millions | |
| Recent Price: 2.82 Smart Investing & Trading Score: 68 | |
| Day Percent Change: 5.22% Day Change: 0.14 | |
| Week Change: -3.42% Year-to-date Change: 110.5% | |
| TRVI Links: Profile News Message Board | |
| Charts:- Daily , Weekly | |
| Add TRVI to Watchlist: View: Get Complete TRVI Trend Analysis ➞ | |
 | FLGT Fulgent Genetics, Inc. |
| Sector: Health Care | |
| SubSector: Medical Laboratories & Research | |
| MarketCap: 222.2 Millions | |
| Recent Price: 20.34 Smart Investing & Trading Score: 37 | |
| Day Percent Change: 1.09% Day Change: 0.22 | |
| Week Change: -3.46% Year-to-date Change: -29.6% | |
| FLGT Links: Profile News Message Board | |
| Charts:- Daily , Weekly | |
| Add FLGT to Watchlist: View: Get Complete FLGT Trend Analysis ➞ | |
 | USPH U.S. Physical Therapy, Inc. |
| Sector: Health Care | |
| SubSector: Specialized Health Services | |
| MarketCap: 793.556 Millions | |
| Recent Price: 99.09 Smart Investing & Trading Score: 56 | |
| Day Percent Change: 1.64% Day Change: 1.60 | |
| Week Change: -3.52% Year-to-date Change: 6.4% | |
| USPH Links: Profile News Message Board | |
| Charts:- Daily , Weekly | |
| Add USPH to Watchlist: View: Get Complete USPH Trend Analysis ➞ | |
 | MRNA Moderna, Inc. |
| Sector: Health Care | |
| SubSector: Biotechnology | |
| MarketCap: 11006.4 Millions | |
| Recent Price: 101.44 Smart Investing & Trading Score: 23 | |
| Day Percent Change: -0.55% Day Change: -0.56 | |
| Week Change: -3.52% Year-to-date Change: 2.0% | |
| MRNA Links: Profile News Message Board | |
| Charts:- Daily , Weekly | |
| Add MRNA to Watchlist: View: Get Complete MRNA Trend Analysis ➞ | |
 | SEM Select Medical Holdings Corporation |
| Sector: Health Care | |
| SubSector: Hospitals | |
| MarketCap: 1765.96 Millions | |
| Recent Price: 27.06 Smart Investing & Trading Score: 53 | |
| Day Percent Change: 2.38% Day Change: 0.63 | |
| Week Change: -3.56% Year-to-date Change: 15.2% | |
| SEM Links: Profile News Message Board | |
| Charts:- Daily , Weekly | |
| Add SEM to Watchlist: View: Get Complete SEM Trend Analysis ➞ | |
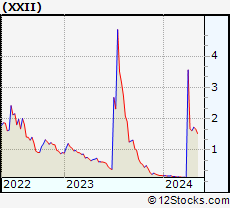 | XXII 22nd Century Group, Inc. |
| Sector: Health Care | |
| SubSector: Biotechnology | |
| MarketCap: 94.7785 Millions | |
| Recent Price: 1.62 Smart Investing & Trading Score: 51 | |
| Day Percent Change: -5.26% Day Change: -0.09 | |
| Week Change: -3.57% Year-to-date Change: 770.0% | |
| XXII Links: Profile News Message Board | |
| Charts:- Daily , Weekly | |
| Add XXII to Watchlist: View: Get Complete XXII Trend Analysis ➞ | |
 | CRNX Crinetics Pharmaceuticals, Inc. |
| Sector: Health Care | |
| SubSector: Biotechnology | |
| MarketCap: 381.085 Millions | |
| Recent Price: 42.98 Smart Investing & Trading Score: 41 | |
| Day Percent Change: -0.07% Day Change: -0.03 | |
| Week Change: -3.61% Year-to-date Change: 20.8% | |
| CRNX Links: Profile News Message Board | |
| Charts:- Daily , Weekly | |
| Add CRNX to Watchlist: View: Get Complete CRNX Trend Analysis ➞ | |
 | TMO Thermo Fisher Scientific Inc. |
| Sector: Health Care | |
| SubSector: Medical Laboratories & Research | |
| MarketCap: 112999 Millions | |
| Recent Price: 544.78 Smart Investing & Trading Score: 53 | |
| Day Percent Change: 0.60% Day Change: 3.26 | |
| Week Change: -3.62% Year-to-date Change: 2.6% | |
| TMO Links: Profile News Message Board | |
| Charts:- Daily , Weekly | |
| Add TMO to Watchlist: View: Get Complete TMO Trend Analysis ➞ | |
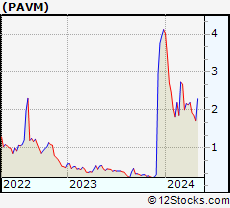 | PAVM PAVmed Inc. |
| Sector: Health Care | |
| SubSector: Medical Appliances & Equipment | |
| MarketCap: 65.408 Millions | |
| Recent Price: 1.86 Smart Investing & Trading Score: 8 | |
| Day Percent Change: -4.62% Day Change: -0.09 | |
| Week Change: -3.63% Year-to-date Change: -54.9% | |
| PAVM Links: Profile News Message Board | |
| Charts:- Daily , Weekly | |
| Add PAVM to Watchlist: View: Get Complete PAVM Trend Analysis ➞ | |
 | TFX Teleflex Incorporated |
| Sector: Health Care | |
| SubSector: Medical Instruments & Supplies | |
| MarketCap: 12989.3 Millions | |
| Recent Price: 206.56 Smart Investing & Trading Score: 0 | |
| Day Percent Change: -0.40% Day Change: -0.82 | |
| Week Change: -3.67% Year-to-date Change: -17.2% | |
| TFX Links: Profile News Message Board | |
| Charts:- Daily , Weekly | |
| Add TFX to Watchlist: View: Get Complete TFX Trend Analysis ➞ | |
 | VMD Viemed Healthcare, Inc. |
| Sector: Health Care | |
| SubSector: Medical Appliances & Equipment | |
| MarketCap: 177.28 Millions | |
| Recent Price: 7.88 Smart Investing & Trading Score: 10 | |
| Day Percent Change: 1.03% Day Change: 0.08 | |
| Week Change: -3.67% Year-to-date Change: 0.4% | |
| VMD Links: Profile News Message Board | |
| Charts:- Daily , Weekly | |
| Add VMD to Watchlist: View: Get Complete VMD Trend Analysis ➞ | |
 | ATRC AtriCure, Inc. |
| Sector: Health Care | |
| SubSector: Medical Instruments & Supplies | |
| MarketCap: 1158.7 Millions | |
| Recent Price: 23.20 Smart Investing & Trading Score: 18 | |
| Day Percent Change: -0.81% Day Change: -0.19 | |
| Week Change: -3.69% Year-to-date Change: -35.0% | |
| ATRC Links: Profile News Message Board | |
| Charts:- Daily , Weekly | |
| Add ATRC to Watchlist: View: Get Complete ATRC Trend Analysis ➞ | |
 | RMD ResMed Inc. |
| Sector: Health Care | |
| SubSector: Medical Instruments & Supplies | |
| MarketCap: 18660.2 Millions | |
| Recent Price: 178.85 Smart Investing & Trading Score: 20 | |
| Day Percent Change: 0.70% Day Change: 1.24 | |
| Week Change: -3.77% Year-to-date Change: 4.0% | |
| RMD Links: Profile News Message Board | |
| Charts:- Daily , Weekly | |
| Add RMD to Watchlist: View: Get Complete RMD Trend Analysis ➞ | |
 | IMVT Immunovant, Inc. |
| Sector: Health Care | |
| SubSector: Biotechnology | |
| MarketCap: 552.885 Millions | |
| Recent Price: 28.24 Smart Investing & Trading Score: 10 | |
| Day Percent Change: -0.28% Day Change: -0.08 | |
| Week Change: -3.78% Year-to-date Change: -33.0% | |
| IMVT Links: Profile News Message Board | |
| Charts:- Daily , Weekly | |
| Add IMVT to Watchlist: View: Get Complete IMVT Trend Analysis ➞ | |
 | VCYT Veracyte, Inc. |
| Sector: Health Care | |
| SubSector: Biotechnology | |
| MarketCap: 1089.05 Millions | |
| Recent Price: 19.45 Smart Investing & Trading Score: 42 | |
| Day Percent Change: 1.30% Day Change: 0.25 | |
| Week Change: -3.86% Year-to-date Change: -29.3% | |
| VCYT Links: Profile News Message Board | |
| Charts:- Daily , Weekly | |
| Add VCYT to Watchlist: View: Get Complete VCYT Trend Analysis ➞ | |
 | GLPG Galapagos NV |
| Sector: Health Care | |
| SubSector: Biotechnology | |
| MarketCap: 9541.55 Millions | |
| Recent Price: 29.08 Smart Investing & Trading Score: 10 | |
| Day Percent Change: 0.59% Day Change: 0.17 | |
| Week Change: -3.87% Year-to-date Change: -28.5% | |
| GLPG Links: Profile News Message Board | |
| Charts:- Daily , Weekly | |
| Add GLPG to Watchlist: View: Get Complete GLPG Trend Analysis ➞ | |
 | BLFS BioLife Solutions, Inc. |
| Sector: Health Care | |
| SubSector: Medical Instruments & Supplies | |
| MarketCap: 264.36 Millions | |
| Recent Price: 15.86 Smart Investing & Trading Score: 35 | |
| Day Percent Change: 0.00% Day Change: 0.00 | |
| Week Change: -3.88% Year-to-date Change: -2.4% | |
| BLFS Links: Profile News Message Board | |
| Charts:- Daily , Weekly | |
| Add BLFS to Watchlist: View: Get Complete BLFS Trend Analysis ➞ | |
 | BMRN BioMarin Pharmaceutical Inc. |
| Sector: Health Care | |
| SubSector: Biotechnology | |
| MarketCap: 14887.5 Millions | |
| Recent Price: 88.63 Smart Investing & Trading Score: 55 | |
| Day Percent Change: -1.60% Day Change: -1.44 | |
| Week Change: -3.89% Year-to-date Change: -8.1% | |
| BMRN Links: Profile News Message Board | |
| Charts:- Daily , Weekly | |
| Add BMRN to Watchlist: View: Get Complete BMRN Trend Analysis ➞ | |
 | CSTL Castle Biosciences, Inc. |
| Sector: Health Care | |
| SubSector: Medical Laboratories & Research | |
| MarketCap: 545 Millions | |
| Recent Price: 19.28 Smart Investing & Trading Score: 25 | |
| Day Percent Change: 0.42% Day Change: 0.08 | |
| Week Change: -3.89% Year-to-date Change: -10.7% | |
| CSTL Links: Profile News Message Board | |
| Charts:- Daily , Weekly | |
| Add CSTL to Watchlist: View: Get Complete CSTL Trend Analysis ➞ | |
 | MLTX MoonLake Immunotherapeutics |
| Sector: Health Care | |
| SubSector: Biotechnology | |
| MarketCap: 2670 Millions | |
| Recent Price: 42.19 Smart Investing & Trading Score: 0 | |
| Day Percent Change: -2.77% Day Change: -1.20 | |
| Week Change: -3.92% Year-to-date Change: -32.8% | |
| MLTX Links: Profile News Message Board | |
| Charts:- Daily , Weekly | |
| Add MLTX to Watchlist: View: Get Complete MLTX Trend Analysis ➞ | |
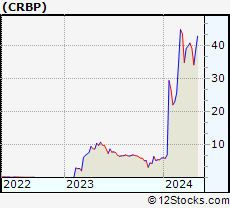 | CRBP Corbus Pharmaceuticals Holdings, Inc. |
| Sector: Health Care | |
| SubSector: Biotechnology | |
| MarketCap: 354.885 Millions | |
| Recent Price: 39.24 Smart Investing & Trading Score: 60 | |
| Day Percent Change: 7.42% Day Change: 2.71 | |
| Week Change: -3.94% Year-to-date Change: 549.7% | |
| CRBP Links: Profile News Message Board | |
| Charts:- Daily , Weekly | |
| Add CRBP to Watchlist: View: Get Complete CRBP Trend Analysis ➞ | |
 | DH Definitive Healthcare Corp. |
| Sector: Health Care | |
| SubSector: Health Information Services | |
| MarketCap: 1690 Millions | |
| Recent Price: 7.06 Smart Investing & Trading Score: 5 | |
| Day Percent Change: -2.89% Day Change: -0.21 | |
| Week Change: -3.95% Year-to-date Change: -29.9% | |
| DH Links: Profile News Message Board | |
| Charts:- Daily , Weekly | |
| Add DH to Watchlist: View: Get Complete DH Trend Analysis ➞ | |
| For tabular summary view of above stock list: Summary View ➞ 0 - 25 , 25 - 50 , 50 - 75 , 75 - 100 , 100 - 125 , 125 - 150 , 150 - 175 , 175 - 200 , 200 - 225 , 225 - 250 , 250 - 275 , 275 - 300 , 300 - 325 , 325 - 350 , 350 - 375 , 375 - 400 , 400 - 425 , 425 - 450 , 450 - 475 , 475 - 500 , 500 - 525 , 525 - 550 , 550 - 575 , 575 - 600 , 600 - 625 , 625 - 650 , 650 - 675 , 675 - 700 , 700 - 725 | ||
| Click To Change The Sort Order: By Market Cap or Company Size Performance: Year-to-date, Week and Day | |
| Select Chart Type: | ||
|
Best Stocks Today 12Stocks.com |
© 2024 12Stocks.com Terms & Conditions Privacy Contact Us
All Information Provided Only For Education And Not To Be Used For Investing or Trading. See Terms & Conditions


One More Thing ... Get Best Stocks Delivered Daily!
Never Ever Miss A Move With Our Top Ten Stocks Lists
Find Best Stocks In Any Market - Bull or Bear Market
Take A Peek At Our Top Ten Stocks Lists: Daily, Weekly, Year-to-Date & Top Trends
Find Best Stocks In Any Market - Bull or Bear Market
Take A Peek At Our Top Ten Stocks Lists: Daily, Weekly, Year-to-Date & Top Trends
Healthcare Stocks With Best Up Trends [0-bearish to 100-bullish]: Vanda [100], Rani [95], Humacyte [95], Phibro Animal[95], ALX Oncology[95], Fresenius [95], Oscar Health[95], Lantheus [93], United [93], Mesoblast [88], OPKO Health[88]
Best Healthcare Stocks Year-to-Date:
Precision BioSciences[2571.23%], Inovio [1798.04%], Assembly Biosciences[1535.17%], Adverum Biotechnologies[1406.38%], Aurora Cannabis[1256.57%], NuCana [1188.03%], Affimed N.V[724%], Corbus [549.67%], Agenus [541.38%], CareMax [429.9%], Zhongchao [412.19%] Best Healthcare Stocks This Week:
NuCana [1601.65%], Regencell Bioscience[45.67%], Rani [30.93%], Humacyte [28.47%], Venus Concept[25.44%], Vanda [24.03%], ALX Oncology[22.49%], ProKidney [16.57%], Nyxoah S.A[16.22%], Galera [15.36%], UnitedHealth [14.1%] Best Healthcare Stocks Daily:
Rani [15.71%], Genelux [14.25%], Humacyte [14.02%], Accelerate Diagnostics[11.56%], Emergent Bio[9.68%], Venus Concept[8.75%], Adaptimmune [8.72%], BioXcel [8.63%], Corbus [7.42%], RedHill Biopharma[7.41%], DermTech [7.05%]