
 Login Sign Up


| |||||
 |  | ||||

| 12Stocks.com Market Intelligence |
Best Healthcare Stocks
 | "Discover best trending healthcare stocks with 12Stocks.com." |
| - Subu Vdaygiri, Founder, 12Stocks.com |
| In a hurry? Healthcare Stocks Lists: Performance Trends Table, Stock Charts
Sort Healthcare stocks: Daily, Weekly, Year-to-Date, Market Cap & Trends. Filter Healthcare stocks list by size:All Healthcare Large Mid-Range Small |
| 12Stocks.com Healthcare Stocks Performances & Trends Daily | |||||||||
|
|  The overall Smart Investing & Trading Score is 83 (0-bearish to 100-bullish) which puts Healthcare sector in short term bullish trend. The Smart Investing & Trading Score from previous trading session is 88 and a deterioration of trend continues.
| ||||||||
Here are the Smart Investing & Trading Scores of the most requested Healthcare stocks at 12Stocks.com (click stock name for detailed review):
|


| 12Stocks.com: Investing in Healthcare sector with Stocks | |
|
The following table helps investors and traders sort through current performance and trends (as measured by Smart Investing & Trading Score) of various
stocks in the Healthcare sector. Quick View: Move mouse or cursor over stock symbol (ticker) to view short-term Technical chart and over stock name to view long term chart. Click on  to add stock symbol to your watchlist and to add stock symbol to your watchlist and  to view watchlist. Click on any ticker or stock name for detailed market intelligence report for that stock. to view watchlist. Click on any ticker or stock name for detailed market intelligence report for that stock. |
12Stocks.com Performance of Stocks in Healthcare Sector
| Ticker | Stock Name | Watchlist | Category | Recent Price | Smart Investing & Trading Score | Change % | Weekly Change% |
| PETQ | PetIQ |   | Pharmaceutical | 20.24 | 90 | 0.45% | 1.35% |
| VRCA | Verrica | | Biotechnology | 8.79 | 61 | 0.98% | 1.33% |
| CVRX | CVRx | | Medical Devices | 8.40 | 49 | 1.45% | 1.33% |
| LNTH | Lantheus | | Equipment | 80.71 | 83 | -2.61% | 1.31% |
| ASND | Ascendis Pharma | | Biotechnology | 122.70 | 25 | 1.35% | 1.30% |
| DOCS | Doximity | | Health Information | 28.39 | 87 | -3.50% | 1.27% |
| FULC | Fulcrum | | Biotechnology | 7.64 | 10 | -0.71% | 1.26% |
| IDYA | IDEAYA Biosciences | | Biotechnology | 41.00 | 17 | 1.69% | 1.23% |
| CCCC | C4 | | Biotechnology | 5.75 | 20 | 2.31% | 1.23% |
| REGN | Regeneron | | Biotechnology | 994.14 | 90 | 0.70% | 1.21% |
| IMUX | Immunic | | Biotechnology | 1.26 | 44 | -2.33% | 1.20% |
| ATHA | Athira Pharma | | Biotechnology | 2.55 | 42 | 1.19% | 1.19% |
| XOMAO | XOMA | | Biotechnology | 25.39 | 100 | 0.00% | 1.16% |
| VERO | Venus Concept | | Equipment | 0.63 | 20 | -0.30% | 1.11% |
| LGND | Ligand | | Biotechnology | 87.00 | 90 | 0.43% | 1.09% |
| KYMR | Kymera | | Biotechnology | 35.32 | 47 | -1.92% | 1.06% |
| BCYC | Bicycle | | Biotechnology | 21.59 | 10 | -0.58% | 1.05% |
| WRBY | Warby Parker | | Instruments | 16.70 | 90 | 0.06% | 1.03% |
| SRDX | Surmodics | | Diagnostic | 34.97 | 90 | -0.26% | 1.01% |
| ARWR | Arrowhead | | Biotechnology | 25.04 | 52 | 0.89% | 1.01% |
| RXRX | Recursion | | Biotechnology | 9.52 | 40 | -2.71% | 1.01% |
| INVA | Innoviva | | Biotechnology | 16.14 | 63 | 0.06% | 1.00% |
| FENC | Fennec | | Biotechnology | 7.11 | 32 | -2.74% | 0.99% |
| KRON | Kronos Bio | | Biotechnology | 1.03 | 55 | -0.96% | 0.98% |
| RDY | Dr. Reddy | | Pharmaceutical | 68.92 | 17 | 0.31% | 0.97% |
| For chart view version of above stock list: Chart View ➞ 0 - 25 , 25 - 50 , 50 - 75 , 75 - 100 , 100 - 125 , 125 - 150 , 150 - 175 , 175 - 200 , 200 - 225 , 225 - 250 , 250 - 275 , 275 - 300 , 300 - 325 , 325 - 350 , 350 - 375 , 375 - 400 , 400 - 425 , 425 - 450 , 450 - 475 , 475 - 500 , 500 - 525 , 525 - 550 , 550 - 575 , 575 - 600 , 600 - 625 , 625 - 650 , 650 - 675 , 675 - 700 , 700 - 725 | ||
 | Click To Change The Sort Order: By Market Cap or Company Size Performance: Year-to-date, Week and Day |  |
|
Get the most comprehensive stock market coverage daily at 12Stocks.com ➞ Best Stocks Today ➞ Best Stocks Weekly ➞ Best Stocks Year-to-Date ➞ Best Stocks Trends ➞  Best Stocks Today 12Stocks.com Best Nasdaq Stocks ➞ Best S&P 500 Stocks ➞ Best Tech Stocks ➞ Best Biotech Stocks ➞ |
| Detailed Overview of Healthcare Stocks |
| Healthcare Technical Overview, Leaders & Laggards, Top Healthcare ETF Funds & Detailed Healthcare Stocks List, Charts, Trends & More |
| Healthcare Sector: Technical Analysis, Trends & YTD Performance | |
| Healthcare sector is composed of stocks
from pharmaceutical, biotech, diagnostics labs, insurance providers
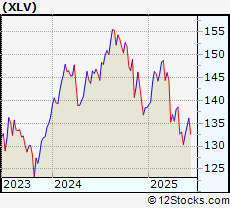
and healthcare services. Healthcare sector, as represented by XLV, an exchange-traded fund [ETF] that holds basket of Healthcare stocks (e.g, Merck, Amgen) is up by 7.24% and is currently underperforming the overall market by -3.67% year-to-date. Below is a quick view of Technical charts and trends: |
|
 XLV Weekly Chart |
|
| Long Term Trend: Very Good | |
| Medium Term Trend: Very Good | |
 XLV Daily Chart |
|
| Short Term Trend: Not Good | |
| Overall Trend Score: 83 | |
| YTD Performance: 7.24% | |
| **Trend Scores & Views Are Only For Educational Purposes And Not For Investing | |
| 12Stocks.com: Top Performing Healthcare Sector Stocks | ||||||||||||||||||||||||||||||||||||||||||||||||
 The top performing Healthcare sector stocks year to date are
Now, more recently, over last week, the top performing Healthcare sector stocks on the move are


|
||||||||||||||||||||||||||||||||||||||||||||||||
| 12Stocks.com: Investing in Healthcare Sector using Exchange Traded Funds | |
|
The following table shows list of key exchange traded funds (ETF) that
help investors track Healthcare Index. For detailed view, check out our ETF Funds section of our website. Quick View: Move mouse or cursor over ETF symbol (ticker) to view short-term Technical chart and over ETF name to view long term chart. Click on ticker or stock name for detailed view. Click on to add stock symbol to your watchlist and to view watchlist. |
12Stocks.com List of ETFs that track Healthcare Index
| Ticker | ETF Name | Watchlist | Recent Price | Smart Investing & Trading Score | Change % | Week % | Year-to-date % |
| XLV | Health Care | | 146.25 | 83 | 0.17 | -0.04 | 7.24% |
| XBI | Biotech | | 91.57 | 45 | -0.76 | 0.43 | 2.55% |
| IBB | Biotechnology | | 136.86 | 70 | -0.47 | 0.12 | 0.74% |
| BBH | Biotech | | 168.04 | 83 | -0.33 | 0.03 | 1.65% |
| VHT | Health Care | | 266.91 | 67 | 0.02 | -0.07 | 6.47% |
| IYH | Healthcare | | 61.39 | 62 | 0.24 | 0.08 | 7.24% |
| IHF | Healthcare Providers | | 53.71 | 76 | 0.32 | -0.37 | 2.29% |
| IHI | Medical Devices | | 56.36 | 30 | -0.16 | -0.58 | 4.43% |
| BIB | Biotechnology | | 57.88 | 63 | -0.02 | 1.62 | 1.45% |
| BIS | Short Biotech | | 17.32 | 18 | -0.06 | -1.53 | -4.15% |
| XHE | Health Care Equipment | | 86.97 | 61 | -0.61 | -0.55 | 3.22% |
| CURE | Healthcare Bull 3X | | 118.20 | 70 | -0.04 | -0.76 | 16.18% |
| LABU | Biotech Bull 3X | | 113.12 | 32 | -2.31 | 1.19 | -7.26% |
| LABD | Biotech Bear 3X | | 7.83 | 61 | 2.09 | -1.51 | -19.2% |
| PSCH | SmallCap Health Care | | 43.44 | 56 | -0.02 | 0.1 | 1.5% |
| XHS | Health Care Services | | 91.28 | 73 | -0.65 | -0.29 | 2.62% |
| PTH | DWA Healthcare Momentum | | 43.07 | 35 | -0.09 | 1.03 | 10.04% |
| BTEC | Principal Healthcare Innovators | | 36.83 | 28 | -0.30 | 0.96 | 1.38% |
| RXL | Health Care | | 103.09 | 83 | 0.19 | 0.32 | 12.79% |
| RXD | Short Health Care | | 10.57 | 25 | 0.00 | 0.07 | -11.36% |
| 12Stocks.com: Charts, Trends, Fundamental Data and Performances of Healthcare Stocks | |
|
We now take in-depth look at all Healthcare stocks including charts, multi-period performances and overall trends (as measured by Smart Investing & Trading Score). One can sort Healthcare stocks (click link to choose) by Daily, Weekly and by Year-to-Date performances. Also, one can sort by size of the company or by market capitalization. |
| Select Your Default Chart Type: | |||||
| |||||
| Click on stock symbol or name for detailed view. Click on to add stock symbol to your watchlist and to view watchlist. Quick View: Move mouse or cursor over "Daily" to quickly view daily Technical stock chart and over "Weekly" to view weekly Technical stock chart. | |||||

 | PETQ PetIQ, Inc. |
| Sector: Health Care | |
| SubSector: Drugs - Generic | |
| MarketCap: 587.585 Millions | |
| Recent Price: 20.24 Smart Investing & Trading Score: 90 | |
| Day Percent Change: 0.45% Day Change: 0.09 | |
| Week Change: 1.35% Year-to-date Change: 2.5% | |
| PETQ Links: Profile News Message Board | |
| Charts:- Daily , Weekly | |
| Add PETQ to Watchlist: View: Get Complete PETQ Trend Analysis ➞ | |
 | VRCA Verrica Pharmaceuticals Inc. |
| Sector: Health Care | |
| SubSector: Biotechnology | |
| MarketCap: 289.585 Millions | |
| Recent Price: 8.79 Smart Investing & Trading Score: 61 | |
| Day Percent Change: 0.98% Day Change: 0.09 | |
| Week Change: 1.33% Year-to-date Change: 20.0% | |
| VRCA Links: Profile News Message Board | |
| Charts:- Daily , Weekly | |
| Add VRCA to Watchlist: View: Get Complete VRCA Trend Analysis ➞ | |
 | CVRX CVRx, Inc. |
| Sector: Health Care | |
| SubSector: Medical Devices | |
| MarketCap: 327 Millions | |
| Recent Price: 8.40 Smart Investing & Trading Score: 49 | |
| Day Percent Change: 1.45% Day Change: 0.12 | |
| Week Change: 1.33% Year-to-date Change: -73.3% | |
| CVRX Links: Profile News Message Board | |
| Charts:- Daily , Weekly | |
| Add CVRX to Watchlist: View: Get Complete CVRX Trend Analysis ➞ | |
 | LNTH Lantheus Holdings, Inc. |
| Sector: Health Care | |
| SubSector: Medical Appliances & Equipment | |
| MarketCap: 467.18 Millions | |
| Recent Price: 80.71 Smart Investing & Trading Score: 83 | |
| Day Percent Change: -2.61% Day Change: -2.16 | |
| Week Change: 1.31% Year-to-date Change: 30.2% | |
| LNTH Links: Profile News Message Board | |
| Charts:- Daily , Weekly | |
| Add LNTH to Watchlist: View: Get Complete LNTH Trend Analysis ➞ | |
 | ASND Ascendis Pharma A/S |
| Sector: Health Care | |
| SubSector: Biotechnology | |
| MarketCap: 5470.35 Millions | |
| Recent Price: 122.70 Smart Investing & Trading Score: 25 | |
| Day Percent Change: 1.35% Day Change: 1.63 | |
| Week Change: 1.3% Year-to-date Change: -2.6% | |
| ASND Links: Profile News Message Board | |
| Charts:- Daily , Weekly | |
| Add ASND to Watchlist: View: Get Complete ASND Trend Analysis ➞ | |
 | DOCS Doximity, Inc. |
| Sector: Health Care | |
| SubSector: Health Information Services | |
| MarketCap: 6540 Millions | |
| Recent Price: 28.39 Smart Investing & Trading Score: 87 | |
| Day Percent Change: -3.50% Day Change: -1.03 | |
| Week Change: 1.27% Year-to-date Change: -0.2% | |
| DOCS Links: Profile News Message Board | |
| Charts:- Daily , Weekly | |
| Add DOCS to Watchlist: View: Get Complete DOCS Trend Analysis ➞ | |
 | FULC Fulcrum Therapeutics, Inc. |
| Sector: Health Care | |
| SubSector: Biotechnology | |
| MarketCap: 274.785 Millions | |
| Recent Price: 7.64 Smart Investing & Trading Score: 10 | |
| Day Percent Change: -0.71% Day Change: -0.06 | |
| Week Change: 1.26% Year-to-date Change: 13.3% | |
| FULC Links: Profile News Message Board | |
| Charts:- Daily , Weekly | |
| Add FULC to Watchlist: View: Get Complete FULC Trend Analysis ➞ | |
 | IDYA IDEAYA Biosciences, Inc. |
| Sector: Health Care | |
| SubSector: Biotechnology | |
| MarketCap: 89.1785 Millions | |
| Recent Price: 41.00 Smart Investing & Trading Score: 17 | |
| Day Percent Change: 1.69% Day Change: 0.68 | |
| Week Change: 1.23% Year-to-date Change: 15.2% | |
| IDYA Links: Profile News Message Board | |
| Charts:- Daily , Weekly | |
| Add IDYA to Watchlist: View: Get Complete IDYA Trend Analysis ➞ | |
 | CCCC C4 Therapeutics, Inc. |
| Sector: Health Care | |
| SubSector: Biotechnology | |
| MarketCap: 12587 Millions | |
| Recent Price: 5.75 Smart Investing & Trading Score: 20 | |
| Day Percent Change: 2.31% Day Change: 0.13 | |
| Week Change: 1.23% Year-to-date Change: 2.0% | |
| CCCC Links: Profile News Message Board | |
| Charts:- Daily , Weekly | |
| Add CCCC to Watchlist: View: Get Complete CCCC Trend Analysis ➞ | |
 | REGN Regeneron Pharmaceuticals, Inc. |
| Sector: Health Care | |
| SubSector: Biotechnology | |
| MarketCap: 51903.7 Millions | |
| Recent Price: 994.14 Smart Investing & Trading Score: 90 | |
| Day Percent Change: 0.70% Day Change: 6.88 | |
| Week Change: 1.21% Year-to-date Change: 13.2% | |
| REGN Links: Profile News Message Board | |
| Charts:- Daily , Weekly | |
| Add REGN to Watchlist: View: Get Complete REGN Trend Analysis ➞ | |
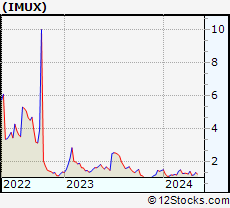 | IMUX Immunic, Inc. |
| Sector: Health Care | |
| SubSector: Biotechnology | |
| MarketCap: 57.1785 Millions | |
| Recent Price: 1.26 Smart Investing & Trading Score: 44 | |
| Day Percent Change: -2.33% Day Change: -0.03 | |
| Week Change: 1.2% Year-to-date Change: -15.4% | |
| IMUX Links: Profile News Message Board | |
| Charts:- Daily , Weekly | |
| Add IMUX to Watchlist: View: Get Complete IMUX Trend Analysis ➞ | |
 | ATHA Athira Pharma, Inc. |
| Sector: Health Care | |
| SubSector: Biotechnology | |
| MarketCap: 92487 Millions | |
| Recent Price: 2.55 Smart Investing & Trading Score: 42 | |
| Day Percent Change: 1.19% Day Change: 0.03 | |
| Week Change: 1.19% Year-to-date Change: 4.5% | |
| ATHA Links: Profile News Message Board | |
| Charts:- Daily , Weekly | |
| Add ATHA to Watchlist: View: Get Complete ATHA Trend Analysis ➞ | |
 | XOMAO XOMA Corporation |
| Sector: Health Care | |
| SubSector: Biotechnology | |
| MarketCap: 217 Millions | |
| Recent Price: 25.39 Smart Investing & Trading Score: 100 | |
| Day Percent Change: 0.00% Day Change: 0.00 | |
| Week Change: 1.16% Year-to-date Change: 1.6% | |
| XOMAO Links: Profile News Message Board | |
| Charts:- Daily , Weekly | |
| Add XOMAO to Watchlist: View: Get Complete XOMAO Trend Analysis ➞ | |
 | VERO Venus Concept Inc. |
| Sector: Health Care | |
| SubSector: Medical Appliances & Equipment | |
| MarketCap: 101.08 Millions | |
| Recent Price: 0.63 Smart Investing & Trading Score: 20 | |
| Day Percent Change: -0.30% Day Change: 0.00 | |
| Week Change: 1.11% Year-to-date Change: -46.8% | |
| VERO Links: Profile News Message Board | |
| Charts:- Daily , Weekly | |
| Add VERO to Watchlist: View: Get Complete VERO Trend Analysis ➞ | |
 | LGND Ligand Pharmaceuticals Incorporated |
| Sector: Health Care | |
| SubSector: Biotechnology | |
| MarketCap: 1344.45 Millions | |
| Recent Price: 87.00 Smart Investing & Trading Score: 90 | |
| Day Percent Change: 0.43% Day Change: 0.37 | |
| Week Change: 1.09% Year-to-date Change: 21.8% | |
| LGND Links: Profile News Message Board | |
| Charts:- Daily , Weekly | |
| Add LGND to Watchlist: View: Get Complete LGND Trend Analysis ➞ | |
 | KYMR Kymera Therapeutics, Inc. |
| Sector: Health Care | |
| SubSector: Biotechnology | |
| MarketCap: 27087 Millions | |
| Recent Price: 35.32 Smart Investing & Trading Score: 47 | |
| Day Percent Change: -1.92% Day Change: -0.69 | |
| Week Change: 1.06% Year-to-date Change: 39.0% | |
| KYMR Links: Profile News Message Board | |
| Charts:- Daily , Weekly | |
| Add KYMR to Watchlist: View: Get Complete KYMR Trend Analysis ➞ | |
 | BCYC Bicycle Therapeutics plc |
| Sector: Health Care | |
| SubSector: Biotechnology | |
| MarketCap: 214.485 Millions | |
| Recent Price: 21.59 Smart Investing & Trading Score: 10 | |
| Day Percent Change: -0.58% Day Change: -0.13 | |
| Week Change: 1.05% Year-to-date Change: 19.4% | |
| BCYC Links: Profile News Message Board | |
| Charts:- Daily , Weekly | |
| Add BCYC to Watchlist: View: Get Complete BCYC Trend Analysis ➞ | |
 | WRBY Warby Parker Inc. |
| Sector: Health Care | |
| SubSector: Medical Instruments & Supplies | |
| MarketCap: 1380 Millions | |
| Recent Price: 16.70 Smart Investing & Trading Score: 90 | |
| Day Percent Change: 0.06% Day Change: 0.01 | |
| Week Change: 1.03% Year-to-date Change: 18.4% | |
| WRBY Links: Profile News Message Board | |
| Charts:- Daily , Weekly | |
| Add WRBY to Watchlist: View: Get Complete WRBY Trend Analysis ➞ | |
 | SRDX Surmodics, Inc. |
| Sector: Health Care | |
| SubSector: Diagnostic Substances | |
| MarketCap: 388.171 Millions | |
| Recent Price: 34.97 Smart Investing & Trading Score: 90 | |
| Day Percent Change: -0.26% Day Change: -0.09 | |
| Week Change: 1.01% Year-to-date Change: -3.8% | |
| SRDX Links: Profile News Message Board | |
| Charts:- Daily , Weekly | |
| Add SRDX to Watchlist: View: Get Complete SRDX Trend Analysis ➞ | |
 | ARWR Arrowhead Pharmaceuticals, Inc. |
| Sector: Health Care | |
| SubSector: Biotechnology | |
| MarketCap: 3226.15 Millions | |
| Recent Price: 25.04 Smart Investing & Trading Score: 52 | |
| Day Percent Change: 0.89% Day Change: 0.22 | |
| Week Change: 1.01% Year-to-date Change: -18.2% | |
| ARWR Links: Profile News Message Board | |
| Charts:- Daily , Weekly | |
| Add ARWR to Watchlist: View: Get Complete ARWR Trend Analysis ➞ | |
 | RXRX Recursion Pharmaceuticals, Inc. |
| Sector: Health Care | |
| SubSector: Biotechnology | |
| MarketCap: 1470 Millions | |
| Recent Price: 9.52 Smart Investing & Trading Score: 40 | |
| Day Percent Change: -2.71% Day Change: -0.26 | |
| Week Change: 1.01% Year-to-date Change: -2.8% | |
| RXRX Links: Profile News Message Board | |
| Charts:- Daily , Weekly | |
| Add RXRX to Watchlist: View: Get Complete RXRX Trend Analysis ➞ | |
 | INVA Innoviva, Inc. |
| Sector: Health Care | |
| SubSector: Biotechnology | |
| MarketCap: 1023.15 Millions | |
| Recent Price: 16.14 Smart Investing & Trading Score: 63 | |
| Day Percent Change: 0.06% Day Change: 0.01 | |
| Week Change: 1% Year-to-date Change: 0.6% | |
| INVA Links: Profile News Message Board | |
| Charts:- Daily , Weekly | |
| Add INVA to Watchlist: View: Get Complete INVA Trend Analysis ➞ | |
 | FENC Fennec Pharmaceuticals Inc. |
| Sector: Health Care | |
| SubSector: Biotechnology | |
| MarketCap: 126.785 Millions | |
| Recent Price: 7.11 Smart Investing & Trading Score: 32 | |
| Day Percent Change: -2.74% Day Change: -0.20 | |
| Week Change: 0.99% Year-to-date Change: -36.6% | |
| FENC Links: Profile News Message Board | |
| Charts:- Daily , Weekly | |
| Add FENC to Watchlist: View: Get Complete FENC Trend Analysis ➞ | |
 | KRON Kronos Bio, Inc. |
| Sector: Health Care | |
| SubSector: Biotechnology | |
| MarketCap: 17287 Millions | |
| Recent Price: 1.03 Smart Investing & Trading Score: 55 | |
| Day Percent Change: -0.96% Day Change: -0.01 | |
| Week Change: 0.98% Year-to-date Change: -17.6% | |
| KRON Links: Profile News Message Board | |
| Charts:- Daily , Weekly | |
| Add KRON to Watchlist: View: Get Complete KRON Trend Analysis ➞ | |
 | RDY Dr. Reddy s Laboratories Limited |
| Sector: Health Care | |
| SubSector: Drug Manufacturers - Other | |
| MarketCap: 6590.23 Millions | |
| Recent Price: 68.92 Smart Investing & Trading Score: 17 | |
| Day Percent Change: 0.31% Day Change: 0.21 | |
| Week Change: 0.97% Year-to-date Change: -1.0% | |
| RDY Links: Profile News Message Board | |
| Charts:- Daily , Weekly | |
| Add RDY to Watchlist: View: Get Complete RDY Trend Analysis ➞ | |
| For tabular summary view of above stock list: Summary View ➞ 0 - 25 , 25 - 50 , 50 - 75 , 75 - 100 , 100 - 125 , 125 - 150 , 150 - 175 , 175 - 200 , 200 - 225 , 225 - 250 , 250 - 275 , 275 - 300 , 300 - 325 , 325 - 350 , 350 - 375 , 375 - 400 , 400 - 425 , 425 - 450 , 450 - 475 , 475 - 500 , 500 - 525 , 525 - 550 , 550 - 575 , 575 - 600 , 600 - 625 , 625 - 650 , 650 - 675 , 675 - 700 , 700 - 725 | ||
| Click To Change The Sort Order: By Market Cap or Company Size Performance: Year-to-date, Week and Day | |
| Select Chart Type: | ||
|
Best Stocks Today 12Stocks.com |
© 2024 12Stocks.com Terms & Conditions Privacy Contact Us
All Information Provided Only For Education And Not To Be Used For Investing or Trading. See Terms & Conditions


One More Thing ... Get Best Stocks Delivered Daily!
Never Ever Miss A Move With Our Top Ten Stocks Lists
Find Best Stocks In Any Market - Bull or Bear Market
Take A Peek At Our Top Ten Stocks Lists: Daily, Weekly, Year-to-Date & Top Trends
Find Best Stocks In Any Market - Bull or Bear Market
Take A Peek At Our Top Ten Stocks Lists: Daily, Weekly, Year-to-Date & Top Trends
Healthcare Stocks With Best Up Trends [0-bearish to 100-bullish]: Third Harmonic[100], Concord [100], Brainstorm Cell[100], Arbutus Biopharma[100], Tandem Diabetes[100], PureTech Health[100], Genfit SA[100], Heron [100], Integer [100], Vericel [100], Boston Scientific[100]
Best Healthcare Stocks Year-to-Date:
Pieris [6042.86%], Precision BioSciences[3472.6%], Avenue [2266.46%], Inovio [2052.94%], Assembly Biosciences[1717.46%], Aurora Cannabis[1398.32%], Agenus [1240.74%], NuCana [1103.52%], Adverum Biotechnologies[949.42%], Affimed N.V[716%], Burning Rock[690.76%] Best Healthcare Stocks This Week:
DURECT [38.14%], Genelux [31.78%], Concord [29.19%], iBio [27.37%], Nobilis Health[26.23%], Pulse Biosciences[24.58%], Scilex Holding[22.22%], Dyne [17.81%], PTC [17.45%], Accelerate Diagnostics[17.35%], CareMax [16.61%] Best Healthcare Stocks Daily:
DURECT [25.00%], Accelerate Diagnostics[17.96%], CareMax [17.83%], RAPT [15.00%], Pulse Biosciences[13.40%], Genelux [11.86%], Relay [11.58%], Sol-Gel Technologies[10.62%], iBio [9.30%], Vaxxinity [9.30%], Third Harmonic[8.54%]