
 Login Sign Up


| |||||
 |  | ||||

| 12Stocks.com Market Intelligence |
Best Healthcare Stocks
 | "Discover best trending healthcare stocks with 12Stocks.com." |
| - Subu Vdaygiri, Founder, 12Stocks.com |
| In a hurry? Healthcare Stocks Lists: Performance Trends Table, Stock Charts
Sort Healthcare stocks: Daily, Weekly, Year-to-Date, Market Cap & Trends. Filter Healthcare stocks list by size:All Healthcare Large Mid-Range Small |
| 12Stocks.com Healthcare Stocks Performances & Trends Daily | |||||||||
|
|  The overall Smart Investing & Trading Score is 83 (0-bearish to 100-bullish) which puts Healthcare sector in short term bullish trend. The Smart Investing & Trading Score from previous trading session is 88 and a deterioration of trend continues.
| ||||||||
Here are the Smart Investing & Trading Scores of the most requested Healthcare stocks at 12Stocks.com (click stock name for detailed review):
|


| 12Stocks.com: Investing in Healthcare sector with Stocks | |
|
The following table helps investors and traders sort through current performance and trends (as measured by Smart Investing & Trading Score) of various
stocks in the Healthcare sector. Quick View: Move mouse or cursor over stock symbol (ticker) to view short-term Technical chart and over stock name to view long term chart. Click on  to add stock symbol to your watchlist and to add stock symbol to your watchlist and  to view watchlist. Click on any ticker or stock name for detailed market intelligence report for that stock. to view watchlist. Click on any ticker or stock name for detailed market intelligence report for that stock. |
12Stocks.com Performance of Stocks in Healthcare Sector
| Ticker | Stock Name | Watchlist | Category | Recent Price | Smart Investing & Trading Score | Change % | Weekly Change% |
| RYTM | Rhythm |   | Biotechnology | 37.97 | 10 | -2.54% | 0.03% |
| SVA | Sinovac Biotech | | Biotechnology | 6.47 | 17 | 0.00% | 0.00% |
| BFLY | Butterfly Network | | Medical Devices | 1.03 | 49 | -0.96% | 0.00% |
| RFL | Rafael | | Biotechnology | 1.60 | 15 | -0.62% | 0.00% |
| CTSO | Cytosorbents | | Laboratories | 0.94 | 59 | -4.02% | 0.00% |
| PGEN | Precigen | | Biotechnology | 1.38 | 15 | -0.72% | 0.00% |
| APYX | Apyx | | Instruments | 1.60 | 62 | 0.00% | 0.00% |
| ZCMD | Zhongchao | | Health Information | 1.51 | 32 | 0.00% | 0.00% |
| IMAB | I Mab | | Biotechnology | 1.75 | 22 | -0.28% | 0.00% |
| NKTX | Nkarta | | Biotechnology | 6.53 | 15 | -2.97% | 0.00% |
| NBTX | Nanobiotix S.A | | Biotechnology | 7.23 | 66 | 0.00% | 0.00% |
| AMLX | Amylyx | | Biotechnology | 1.83 | 20 | -0.54% | 0.00% |
| ROIV | Roivant Sciences | | Biotechnology | 11.23 | 12 | -0.88% | 0.00% |
| NARI | Inari | | Medical Devices | 45.74 | 42 | -0.85% | -0.02% |
| RNA | Avidity Biosciences | | Biotechnology | 29.49 | 78 | 0.85% | -0.03% |
| OLK | Olink Holding | | Diagnostics & Research | 23.94 | 65 | 0.42% | -0.04% |
| CRL | Charles River | | Laboratories | 221.48 | 7 | -0.71% | -0.06% |
| FUSN | Fusion | | Biotechnology | 21.50 | 70 | -0.16% | -0.07% |
| MTD | Mettler-Toledo | | Instruments | 1521.29 | 76 | 0.20% | -0.10% |
| GTHX | G1 | | Biotechnology | 4.53 | 58 | -0.55% | -0.11% |
| RMD | ResMed | | Instruments | 218.28 | 51 | -0.21% | -0.13% |
| NEO | NeoGenomics | | Laboratories | 14.78 | 10 | -0.87% | -0.14% |
| ITOS | iTeos | | Biotechnology | 18.02 | 83 | -0.36% | -0.14% |
| ALC | Alcon | | Instruments | 88.70 | 69 | 0.68% | -0.15% |
| SWAV | ShockWave | | Equipment | 329.63 | 61 | -0.07% | -0.15% |
| For chart view version of above stock list: Chart View ➞ 0 - 25 , 25 - 50 , 50 - 75 , 75 - 100 , 100 - 125 , 125 - 150 , 150 - 175 , 175 - 200 , 200 - 225 , 225 - 250 , 250 - 275 , 275 - 300 , 300 - 325 , 325 - 350 , 350 - 375 , 375 - 400 , 400 - 425 , 425 - 450 , 450 - 475 , 475 - 500 , 500 - 525 , 525 - 550 , 550 - 575 , 575 - 600 , 600 - 625 , 625 - 650 , 650 - 675 , 675 - 700 , 700 - 725 | ||
 | Click To Change The Sort Order: By Market Cap or Company Size Performance: Year-to-date, Week and Day |  |
|
Get the most comprehensive stock market coverage daily at 12Stocks.com ➞ Best Stocks Today ➞ Best Stocks Weekly ➞ Best Stocks Year-to-Date ➞ Best Stocks Trends ➞  Best Stocks Today 12Stocks.com Best Nasdaq Stocks ➞ Best S&P 500 Stocks ➞ Best Tech Stocks ➞ Best Biotech Stocks ➞ |
| Detailed Overview of Healthcare Stocks |
| Healthcare Technical Overview, Leaders & Laggards, Top Healthcare ETF Funds & Detailed Healthcare Stocks List, Charts, Trends & More |
| Healthcare Sector: Technical Analysis, Trends & YTD Performance | |
| Healthcare sector is composed of stocks
from pharmaceutical, biotech, diagnostics labs, insurance providers
and healthcare services. Healthcare sector, as represented by XLV, an exchange-traded fund [ETF] that holds basket of Healthcare stocks (e.g, Merck, Amgen) is up by 7.24% and is currently underperforming the overall market by -3.67% year-to-date. Below is a quick view of Technical charts and trends: |
|
 XLV Weekly Chart |
|
| Long Term Trend: Very Good | |
| Medium Term Trend: Very Good | |
 XLV Daily Chart |
|
| Short Term Trend: Good | |
| Overall Trend Score: 83 | |
| YTD Performance: 7.24% | |
| **Trend Scores & Views Are Only For Educational Purposes And Not For Investing | |
| 12Stocks.com: Top Performing Healthcare Sector Stocks | ||||||||||||||||||||||||||||||||||||||||||||||||
 The top performing Healthcare sector stocks year to date are
Now, more recently, over last week, the top performing Healthcare sector stocks on the move are


|
||||||||||||||||||||||||||||||||||||||||||||||||
| 12Stocks.com: Investing in Healthcare Sector using Exchange Traded Funds | |
|
The following table shows list of key exchange traded funds (ETF) that
help investors track Healthcare Index. For detailed view, check out our ETF Funds section of our website. Quick View: Move mouse or cursor over ETF symbol (ticker) to view short-term Technical chart and over ETF name to view long term chart. Click on ticker or stock name for detailed view. Click on to add stock symbol to your watchlist and to view watchlist. |
12Stocks.com List of ETFs that track Healthcare Index
| Ticker | ETF Name | Watchlist | Recent Price | Smart Investing & Trading Score | Change % | Week % | Year-to-date % |
| XLV | Health Care | | 146.25 | 83 | 0.17 | -0.04 | 7.24% |
| XBI | Biotech | | 91.57 | 45 | -0.76 | 0.43 | 2.55% |
| IBB | Biotechnology | | 136.91 | 63 | -0.44 | 0.16 | 0.78% |
| BBH | Biotech | | 168.15 | 83 | -0.26 | 0.1 | 1.72% |
| VHT | Health Care | | 266.91 | 67 | 0.02 | -0.07 | 6.47% |
| IYH | Healthcare | | 61.39 | 62 | 0.24 | 0.08 | 7.24% |
| IHF | Healthcare Providers | | 53.71 | 76 | 0.32 | -0.37 | 2.29% |
| IHI | Medical Devices | | 56.36 | 30 | -0.16 | -0.58 | 4.43% |
| BIB | Biotechnology | | 57.47 | 63 | -0.73 | 0.9 | 0.74% |
| BIS | Short Biotech | | 17.59 | 45 | 1.47 | -0.03 | -2.68% |
| XHE | Health Care Equipment | | 86.97 | 61 | -0.61 | -0.55 | 3.22% |
| CURE | Healthcare Bull 3X | | 118.89 | 70 | 0.55 | -0.18 | 16.86% |
| LABU | Biotech Bull 3X | | 113.12 | 32 | -2.31 | 1.19 | -7.26% |
| LABD | Biotech Bear 3X | | 7.83 | 61 | 2.09 | -1.51 | -19.2% |
| PSCH | SmallCap Health Care | | 43.31 | 64 | -0.31 | -0.19 | 1.2% |
| XHS | Health Care Services | | 91.28 | 76 | -0.65 | -0.29 | 2.62% |
| PTH | DWA Healthcare Momentum | | 42.76 | 43 | -0.81 | 0.3 | 9.25% |
| BTEC | Principal Healthcare Innovators | | 36.49 | 30 | -1.23 | 0.02 | 0.43% |
| RXL | Health Care | | 103.09 | 83 | 0.19 | 0.32 | 12.79% |
| RXD | Short Health Care | | 10.57 | 25 | 0.00 | 0.07 | -11.36% |
| 12Stocks.com: Charts, Trends, Fundamental Data and Performances of Healthcare Stocks | |
|
We now take in-depth look at all Healthcare stocks including charts, multi-period performances and overall trends (as measured by Smart Investing & Trading Score). One can sort Healthcare stocks (click link to choose) by Daily, Weekly and by Year-to-Date performances. Also, one can sort by size of the company or by market capitalization. |
| Select Your Default Chart Type: | |||||
| |||||
| Click on stock symbol or name for detailed view. Click on to add stock symbol to your watchlist and to view watchlist. Quick View: Move mouse or cursor over "Daily" to quickly view daily Technical stock chart and over "Weekly" to view weekly Technical stock chart. | |||||

 | RYTM Rhythm Pharmaceuticals, Inc. |
| Sector: Health Care | |
| SubSector: Biotechnology | |
| MarketCap: 643.685 Millions | |
| Recent Price: 37.97 Smart Investing & Trading Score: 10 | |
| Day Percent Change: -2.54% Day Change: -0.99 | |
| Week Change: 0.03% Year-to-date Change: -17.4% | |
| RYTM Links: Profile News Message Board | |
| Charts:- Daily , Weekly | |
| Add RYTM to Watchlist: View: Get Complete RYTM Trend Analysis ➞ | |
 | SVA Sinovac Biotech Ltd. |
| Sector: Health Care | |
| SubSector: Biotechnology | |
| MarketCap: 336.88 Millions | |
| Recent Price: 6.47 Smart Investing & Trading Score: 17 | |
| Day Percent Change: 0.00% Day Change: 0.00 | |
| Week Change: 0% Year-to-date Change: 0.0% | |
| SVA Links: Profile News Message Board | |
| Charts:- Daily , Weekly | |
| Add SVA to Watchlist: View: Get Complete SVA Trend Analysis ➞ | |
 | BFLY Butterfly Network, Inc. |
| Sector: Health Care | |
| SubSector: Medical Devices | |
| MarketCap: 461 Millions | |
| Recent Price: 1.03 Smart Investing & Trading Score: 49 | |
| Day Percent Change: -0.96% Day Change: -0.01 | |
| Week Change: 0% Year-to-date Change: -8.9% | |
| BFLY Links: Profile News Message Board | |
| Charts:- Daily , Weekly | |
| Add BFLY to Watchlist: View: Get Complete BFLY Trend Analysis ➞ | |
 | RFL Rafael Holdings, Inc. |
| Sector: Health Care | |
| SubSector: Biotechnology | |
| MarketCap: 203.685 Millions | |
| Recent Price: 1.60 Smart Investing & Trading Score: 15 | |
| Day Percent Change: -0.62% Day Change: -0.01 | |
| Week Change: 0% Year-to-date Change: -12.6% | |
| RFL Links: Profile News Message Board | |
| Charts:- Daily , Weekly | |
| Add RFL to Watchlist: View: Get Complete RFL Trend Analysis ➞ | |
 | CTSO Cytosorbents Corporation |
| Sector: Health Care | |
| SubSector: Medical Laboratories & Research | |
| MarketCap: 166.2 Millions | |
| Recent Price: 0.94 Smart Investing & Trading Score: 59 | |
| Day Percent Change: -4.02% Day Change: -0.04 | |
| Week Change: 0% Year-to-date Change: -15.3% | |
| CTSO Links: Profile News Message Board | |
| Charts:- Daily , Weekly | |
| Add CTSO to Watchlist: View: Get Complete CTSO Trend Analysis ➞ | |
 | PGEN Precigen, Inc. |
| Sector: Health Care | |
| SubSector: Biotechnology | |
| MarketCap: 564.785 Millions | |
| Recent Price: 1.38 Smart Investing & Trading Score: 15 | |
| Day Percent Change: -0.72% Day Change: -0.01 | |
| Week Change: 0% Year-to-date Change: 3.0% | |
| PGEN Links: Profile News Message Board | |
| Charts:- Daily , Weekly | |
| Add PGEN to Watchlist: View: Get Complete PGEN Trend Analysis ➞ | |
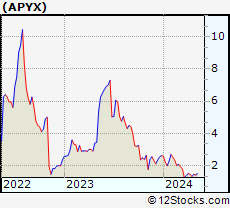 | APYX Apyx Medical Corporation |
| Sector: Health Care | |
| SubSector: Medical Instruments & Supplies | |
| MarketCap: 130.96 Millions | |
| Recent Price: 1.60 Smart Investing & Trading Score: 62 | |
| Day Percent Change: 0.00% Day Change: 0.00 | |
| Week Change: 0% Year-to-date Change: -38.9% | |
| APYX Links: Profile News Message Board | |
| Charts:- Daily , Weekly | |
| Add APYX to Watchlist: View: Get Complete APYX Trend Analysis ➞ | |
 | ZCMD Zhongchao Inc. |
| Sector: Health Care | |
| SubSector: Health Information Services | |
| MarketCap: 41487 Millions | |
| Recent Price: 1.51 Smart Investing & Trading Score: 32 | |
| Day Percent Change: 0.00% Day Change: 0.00 | |
| Week Change: 0% Year-to-date Change: 313.6% | |
| ZCMD Links: Profile News Message Board | |
| Charts:- Daily , Weekly | |
| Add ZCMD to Watchlist: View: Get Complete ZCMD Trend Analysis ➞ | |
 | IMAB I Mab |
| Sector: Health Care | |
| SubSector: Biotechnology | |
| MarketCap: 26187 Millions | |
| Recent Price: 1.75 Smart Investing & Trading Score: 22 | |
| Day Percent Change: -0.28% Day Change: 0.00 | |
| Week Change: 0% Year-to-date Change: -7.9% | |
| IMAB Links: Profile News Message Board | |
| Charts:- Daily , Weekly | |
| Add IMAB to Watchlist: View: Get Complete IMAB Trend Analysis ➞ | |
 | NKTX Nkarta, Inc. |
| Sector: Health Care | |
| SubSector: Biotechnology | |
| MarketCap: 23487 Millions | |
| Recent Price: 6.53 Smart Investing & Trading Score: 15 | |
| Day Percent Change: -2.97% Day Change: -0.20 | |
| Week Change: 0% Year-to-date Change: -1.0% | |
| NKTX Links: Profile News Message Board | |
| Charts:- Daily , Weekly | |
| Add NKTX to Watchlist: View: Get Complete NKTX Trend Analysis ➞ | |
 | NBTX Nanobiotix S.A. |
| Sector: Health Care | |
| SubSector: Biotechnology | |
| MarketCap: 177 Millions | |
| Recent Price: 7.23 Smart Investing & Trading Score: 66 | |
| Day Percent Change: 0.00% Day Change: 0.00 | |
| Week Change: 0% Year-to-date Change: -2.6% | |
| NBTX Links: Profile News Message Board | |
| Charts:- Daily , Weekly | |
| Add NBTX to Watchlist: View: Get Complete NBTX Trend Analysis ➞ | |
 | AMLX Amylyx Pharmaceuticals, Inc. |
| Sector: Health Care | |
| SubSector: Biotechnology | |
| MarketCap: 1500 Millions | |
| Recent Price: 1.83 Smart Investing & Trading Score: 20 | |
| Day Percent Change: -0.54% Day Change: -0.01 | |
| Week Change: 0% Year-to-date Change: -87.3% | |
| AMLX Links: Profile News Message Board | |
| Charts:- Daily , Weekly | |
| Add AMLX to Watchlist: View: Get Complete AMLX Trend Analysis ➞ | |
 | ROIV Roivant Sciences Ltd. |
| Sector: Health Care | |
| SubSector: Biotechnology | |
| MarketCap: 7780 Millions | |
| Recent Price: 11.23 Smart Investing & Trading Score: 12 | |
| Day Percent Change: -0.88% Day Change: -0.10 | |
| Week Change: 0% Year-to-date Change: 1.1% | |
| ROIV Links: Profile News Message Board | |
| Charts:- Daily , Weekly | |
| Add ROIV to Watchlist: View: Get Complete ROIV Trend Analysis ➞ | |
 | NARI Inari Medical, Inc. |
| Sector: Health Care | |
| SubSector: Medical Devices | |
| MarketCap: 33287 Millions | |
| Recent Price: 45.74 Smart Investing & Trading Score: 42 | |
| Day Percent Change: -0.85% Day Change: -0.39 | |
| Week Change: -0.02% Year-to-date Change: -29.6% | |
| NARI Links: Profile News Message Board | |
| Charts:- Daily , Weekly | |
| Add NARI to Watchlist: View: Get Complete NARI Trend Analysis ➞ | |
 | RNA Avidity Biosciences, Inc. |
| Sector: Health Care | |
| SubSector: Biotechnology | |
| MarketCap: 12287 Millions | |
| Recent Price: 29.49 Smart Investing & Trading Score: 78 | |
| Day Percent Change: 0.85% Day Change: 0.25 | |
| Week Change: -0.03% Year-to-date Change: 226.2% | |
| RNA Links: Profile News Message Board | |
| Charts:- Daily , Weekly | |
| Add RNA to Watchlist: View: Get Complete RNA Trend Analysis ➞ | |
 | OLK Olink Holding AB (publ) |
| Sector: Health Care | |
| SubSector: Diagnostics & Research | |
| MarketCap: 2370 Millions | |
| Recent Price: 23.94 Smart Investing & Trading Score: 65 | |
| Day Percent Change: 0.42% Day Change: 0.10 | |
| Week Change: -0.04% Year-to-date Change: -4.9% | |
| OLK Links: Profile News Message Board | |
| Charts:- Daily , Weekly | |
| Add OLK to Watchlist: View: Get Complete OLK Trend Analysis ➞ | |
 | CRL Charles River Laboratories International, Inc. |
| Sector: Health Care | |
| SubSector: Medical Laboratories & Research | |
| MarketCap: 5700.5 Millions | |
| Recent Price: 221.48 Smart Investing & Trading Score: 7 | |
| Day Percent Change: -0.71% Day Change: -1.58 | |
| Week Change: -0.06% Year-to-date Change: -6.3% | |
| CRL Links: Profile News Message Board | |
| Charts:- Daily , Weekly | |
| Add CRL to Watchlist: View: Get Complete CRL Trend Analysis ➞ | |
 | FUSN Fusion Pharmaceuticals Inc. |
| Sector: Health Care | |
| SubSector: Biotechnology | |
| MarketCap: 52487 Millions | |
| Recent Price: 21.50 Smart Investing & Trading Score: 70 | |
| Day Percent Change: -0.16% Day Change: -0.04 | |
| Week Change: -0.07% Year-to-date Change: 123.9% | |
| FUSN Links: Profile News Message Board | |
| Charts:- Daily , Weekly | |
| Add FUSN to Watchlist: View: Get Complete FUSN Trend Analysis ➞ | |
 | MTD Mettler-Toledo International Inc. |
| Sector: Health Care | |
| SubSector: Medical Instruments & Supplies | |
| MarketCap: 15973.1 Millions | |
| Recent Price: 1521.29 Smart Investing & Trading Score: 76 | |
| Day Percent Change: 0.20% Day Change: 3.00 | |
| Week Change: -0.1% Year-to-date Change: 25.4% | |
| MTD Links: Profile News Message Board | |
| Charts:- Daily , Weekly | |
| Add MTD to Watchlist: View: Get Complete MTD Trend Analysis ➞ | |
 | GTHX G1 Therapeutics, Inc. |
| Sector: Health Care | |
| SubSector: Biotechnology | |
| MarketCap: 484.085 Millions | |
| Recent Price: 4.53 Smart Investing & Trading Score: 58 | |
| Day Percent Change: -0.55% Day Change: -0.02 | |
| Week Change: -0.11% Year-to-date Change: 48.4% | |
| GTHX Links: Profile News Message Board | |
| Charts:- Daily , Weekly | |
| Add GTHX to Watchlist: View: Get Complete GTHX Trend Analysis ➞ | |
 | RMD ResMed Inc. |
| Sector: Health Care | |
| SubSector: Medical Instruments & Supplies | |
| MarketCap: 18660.2 Millions | |
| Recent Price: 218.28 Smart Investing & Trading Score: 51 | |
| Day Percent Change: -0.21% Day Change: -0.46 | |
| Week Change: -0.13% Year-to-date Change: 26.9% | |
| RMD Links: Profile News Message Board | |
| Charts:- Daily , Weekly | |
| Add RMD to Watchlist: View: Get Complete RMD Trend Analysis ➞ | |
 | NEO NeoGenomics, Inc. |
| Sector: Health Care | |
| SubSector: Medical Laboratories & Research | |
| MarketCap: 2763.8 Millions | |
| Recent Price: 14.78 Smart Investing & Trading Score: 10 | |
| Day Percent Change: -0.87% Day Change: -0.13 | |
| Week Change: -0.14% Year-to-date Change: -8.7% | |
| NEO Links: Profile News Message Board | |
| Charts:- Daily , Weekly | |
| Add NEO to Watchlist: View: Get Complete NEO Trend Analysis ➞ | |
 | ITOS iTeos Therapeutics, Inc. |
| Sector: Health Care | |
| SubSector: Biotechnology | |
| MarketCap: 10487 Millions | |
| Recent Price: 18.02 Smart Investing & Trading Score: 83 | |
| Day Percent Change: -0.36% Day Change: -0.07 | |
| Week Change: -0.14% Year-to-date Change: 64.8% | |
| ITOS Links: Profile News Message Board | |
| Charts:- Daily , Weekly | |
| Add ITOS to Watchlist: View: Get Complete ITOS Trend Analysis ➞ | |
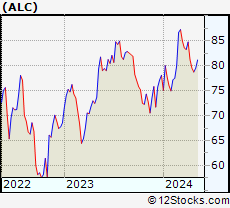 | ALC Alcon, Inc. |
| Sector: Health Care | |
| SubSector: Medical Instruments & Supplies | |
| MarketCap: 20968.1 Millions | |
| Recent Price: 88.70 Smart Investing & Trading Score: 69 | |
| Day Percent Change: 0.68% Day Change: 0.60 | |
| Week Change: -0.15% Year-to-date Change: 13.5% | |
| ALC Links: Profile News Message Board | |
| Charts:- Daily , Weekly | |
| Add ALC to Watchlist: View: Get Complete ALC Trend Analysis ➞ | |
 | SWAV ShockWave Medical, Inc. |
| Sector: Health Care | |
| SubSector: Medical Appliances & Equipment | |
| MarketCap: 855.58 Millions | |
| Recent Price: 329.63 Smart Investing & Trading Score: 61 | |
| Day Percent Change: -0.07% Day Change: -0.22 | |
| Week Change: -0.15% Year-to-date Change: 73.0% | |
| SWAV Links: Profile News Message Board | |
| Charts:- Daily , Weekly | |
| Add SWAV to Watchlist: View: Get Complete SWAV Trend Analysis ➞ | |
| For tabular summary view of above stock list: Summary View ➞ 0 - 25 , 25 - 50 , 50 - 75 , 75 - 100 , 100 - 125 , 125 - 150 , 150 - 175 , 175 - 200 , 200 - 225 , 225 - 250 , 250 - 275 , 275 - 300 , 300 - 325 , 325 - 350 , 350 - 375 , 375 - 400 , 400 - 425 , 425 - 450 , 450 - 475 , 475 - 500 , 500 - 525 , 525 - 550 , 550 - 575 , 575 - 600 , 600 - 625 , 625 - 650 , 650 - 675 , 675 - 700 , 700 - 725 | ||
| Click To Change The Sort Order: By Market Cap or Company Size Performance: Year-to-date, Week and Day | |
| Select Chart Type: | ||
|
Best Stocks Today 12Stocks.com |
© 2024 12Stocks.com Terms & Conditions Privacy Contact Us
All Information Provided Only For Education And Not To Be Used For Investing or Trading. See Terms & Conditions


One More Thing ... Get Best Stocks Delivered Daily!
Never Ever Miss A Move With Our Top Ten Stocks Lists
Find Best Stocks In Any Market - Bull or Bear Market
Take A Peek At Our Top Ten Stocks Lists: Daily, Weekly, Year-to-Date & Top Trends
Find Best Stocks In Any Market - Bull or Bear Market
Take A Peek At Our Top Ten Stocks Lists: Daily, Weekly, Year-to-Date & Top Trends
Healthcare Stocks With Best Up Trends [0-bearish to 100-bullish]: DURECT [100], Brainstorm Cell[100], Third Harmonic[100], Concord [100], Arbutus Biopharma[100], Madrigal [100], Tandem Diabetes[100], PureTech Health[100], Genfit SA[100], AstraZeneca [100], Moderna [100]
Best Healthcare Stocks Year-to-Date:
Pieris [6042.86%], Precision BioSciences[3472.6%], Avenue [2266.46%], Inovio [2054.9%], Assembly Biosciences[1748.56%], Aurora Cannabis[1398.32%], Agenus [1243.16%], NuCana [1103.52%], Adverum Biotechnologies[944.1%], Affimed N.V[724%], Burning Rock[690.76%] Best Healthcare Stocks This Week:
DURECT [37.07%], Genelux [31.78%], Nobilis Health[29.53%], Concord [29.19%], iBio [26.29%], Pulse Biosciences[24.58%], Accelerate Diagnostics[23.02%], Scilex Holding[22.22%], Dyne [17.88%], PTC [17.39%], CareMax [16.61%] Best Healthcare Stocks Daily:
DURECT [24.04%], Accelerate Diagnostics[23.66%], CareMax [17.83%], RAPT [15.00%], Pulse Biosciences[13.40%], Genelux [11.86%], Relay [11.58%], Sol-Gel Technologies[10.62%], Brainstorm Cell[9.35%], Vaxxinity [9.30%], Third Harmonic[8.54%]