12Stocks.com
Market
Intelligence

Stock Charts, Performance & Trend Analysis for EZU
iShares EuroNations

EZU
Year-to-Date: 37.4%
This Week: 3.2%
EZU Stock Charts
See Daily ➞
See Weekly ➞
See Monthly ➞

EZU
Year-to-Date (YTD) Return: 37.3653%
 
All about FANG Stocks ➞
Popular Trends!AAPL ➞ MSFT ➞ TSLA ➞
S&P 500 ➞ AMZN ➞ GOOGL ➞ FB ➞
Long Term Trend: Very Good
Medium Term Trend: Very Good
Short Term Trend: Very Good
EuroNations
Overall Trend Score:
100 Out Of 100
Bottomline: Bullish Trend


Get YOUR Stock Review:

October 3, 2025 - The year-to-date (YTD) performance of EuroNations (EZU) ETF is up 37.3653% and is outperforming the overall stock market by 22.6074%.

Recently, the weekly returns of EuroNations (EZU) is up 3.24484% and is outperforming the overall market by 2.357691%.

New! 12Stocks.com introduces Big Monthly, Weekly & Daily Charts
View EZU Stock Charts      Daily    Weekly    Monthly

All trends (long term, mid-term and short term) for iShares EuroNations looks good.

The overall 12Stocks.com Smart Investing & Trading Score is 100 (measures stock trend from 0-bearish to 100-bullish) which puts EZU in short term bullish trend.

The Smart Investing & Trading Score from previous trading session is 90 and an improvement of trend continues. Scroll down for key technical charts, support & resistance levels and analysis for EuroNations.

Stock Analysis for EZU
Name: iShares EuroNations
Sector:
SubSector:
In A Glance
EZU Technical Trend Chart View

Daily EZU Technical Chart
Add EZU To Watch List   View List
12Stocks.com
Short Term Trend Analysis for
100 / 100
The current technical trend score is 100 in a scale where 0 is bearish and 100 is bullish.
The technical trend score from previous session is 100.
Trend score updated daily. Not to be used for investing.
Recent Price: 63.00    
MarketCap: Millions
Day Percent Change: 0.590771%
Day Change: 0.91
Week Change: 3.24484%
Year-to-date Change: 37.3653%

Technical Levels: For the trading inclined, the following are the key levels of resistance (ceiling) and support (floor) for EZU. Ceiling and floor levels are stock prices at which the stock trend gets resistance or support respectively and traders have an eye on them. Long term levels are more important. Stocks that have broken thru their resistance or supports convincingly tend to have stronger trends (confirm with charts above visually).
Key Levels for EZU
 Short TermWeeklyLong Term
Resistance (Ceiling)61.1661.0860.85
Support (Floor)60.8559.1957.92

The table below shows stocks similar to iShares EuroNations, i.e, from same subsector or sector along with year-to-date (YTD), weekly & daily performaces for comparison. Usually, stocks from similar sector tend to move together but companies that have innovative products, services or good management tend to outperform. Quick View: Move mouse or cursor over stock symbol (ticker) to view short-term technical chart and over stock name to view long term chart. Click on ticker or stock name for detailed view. Click on to add stock symbol to your watchlist and to view watchlist.
TickerStock NameWatchlistCategoryRecent PriceChange %Weekly Change%YTD Change%
SAPSap SE ADR Software271.980.7378051.1649612.849%
RDS.AROYAL DTCH SH-A Oils-Energy76.420.44689849.52060%
RDS.BROYAL DTCH SH-B Oils-Energy170.030.573761232.8050%
AZNAstrazeneca plc ADR Drugs83.66-0.82977711.013829.6453%
NVSNovartis AG ADR Drugs130.97-0.569396.4796739.68%
HSBCHSBC Holdings plc ADR Banks70.83-0.7427131.3449751.3714%
LINLinde Plc Chemicals469.470.569825-0.98285314.0928%
SHELShell Plc ADR Big Oil71.82-0.84-2.150%
ULUnilever plc ADR Staples58.940.221051-1.91386.04381%
ARMArm Holdings plc. ADR Semiconductor151.260.598.34-5.2%
TTETotalEnergies SE ADR Big Oil59.58-1.46-5.650%
UBSUBS Group AG Banks40.34-0.197922-2.865439.7381%
BTIBritish American Tobacco Plc ADR Tobacco52.350.133894-0.057273848.2297%
SNYSanofi ADR Drugs50.150.7837628.08198.67869%
CBChubb Limited Insurance281.37-0.01421411.117663.92244%
BPBP plc ADR Big Oil33.86-1.74115-3.8341416.5781%
BBLBHP Group Metals49.950.462591-24.06510%
RELXRELX Plc ADR Services46.61-0.9772680.5175764.43203%
CALTCalliditas Therapeutics AB (publ) Healthcare40.000-0.3981570%
GSKGSK Plc ADR Drugs43.69-3.999128.7356931.6475%
RIORio Tinto plc ADR Metals66.26-0.04525573.7419816.8568%
NGGNational Grid Plc ADR Utilities72.53-0.4529231.9395625.3673%
BCSBarclays plc ADR Banks20.630.145631-0.43436361.2197%
DBDeutsche Bank AG Regional35.27-0.675866-1.86422110.772%
LYGLloyds Banking Group plc ADR Regional4.530.2212391.3422875.854%
You can find complete coverage in the following
Related Pages: 2025 Best Performing Stocks, 2025 Best Performing ETF Funds

Technical Levels: For the trading inclined, the following are the key levels of resistance (ceiling) and support (floor) for EZU. Ceiling and floor levels are stock prices at which the stock trend gets resistance or support respectively. Stocks & their trends tend to pause at these levels and hence traders have an eye on them.

Long term levels are more important. Stocks that have broken thru their resistance or support levels convincingly tend to have stronger trends (confirm with charts above visually).
Key Technical Levels for EZU
 Short TermWeeklyLong Term
Resistance (Ceiling)61.1661.0860.85
Support (Floor)60.8559.1957.92

        
RELATIVE PERFORMANCE OF
iShares EuroNations
Vs
THE MARKET
Relative performance of iShares EuroNations
How is EZU faring versus the market [S&P 500] ? Is it lagging or leading ? How is its relative performance ?
Symbol Day Change Week Change Year-to-Date Change
VTI 0.145759% 0.887149% 14.7579%
EZU 0.590771% 3.24484% 37.3653%

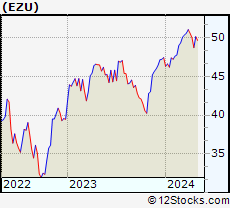
EZU Daily Chart

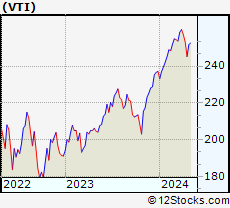
Total Market Daily Chart
Year to date returns, EZU is outperforming the market by 22.6074%
This week, EZU is outperforming the market by 2.357691%


List Of ETF Funds Similar To iShares EuroNations

The table below shows ETFs (Exchange Traded Funds) similar to iShares EuroNations, i.e, from same sector along with year-to-date (YTD), weekly & daily performaces for comparison. Usually, ETFs and associated stocks from similar sector tend to move together but companies that have innovative products, services or good management tend to outperform. Move mouse or cursor over ETF symbol to view short-term technical chart and over ETF name to view long term chart. Click on to add ETF symbol to your watchlist and to view watchlist.
TickerStock NameWatchlistCategoryRecent PriceChange %Weekly Change%YTD Change%
FXEEURO Currency Europe108.07-0.124763-0.24000714.8691%
EZUiShares EuroNations Europe63.000.5907713.2448437.3653%
IEViShares Europe 350  Europe66.450.2867492.1521930.4148%
DBVPowerShares DB G10 Currency  Europe25.41000%
GURSPDR S&P Emerging Europe Europe30.71-0.2598255.896550%
RSXRussia ETF Europe5.650.560648-63.57920%
EFOUltra MSCI EAFE  Europe60.810.357283.7148449.2486%
EWLiShares Switzerland  Europe56.250.5541653.1920724.9992%
EPVProShares UltraShort MSCI Europe Europe23.80-0.460059-4.9141-42.3416%
EWGiShares Germany  Europe42.470.8070262.9825436.7213%
EWQiShares France  Europe44.770.6293553.1329228.8405%
FXBBritish Pound Europe129.16-0.268705-0.14148210.2554%
ULEUltra Euro Europe13.14-0.454545-0.75528728.0702%
EUOUltraShort Euro Europe28.200.3276660.678329-20.7197%
EWUiShares United Kingdom Europe42.26-0.5647062.2007327.5142%
EWDiShares Sweden  Europe47.940.6931321.978330.9872%
EWPiShares Spain Europe49.36-0.5640611.6265261.2361%
EWNiShares Netherlands Europe59.511.138683.911335.8608%
EWIiShares Italy  Europe52.33-0.1526432.0276949.7972%
EWKiShares Belgium  Europe23.760.4676655.0031231.9567%
Get the most comprehensive stock market coverage daily at 12Stocks.com ➞
Best Stocks Today ➞
Best Stocks Weekly ➞
Best Stocks Year-to-Date ➞
Best Stocks Trends ➞


Best Stocks Today
12Stocks.com


Best Nasdaq Stocks ➞
Best S&P 500 Stocks ➞
Best Tech Stocks ➞
Best Biotech Stocks ➞
 

© 2025 12Stocks.com       Terms & Conditions   Privacy   Contact Us
All Information Provided Only For Education And Not To Be Used For Investing or Trading. See Terms & Conditions

 WatchListmy12Stocks
Best Stocks Today