
 Login Sign Up


| |||||
 |  | ||||

| 12Stocks.com Market Intelligence |
Best Tech Stocks
| In a hurry? Tech Stocks Lists: Performance & Trends, Stock Charts, FANG Stocks
Sort Tech stocks: Daily, Weekly, Year-to-Date, Market Cap & Trends. Filter Tech stocks list by size:All Tech Large Mid-Range Small and MicroCap |
| 12Stocks.com Tech Stocks Performances & Trends Daily | |||||||||
|
|  The overall Smart Investing & Trading Score is 64 (0-bearish to 100-bullish) which puts Technology sector in short term neutral to bullish trend. The Smart Investing & Trading Score from previous trading session is 49 and hence an improvement of trend.
| ||||||||
Here are the Smart Investing & Trading Scores of the most requested Technology stocks at 12Stocks.com (click stock name for detailed review):
|


| 12Stocks.com: Investing in Technology sector with Stocks | |
|
The following table helps investors and traders sort through current performance and trends (as measured by Smart Investing & Trading Score) of various
stocks in the Tech sector. Quick View: Move mouse or cursor over stock symbol (ticker) to view short-term technical chart and over stock name to view long term chart. Click on  to add stock symbol to your watchlist and to add stock symbol to your watchlist and  to view watchlist. Click on any ticker or stock name for detailed market intelligence report for that stock. to view watchlist. Click on any ticker or stock name for detailed market intelligence report for that stock. |
12Stocks.com Performance of Stocks in Tech Sector
| Ticker | Stock Name | Watchlist | Category | Recent Price | Smart Investing & Trading Score | Change % | Weekly Change% |
| XRX | Xerox |   | IT | 13.48 | 32 | 0.90% | 0.90% |
| PINC | Premier | | Healthcare Information | 20.72 | 23 | 0.90% | 0.90% |
| HQY | HealthEquity | | Healthcare Information | 79.24 | 25 | 0.88% | 0.88% |
| INST | Instructure | | Software - | 19.82 | 64 | 0.87% | 0.87% |
| CCOI | Cogent | | Communication | 63.61 | 32 | 0.86% | 0.86% |
| SWI | SolarWinds | | Software | 11.80 | 64 | 0.85% | 0.85% |
| KN | Knowles | | Communication | 16.71 | 100 | 0.84% | 0.84% |
| SYNA | Synaptics | | Software | 91.06 | 59 | 0.83% | 0.83% |
| TUYA | Tuya | | Software - Infrastructure | 1.84 | 69 | 0.82% | 0.82% |
| MLNK | MeridianLink | | Software - | 17.37 | 17 | 0.81% | 0.81% |
| MDB | MongoDB | | Software | 365.67 | 32 | 0.78% | 0.78% |
| ENPH | Enphase Energy | | Semiconductor | 115.08 | 15 | 0.77% | 0.77% |
| RUN | Sunrun | | Semiconductor | 11.99 | 74 | 0.76% | 0.76% |
| NOVT | Novanta | | Instruments | 161.11 | 64 | 0.76% | 0.76% |
| GBTG | Global Business | | Software - | 6.23 | 86 | 0.73% | 0.73% |
| RAMP | LiveRamp | | IT | 32.79 | 57 | 0.71% | 0.71% |
| MTSI | MACOM | | Semiconductor | 103.56 | 100 | 0.69% | 0.69% |
| NVT | nVent Electric | | Electronics | 76.40 | 85 | 0.67% | 0.67% |
| SATS | EchoStar | | Communication | 17.56 | 95 | 0.66% | 0.66% |
| DBX | Dropbox | | Software | 23.52 | 33 | 0.66% | 0.66% |
| FRSH | Freshworks | | Software - | 14.12 | 41 | 0.61% | 0.61% |
| SRAD | Sportradar | | Software - | 9.29 | 25 | 0.60% | 0.60% |
| INFA | Informatica | | Software - Infrastructure | 30.02 | 10 | 0.59% | 0.59% |
| ANGI | ANGI Homeservices | | Internet | 2.56 | 69 | 0.59% | 0.59% |
| ESE | ESCO | | Instruments | 107.90 | 100 | 0.58% | 0.58% |
| For chart view version of above stock list: Chart View ➞ 0 - 25 , 25 - 50 , 50 - 75 , 75 - 100 , 100 - 125 , 125 - 150 , 150 - 175 , 175 - 200 , 200 - 225 , 225 - 250 | ||
 | Click To Change The Sort Order: By Market Cap or Company Size Performance: Year-to-date, Week and Day |  |
|
Get the most comprehensive stock market coverage daily at 12Stocks.com ➞ Best Stocks Today ➞ Best Stocks Weekly ➞ Best Stocks Year-to-Date ➞ Best Stocks Trends ➞  Best Stocks Today 12Stocks.com Best Nasdaq Stocks ➞ Best S&P 500 Stocks ➞ Best Tech Stocks ➞ Best Biotech Stocks ➞ |
| Detailed Overview of Tech Stocks |
| Tech Technical Overview, Leaders & Laggards, Top Tech ETF Funds & Detailed Tech Stocks List, Charts, Trends & More |
| Tech Sector: Technical Analysis, Trends & YTD Performance | |
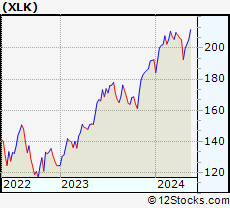
| Technology sector is composed of stocks
from semiconductors, software, web, social media
and services subsectors. Technology sector, as represented by XLK, an exchange-traded fund [ETF] that holds basket of tech stocks (e.g, Intel, Google) is up by 6.47% and is currently underperforming the overall market by -1.55% year-to-date. Below is a quick view of technical charts and trends: |
|
 XLK Weekly Chart |
|
| Long Term Trend: Not Good | |
| Medium Term Trend: Very Good | |
 XLK Daily Chart |
|
| Short Term Trend: Very Good | |
| Overall Trend Score: 64 | |
| YTD Performance: 6.47% | |
| **Trend Scores & Views Are Only For Educational Purposes And Not For Investing | |
| 12Stocks.com: Top Performing Technology Sector Stocks | ||||||||||||||||||||||||||||||||||||||||||||||||
 The top performing Technology sector stocks year to date are
Now, more recently, over last week, the top performing Technology sector stocks on the move are


|
||||||||||||||||||||||||||||||||||||||||||||||||
| 12Stocks.com: Investing in Tech Sector using Exchange Traded Funds | |
|
The following table shows list of key exchange traded funds (ETF) that
help investors track Tech Index. For detailed view, check out our ETF Funds section of our website. Quick View: Move mouse or cursor over ETF symbol (ticker) to view short-term technical chart and over ETF name to view long term chart. Click on ticker or stock name for detailed view. Click on to add stock symbol to your watchlist and to view watchlist. |
12Stocks.com List of ETFs that track Tech Index
| Ticker | ETF Name | Watchlist | Recent Price | Smart Investing & Trading Score | Change % | Week % | Year-to-date % |
| XLK | Technology | | 204.93 | 64 | 1.18 | 1.18 | 6.47% |
| QQQ | QQQ | | 440.30 | 77 | 1.11 | 1.11 | 7.52% |
| IYW | Technology | | 134.23 | 77 | 1.56 | 1.56 | 9.35% |
| VGT | Information Technology | | 516.83 | 29 | 1.45 | 1.45 | 6.78% |
| IXN | Global Tech | | 73.87 | 77 | 1.39 | 1.39 | 8.35% |
| IGV | Tech-Software | | 81.99 | 29 | 1.38 | 1.38 | 1.06% |
| XSD | Semiconductor | | 230.00 | 100 | 1.72 | 1.72 | 2.32% |
| TQQQ | QQQ | | 58.58 | 64 | 3.31 | 3.31 | 15.53% |
| SQQQ | Short QQQ | | 10.71 | 0 | -3.34 | -3.34 | -20.37% |
| SOXL | Semicondct Bull 3X | | 41.30 | 64 | 5.98 | 5.98 | 31.53% |
| SOXS | Semicondct Bear 3X | | 33.01 | 31 | -6.01 | -6.01 | 467.18% |
| SOXX | PHLX Semiconductor | | 220.61 | 42 | 2.05 | 2.05 | 14.88% |
| QTEC | First -100-Tech | | 184.97 | 64 | 1.22 | 1.22 | 5.42% |
| SMH | Semiconductor | | 222.67 | 95 | 2.27 | 2.27 | 27.33% |
| 12Stocks.com: Charts, Trends, Fundamental Data and Performances of Tech Stocks | |
|
We now take in-depth look at all Tech stocks including charts, multi-period performances and overall trends (as measured by Smart Investing & Trading Score). One can sort Tech stocks (click link to choose) by Daily, Weekly and by Year-to-Date performances. Also, one can sort by size of the company or by market capitalization. |
| Select Your Default Chart Type: | |||||
| |||||
| Click on stock symbol or name for detailed view. Click on to add stock symbol to your watchlist and to view watchlist. Quick View: Move mouse or cursor over "Daily" to quickly view daily technical stock chart and over "Weekly" to view weekly technical stock chart. | |||||


 | XRX Xerox Holdings Corporation |
| Sector: Technology | |
| SubSector: Information Technology Services | |
| MarketCap: 4077.48 Millions | |
| Recent Price: 13.48 Smart Investing & Trading Score: 32 | |
| Day Percent Change: 0.90% Day Change: 0.12 | |
| Week Change: 0.9% Year-to-date Change: -26.5% | |
| XRX Links: Profile News Message Board | |
| Charts:- Daily , Weekly | |
| Add XRX to Watchlist: View: Get Complete XRX Trend Analysis ➞ | |
 | PINC Premier, Inc. |
| Sector: Technology | |
| SubSector: Healthcare Information Services | |
| MarketCap: 2044.85 Millions | |
| Recent Price: 20.72 Smart Investing & Trading Score: 23 | |
| Day Percent Change: 0.90% Day Change: 0.18 | |
| Week Change: 0.9% Year-to-date Change: -7.4% | |
| PINC Links: Profile News Message Board | |
| Charts:- Daily , Weekly | |
| Add PINC to Watchlist: View: Get Complete PINC Trend Analysis ➞ | |
 | HQY HealthEquity, Inc. |
| Sector: Technology | |
| SubSector: Healthcare Information Services | |
| MarketCap: 3369.75 Millions | |
| Recent Price: 79.24 Smart Investing & Trading Score: 25 | |
| Day Percent Change: 0.88% Day Change: 0.69 | |
| Week Change: 0.88% Year-to-date Change: 19.5% | |
| HQY Links: Profile News Message Board | |
| Charts:- Daily , Weekly | |
| Add HQY to Watchlist: View: Get Complete HQY Trend Analysis ➞ | |
 | INST Instructure Holdings, Inc. |
| Sector: Technology | |
| SubSector: Software - Application | |
| MarketCap: 3580 Millions | |
| Recent Price: 19.82 Smart Investing & Trading Score: 64 | |
| Day Percent Change: 0.87% Day Change: 0.17 | |
| Week Change: 0.87% Year-to-date Change: -26.6% | |
| INST Links: Profile News Message Board | |
| Charts:- Daily , Weekly | |
| Add INST to Watchlist: View: Get Complete INST Trend Analysis ➞ | |
 | CCOI Cogent Communications Holdings, Inc. |
| Sector: Technology | |
| SubSector: Diversified Communication Services | |
| MarketCap: 3868.14 Millions | |
| Recent Price: 63.61 Smart Investing & Trading Score: 32 | |
| Day Percent Change: 0.86% Day Change: 0.54 | |
| Week Change: 0.86% Year-to-date Change: -16.4% | |
| CCOI Links: Profile News Message Board | |
| Charts:- Daily , Weekly | |
| Add CCOI to Watchlist: View: Get Complete CCOI Trend Analysis ➞ | |
 | SWI SolarWinds Corporation |
| Sector: Technology | |
| SubSector: Application Software | |
| MarketCap: 4524.62 Millions | |
| Recent Price: 11.80 Smart Investing & Trading Score: 64 | |
| Day Percent Change: 0.85% Day Change: 0.10 | |
| Week Change: 0.85% Year-to-date Change: -5.5% | |
| SWI Links: Profile News Message Board | |
| Charts:- Daily , Weekly | |
| Add SWI to Watchlist: View: Get Complete SWI Trend Analysis ➞ | |
 | KN Knowles Corporation |
| Sector: Technology | |
| SubSector: Communication Equipment | |
| MarketCap: 1231.39 Millions | |
| Recent Price: 16.71 Smart Investing & Trading Score: 100 | |
| Day Percent Change: 0.84% Day Change: 0.14 | |
| Week Change: 0.84% Year-to-date Change: -6.7% | |
| KN Links: Profile News Message Board | |
| Charts:- Daily , Weekly | |
| Add KN to Watchlist: View: Get Complete KN Trend Analysis ➞ | |
 | SYNA Synaptics Incorporated |
| Sector: Technology | |
| SubSector: Application Software | |
| MarketCap: 1822.82 Millions | |
| Recent Price: 91.06 Smart Investing & Trading Score: 59 | |
| Day Percent Change: 0.83% Day Change: 0.75 | |
| Week Change: 0.83% Year-to-date Change: -20.2% | |
| SYNA Links: Profile News Message Board | |
| Charts:- Daily , Weekly | |
| Add SYNA to Watchlist: View: Get Complete SYNA Trend Analysis ➞ | |
 | TUYA Tuya Inc. |
| Sector: Technology | |
| SubSector: Software - Infrastructure | |
| MarketCap: 1050 Millions | |
| Recent Price: 1.84 Smart Investing & Trading Score: 69 | |
| Day Percent Change: 0.82% Day Change: 0.01 | |
| Week Change: 0.82% Year-to-date Change: -20.0% | |
| TUYA Links: Profile News Message Board | |
| Charts:- Daily , Weekly | |
| Add TUYA to Watchlist: View: Get Complete TUYA Trend Analysis ➞ | |
 | MLNK MeridianLink, Inc. |
| Sector: Technology | |
| SubSector: Software - Application | |
| MarketCap: 1630 Millions | |
| Recent Price: 17.37 Smart Investing & Trading Score: 17 | |
| Day Percent Change: 0.81% Day Change: 0.14 | |
| Week Change: 0.81% Year-to-date Change: -29.9% | |
| MLNK Links: Profile News Message Board | |
| Charts:- Daily , Weekly | |
| Add MLNK to Watchlist: View: Get Complete MLNK Trend Analysis ➞ | |
 | MDB MongoDB, Inc. |
| Sector: Technology | |
| SubSector: Application Software | |
| MarketCap: 7591.22 Millions | |
| Recent Price: 365.67 Smart Investing & Trading Score: 32 | |
| Day Percent Change: 0.78% Day Change: 2.82 | |
| Week Change: 0.78% Year-to-date Change: -10.6% | |
| MDB Links: Profile News Message Board | |
| Charts:- Daily , Weekly | |
| Add MDB to Watchlist: View: Get Complete MDB Trend Analysis ➞ | |
 | ENPH Enphase Energy, Inc. |
| Sector: Technology | |
| SubSector: Semiconductor Equipment & Materials | |
| MarketCap: 4047.48 Millions | |
| Recent Price: 115.08 Smart Investing & Trading Score: 15 | |
| Day Percent Change: 0.77% Day Change: 0.88 | |
| Week Change: 0.77% Year-to-date Change: -12.9% | |
| ENPH Links: Profile News Message Board | |
| Charts:- Daily , Weekly | |
| Add ENPH to Watchlist: View: Get Complete ENPH Trend Analysis ➞ | |
 | RUN Sunrun Inc. |
| Sector: Technology | |
| SubSector: Semiconductor - Specialized | |
| MarketCap: 1286.2 Millions | |
| Recent Price: 11.99 Smart Investing & Trading Score: 74 | |
| Day Percent Change: 0.76% Day Change: 0.09 | |
| Week Change: 0.76% Year-to-date Change: -38.9% | |
| RUN Links: Profile News Message Board | |
| Charts:- Daily , Weekly | |
| Add RUN to Watchlist: View: Get Complete RUN Trend Analysis ➞ | |
 | NOVT Novanta Inc. |
| Sector: Technology | |
| SubSector: Scientific & Technical Instruments | |
| MarketCap: 2680.83 Millions | |
| Recent Price: 161.11 Smart Investing & Trading Score: 64 | |
| Day Percent Change: 0.76% Day Change: 1.22 | |
| Week Change: 0.76% Year-to-date Change: -4.3% | |
| NOVT Links: Profile News Message Board | |
| Charts:- Daily , Weekly | |
| Add NOVT to Watchlist: View: Get Complete NOVT Trend Analysis ➞ | |
 | GBTG Global Business Travel Group, Inc. |
| Sector: Technology | |
| SubSector: Software - Application | |
| MarketCap: 3440 Millions | |
| Recent Price: 6.23 Smart Investing & Trading Score: 86 | |
| Day Percent Change: 0.73% Day Change: 0.05 | |
| Week Change: 0.73% Year-to-date Change: -4.6% | |
| GBTG Links: Profile News Message Board | |
| Charts:- Daily , Weekly | |
| Add GBTG to Watchlist: View: Get Complete GBTG Trend Analysis ➞ | |
 | RAMP LiveRamp Holdings, Inc. |
| Sector: Technology | |
| SubSector: Information Technology Services | |
| MarketCap: 2124.38 Millions | |
| Recent Price: 32.79 Smart Investing & Trading Score: 57 | |
| Day Percent Change: 0.71% Day Change: 0.23 | |
| Week Change: 0.71% Year-to-date Change: -13.4% | |
| RAMP Links: Profile News Message Board | |
| Charts:- Daily , Weekly | |
| Add RAMP to Watchlist: View: Get Complete RAMP Trend Analysis ➞ | |
 | MTSI MACOM Technology Solutions Holdings, Inc. |
| Sector: Technology | |
| SubSector: Semiconductor - Broad Line | |
| MarketCap: 1214.42 Millions | |
| Recent Price: 103.56 Smart Investing & Trading Score: 100 | |
| Day Percent Change: 0.69% Day Change: 0.71 | |
| Week Change: 0.69% Year-to-date Change: 11.4% | |
| MTSI Links: Profile News Message Board | |
| Charts:- Daily , Weekly | |
| Add MTSI to Watchlist: View: Get Complete MTSI Trend Analysis ➞ | |
 | NVT nVent Electric plc |
| Sector: Technology | |
| SubSector: Diversified Electronics | |
| MarketCap: 2752.86 Millions | |
| Recent Price: 76.40 Smart Investing & Trading Score: 85 | |
| Day Percent Change: 0.67% Day Change: 0.51 | |
| Week Change: 0.67% Year-to-date Change: 29.3% | |
| NVT Links: Profile News Message Board | |
| Charts:- Daily , Weekly | |
| Add NVT to Watchlist: View: Get Complete NVT Trend Analysis ➞ | |
 | SATS EchoStar Corporation |
| Sector: Technology | |
| SubSector: Communication Equipment | |
| MarketCap: 3175.69 Millions | |
| Recent Price: 17.56 Smart Investing & Trading Score: 95 | |
| Day Percent Change: 0.66% Day Change: 0.11 | |
| Week Change: 0.66% Year-to-date Change: 6.0% | |
| SATS Links: Profile News Message Board | |
| Charts:- Daily , Weekly | |
| Add SATS to Watchlist: View: Get Complete SATS Trend Analysis ➞ | |
 | DBX Dropbox, Inc. |
| Sector: Technology | |
| SubSector: Application Software | |
| MarketCap: 7588.32 Millions | |
| Recent Price: 23.52 Smart Investing & Trading Score: 33 | |
| Day Percent Change: 0.66% Day Change: 0.15 | |
| Week Change: 0.66% Year-to-date Change: -20.2% | |
| DBX Links: Profile News Message Board | |
| Charts:- Daily , Weekly | |
| Add DBX to Watchlist: View: Get Complete DBX Trend Analysis ➞ | |
 | FRSH Freshworks Inc. |
| Sector: Technology | |
| SubSector: Software - Application | |
| MarketCap: 5000 Millions | |
| Recent Price: 14.12 Smart Investing & Trading Score: 41 | |
| Day Percent Change: 0.61% Day Change: 0.09 | |
| Week Change: 0.61% Year-to-date Change: -39.9% | |
| FRSH Links: Profile News Message Board | |
| Charts:- Daily , Weekly | |
| Add FRSH to Watchlist: View: Get Complete FRSH Trend Analysis ➞ | |
 | SRAD Sportradar Group AG |
| Sector: Technology | |
| SubSector: Software - Application | |
| MarketCap: 3900 Millions | |
| Recent Price: 9.29 Smart Investing & Trading Score: 25 | |
| Day Percent Change: 0.60% Day Change: 0.05 | |
| Week Change: 0.6% Year-to-date Change: -16.7% | |
| SRAD Links: Profile News Message Board | |
| Charts:- Daily , Weekly | |
| Add SRAD to Watchlist: View: Get Complete SRAD Trend Analysis ➞ | |
 | INFA Informatica Inc. |
| Sector: Technology | |
| SubSector: Software - Infrastructure | |
| MarketCap: 5340 Millions | |
| Recent Price: 30.02 Smart Investing & Trading Score: 10 | |
| Day Percent Change: 0.59% Day Change: 0.18 | |
| Week Change: 0.59% Year-to-date Change: 5.6% | |
| INFA Links: Profile News Message Board | |
| Charts:- Daily , Weekly | |
| Add INFA to Watchlist: View: Get Complete INFA Trend Analysis ➞ | |
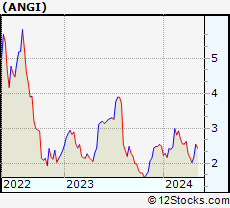 | ANGI ANGI Homeservices Inc. |
| Sector: Technology | |
| SubSector: Internet Software & Services | |
| MarketCap: 2830.61 Millions | |
| Recent Price: 2.56 Smart Investing & Trading Score: 69 | |
| Day Percent Change: 0.59% Day Change: 0.02 | |
| Week Change: 0.59% Year-to-date Change: 2.6% | |
| ANGI Links: Profile News Message Board | |
| Charts:- Daily , Weekly | |
| Add ANGI to Watchlist: View: Get Complete ANGI Trend Analysis ➞ | |
 | ESE ESCO Technologies Inc. |
| Sector: Technology | |
| SubSector: Scientific & Technical Instruments | |
| MarketCap: 1968.03 Millions | |
| Recent Price: 107.90 Smart Investing & Trading Score: 100 | |
| Day Percent Change: 0.58% Day Change: 0.62 | |
| Week Change: 0.58% Year-to-date Change: -7.8% | |
| ESE Links: Profile News Message Board | |
| Charts:- Daily , Weekly | |
| Add ESE to Watchlist: View: Get Complete ESE Trend Analysis ➞ | |
| For tabular summary view of above stock list: Summary View ➞ 0 - 25 , 25 - 50 , 50 - 75 , 75 - 100 , 100 - 125 , 125 - 150 , 150 - 175 , 175 - 200 , 200 - 225 , 225 - 250 | ||
| Click To Change The Sort Order: By Market Cap or Company Size Performance: Year-to-date, Week and Day | |
| Select Chart Type: | ||
|
Best Stocks Today 12Stocks.com |
© 2024 12Stocks.com Terms & Conditions Privacy Contact Us
All Information Provided Only For Education And Not To Be Used For Investing or Trading. See Terms & Conditions


One More Thing ... Get Best Stocks Delivered Daily!
Never Ever Miss A Move With Our Top Ten Stocks Lists
Find Best Stocks In Any Market - Bull or Bear Market
Take A Peek At Our Top Ten Stocks Lists: Daily, Weekly, Year-to-Date & Top Trends
Find Best Stocks In Any Market - Bull or Bear Market
Take A Peek At Our Top Ten Stocks Lists: Daily, Weekly, Year-to-Date & Top Trends
Technology Stocks With Best Up Trends [0-bearish to 100-bullish]: Perficient [100], GigaCloud [100], Universal Electronics[100], Silicon Motion[100], Benchmark Electronics[100], Onto Innovation[100], Arlo [100], Warner Music[100], Red Violet[100], NetApp [100], Jamf Holding[100]
Best Technology Stocks Year-to-Date:
MicroCloud Hologram[498.56%], MediaCo Holding[383.57%], Smith Micro[214.77%], Bakkt [197.53%], CXApp [194.21%], Super Micro[192.28%], Uxin [191.01%], SoundHound AI[142.99%], CuriosityStream [125.88%], GigaCloud [124.6%], MicroStrategy [100.59%] Best Technology Stocks This Week:
Perficient [52.24%], Arteris [32.26%], Upland Software[23.55%], SoundHound AI[19.54%], CXApp [14.07%], GigaCloud [13.95%], Thoughtworks Holding[12%], Universal Electronics[11.94%], SYLA [11.42%], Smith Micro[11.11%], Telephone and[9.33%] Best Technology Stocks Daily:
Perficient [52.24%], Arteris [32.26%], Upland Software[23.55%], SoundHound AI[19.54%], CXApp [14.07%], GigaCloud [13.95%], Thoughtworks Holding[12.00%], Universal Electronics[11.94%], SYLA [11.42%], Smith Micro[11.11%], Telephone and[9.33%]