
 Login Sign Up


| |||||
 |  | ||||

| 12Stocks.com Market Intelligence |
Best Tech Stocks
| In a hurry? Tech Stocks Lists: Performance & Trends, Stock Charts, FANG Stocks
Sort Tech stocks: Daily, Weekly, Year-to-Date, Market Cap & Trends. Filter Tech stocks list by size:All Tech Large Mid-Range Small and MicroCap |
| 12Stocks.com Tech Stocks Performances & Trends Daily | |||||||||
|
|  The overall Smart Investing & Trading Score is 64 (0-bearish to 100-bullish) which puts Technology sector in short term neutral to bullish trend. The Smart Investing & Trading Score from previous trading session is 49 and hence an improvement of trend.
| ||||||||
Here are the Smart Investing & Trading Scores of the most requested Technology stocks at 12Stocks.com (click stock name for detailed review):
|


| 12Stocks.com: Investing in Technology sector with Stocks | |
|
The following table helps investors and traders sort through current performance and trends (as measured by Smart Investing & Trading Score) of various
stocks in the Tech sector. Quick View: Move mouse or cursor over stock symbol (ticker) to view short-term technical chart and over stock name to view long term chart. Click on  to add stock symbol to your watchlist and to add stock symbol to your watchlist and  to view watchlist. Click on any ticker or stock name for detailed market intelligence report for that stock. to view watchlist. Click on any ticker or stock name for detailed market intelligence report for that stock. |
12Stocks.com Performance of Stocks in Tech Sector
| Ticker | Stock Name | Watchlist | Category | Recent Price | Smart Investing & Trading Score | Change % | YTD Change% |
| AVDX | AvidXchange |   | Software - Infrastructure | 12.14 | 64 | 0.12 | -2.22% |
| AMKR | Amkor | | Semiconductor | 32.37 | 83 | 0.09 | -2.71% |
| PRO | PROS | | Software | 32.91 | 25 | 0.06 | -15.16% |
| ALIT | Alight | | Software - | 9.31 | 90 | 0.05 | 9.40% |
| SY | So-Young | | Healthcare Information | 1.29 | 95 | 0.00 | 0.00% |
| YY | JOYY | | Internet | 33.77 | 95 | 0.00 | -14.94% |
| EVBG | Everbridge | | Software | 34.79 | 56 | -0.03 | 43.11% |
| PWSC | PowerSchool | | Software - | 16.60 | 20 | -0.03 | -29.78% |
| AMBA | Ambarella | | Semiconductor | 47.82 | 74 | -0.06 | -21.98% |
| HCP | HashiCorp | | Software - Infrastructure | 32.78 | 76 | -0.09 | 35.90% |
| CRDO | Credo | | Communication | 17.25 | 33 | -0.09 | -11.81% |
| DLB | Dolby | | Electronics | 82.00 | 100 | -0.10 | -4.85% |
| NET | Cloudflare | | Software | 74.30 | 0 | -0.13 | -10.76% |
| JNPR | Juniper Networks | | Communication | 34.78 | 18 | -0.17 | 17.98% |
| LPL | LG Display | | Electronics | 4.25 | 100 | -0.23 | -11.83% |
| COMP | Compass | | Software - | 3.36 | 45 | -0.30 | -9.93% |
| BL | BlackLine | | Software | 60.71 | 90 | -0.33 | -2.77% |
| BILI | Bilibili | | Internet | 14.78 | 88 | -0.34 | 21.45% |
| UMC | United Microelectronics | | Semiconductor | 8.12 | 100 | -0.37 | -4.02% |
| VZIO | VIZIO Holding | | Consumer Electronics | 10.56 | 15 | -0.38 | 36.90% |
| OMCL | Omnicell | | Healthcare Information | 29.98 | 100 | -0.50 | -20.33% |
| SEDG | SolarEdge | | Semiconductor | 60.07 | 57 | -0.63 | -35.82% |
| TXG | 10x Genomics | | Healthcare Information | 27.26 | 42 | -0.80 | -51.29% |
| VEON | VEON | | Telecom | 24.60 | 59 | -0.81 | 24.87% |
| MOMO | Momo | | Internet | 6.13 | 59 | -0.89 | -11.73% |
| For chart view version of above stock list: Chart View ➞ 0 - 25 , 25 - 50 , 50 - 75 , 75 - 100 , 100 - 125 , 125 - 150 , 150 - 175 , 175 - 200 , 200 - 225 , 225 - 250 | ||
 | Click To Change The Sort Order: By Market Cap or Company Size Performance: Year-to-date, Week and Day |  |
|
Get the most comprehensive stock market coverage daily at 12Stocks.com ➞ Best Stocks Today ➞ Best Stocks Weekly ➞ Best Stocks Year-to-Date ➞ Best Stocks Trends ➞  Best Stocks Today 12Stocks.com Best Nasdaq Stocks ➞ Best S&P 500 Stocks ➞ Best Tech Stocks ➞ Best Biotech Stocks ➞ |
| Detailed Overview of Tech Stocks |
| Tech Technical Overview, Leaders & Laggards, Top Tech ETF Funds & Detailed Tech Stocks List, Charts, Trends & More |
| Tech Sector: Technical Analysis, Trends & YTD Performance | |
| Technology sector is composed of stocks
from semiconductors, software, web, social media
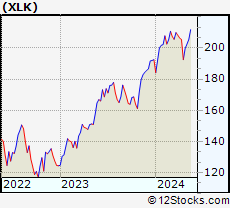
and services subsectors. Technology sector, as represented by XLK, an exchange-traded fund [ETF] that holds basket of tech stocks (e.g, Intel, Google) is up by 6.47% and is currently underperforming the overall market by -1.55% year-to-date. Below is a quick view of technical charts and trends: |
|
 XLK Weekly Chart |
|
| Long Term Trend: Not Good | |
| Medium Term Trend: Very Good | |
 XLK Daily Chart |
|
| Short Term Trend: Very Good | |
| Overall Trend Score: 64 | |
| YTD Performance: 6.47% | |
| **Trend Scores & Views Are Only For Educational Purposes And Not For Investing | |
| 12Stocks.com: Top Performing Technology Sector Stocks | ||||||||||||||||||||||||||||||||||||||||||||||||
 The top performing Technology sector stocks year to date are
Now, more recently, over last week, the top performing Technology sector stocks on the move are


|
||||||||||||||||||||||||||||||||||||||||||||||||
| 12Stocks.com: Investing in Tech Sector using Exchange Traded Funds | |
|
The following table shows list of key exchange traded funds (ETF) that
help investors track Tech Index. For detailed view, check out our ETF Funds section of our website. Quick View: Move mouse or cursor over ETF symbol (ticker) to view short-term technical chart and over ETF name to view long term chart. Click on ticker or stock name for detailed view. Click on to add stock symbol to your watchlist and to view watchlist. |
12Stocks.com List of ETFs that track Tech Index
| Ticker | ETF Name | Watchlist | Recent Price | Smart Investing & Trading Score | Change % | Week % | Year-to-date % |
| XLK | Technology | | 204.93 | 64 | 1.18 | 1.18 | 6.47% |
| QQQ | QQQ | | 440.25 | 77 | 1.10 | 1.1 | 7.5% |
| IYW | Technology | | 134.23 | 77 | 1.56 | 1.56 | 9.35% |
| VGT | Information Technology | | 516.83 | 29 | 1.45 | 1.45 | 6.78% |
| IXN | Global Tech | | 73.87 | 77 | 1.39 | 1.39 | 8.35% |
| IGV | Tech-Software | | 81.99 | 29 | 1.38 | 1.38 | 1.06% |
| XSD | Semiconductor | | 230.00 | 100 | 1.72 | 1.72 | 2.32% |
| TQQQ | QQQ | | 58.56 | 64 | 3.28 | 3.28 | 15.5% |
| SQQQ | Short QQQ | | 10.70 | 0 | -3.43 | -3.43 | -20.45% |
| SOXL | Semicondct Bull 3X | | 41.30 | 64 | 5.98 | 5.98 | 31.53% |
| SOXS | Semicondct Bear 3X | | 33.01 | 31 | -6.01 | -6.01 | 467.18% |
| SOXX | PHLX Semiconductor | | 220.66 | 42 | 2.08 | 2.08 | 14.91% |
| QTEC | First -100-Tech | | 185.08 | 64 | 1.27 | 1.27 | 5.48% |
| SMH | Semiconductor | | 222.67 | 95 | 2.27 | 2.27 | 27.33% |
| 12Stocks.com: Charts, Trends, Fundamental Data and Performances of Tech Stocks | |
|
We now take in-depth look at all Tech stocks including charts, multi-period performances and overall trends (as measured by Smart Investing & Trading Score). One can sort Tech stocks (click link to choose) by Daily, Weekly and by Year-to-Date performances. Also, one can sort by size of the company or by market capitalization. |
| Select Your Default Chart Type: | |||||
| |||||
| Click on stock symbol or name for detailed view. Click on to add stock symbol to your watchlist and to view watchlist. Quick View: Move mouse or cursor over "Daily" to quickly view daily technical stock chart and over "Weekly" to view weekly technical stock chart. | |||||


 | AVDX AvidXchange Holdings, Inc. |
| Sector: Technology | |
| SubSector: Software - Infrastructure | |
| MarketCap: 2120 Millions | |
| Recent Price: 12.14 Smart Investing & Trading Score: 64 | |
| Day Percent Change: 0.12% Day Change: 0.02 | |
| Week Change: 0.12% Year-to-date Change: -2.2% | |
| AVDX Links: Profile News Message Board | |
| Charts:- Daily , Weekly | |
| Add AVDX to Watchlist: View: Get Complete AVDX Trend Analysis ➞ | |
 | AMKR Amkor Technology, Inc. |
| Sector: Technology | |
| SubSector: Semiconductor - Integrated Circuits | |
| MarketCap: 1966.2 Millions | |
| Recent Price: 32.37 Smart Investing & Trading Score: 83 | |
| Day Percent Change: 0.09% Day Change: 0.03 | |
| Week Change: 0.09% Year-to-date Change: -2.7% | |
| AMKR Links: Profile News Message Board | |
| Charts:- Daily , Weekly | |
| Add AMKR to Watchlist: View: Get Complete AMKR Trend Analysis ➞ | |
 | PRO PROS Holdings, Inc. |
| Sector: Technology | |
| SubSector: Application Software | |
| MarketCap: 1357.42 Millions | |
| Recent Price: 32.91 Smart Investing & Trading Score: 25 | |
| Day Percent Change: 0.06% Day Change: 0.02 | |
| Week Change: 0.06% Year-to-date Change: -15.2% | |
| PRO Links: Profile News Message Board | |
| Charts:- Daily , Weekly | |
| Add PRO to Watchlist: View: Get Complete PRO Trend Analysis ➞ | |
 | ALIT Alight, Inc. |
| Sector: Technology | |
| SubSector: Software - Application | |
| MarketCap: 5130 Millions | |
| Recent Price: 9.31 Smart Investing & Trading Score: 90 | |
| Day Percent Change: 0.05% Day Change: 0.01 | |
| Week Change: 0.05% Year-to-date Change: 9.4% | |
| ALIT Links: Profile News Message Board | |
| Charts:- Daily , Weekly | |
| Add ALIT to Watchlist: View: Get Complete ALIT Trend Analysis ➞ | |
 | SY So-Young International Inc. |
| Sector: Technology | |
| SubSector: Healthcare Information Services | |
| MarketCap: 1000.55 Millions | |
| Recent Price: 1.29 Smart Investing & Trading Score: 95 | |
| Day Percent Change: 0.00% Day Change: 0.00 | |
| Week Change: 0% Year-to-date Change: 0.0% | |
| SY Links: Profile News Message Board | |
| Charts:- Daily , Weekly | |
| Add SY to Watchlist: View: Get Complete SY Trend Analysis ➞ | |
 | YY JOYY Inc. |
| Sector: Technology | |
| SubSector: Internet Information Providers | |
| MarketCap: 3527.6 Millions | |
| Recent Price: 33.77 Smart Investing & Trading Score: 95 | |
| Day Percent Change: 0.00% Day Change: 0.00 | |
| Week Change: 0% Year-to-date Change: -14.9% | |
| YY Links: Profile News Message Board | |
| Charts:- Daily , Weekly | |
| Add YY to Watchlist: View: Get Complete YY Trend Analysis ➞ | |
 | EVBG Everbridge, Inc. |
| Sector: Technology | |
| SubSector: Application Software | |
| MarketCap: 3697.92 Millions | |
| Recent Price: 34.79 Smart Investing & Trading Score: 56 | |
| Day Percent Change: -0.03% Day Change: -0.01 | |
| Week Change: -0.03% Year-to-date Change: 43.1% | |
| EVBG Links: Profile News Message Board | |
| Charts:- Daily , Weekly | |
| Add EVBG to Watchlist: View: Get Complete EVBG Trend Analysis ➞ | |
 | PWSC PowerSchool Holdings, Inc. |
| Sector: Technology | |
| SubSector: Software - Application | |
| MarketCap: 3870 Millions | |
| Recent Price: 16.60 Smart Investing & Trading Score: 20 | |
| Day Percent Change: -0.03% Day Change: 0.00 | |
| Week Change: -0.03% Year-to-date Change: -29.8% | |
| PWSC Links: Profile News Message Board | |
| Charts:- Daily , Weekly | |
| Add PWSC to Watchlist: View: Get Complete PWSC Trend Analysis ➞ | |
 | AMBA Ambarella, Inc. |
| Sector: Technology | |
| SubSector: Semiconductor Equipment & Materials | |
| MarketCap: 1509.38 Millions | |
| Recent Price: 47.82 Smart Investing & Trading Score: 74 | |
| Day Percent Change: -0.06% Day Change: -0.03 | |
| Week Change: -0.06% Year-to-date Change: -22.0% | |
| AMBA Links: Profile News Message Board | |
| Charts:- Daily , Weekly | |
| Add AMBA to Watchlist: View: Get Complete AMBA Trend Analysis ➞ | |
 | HCP HashiCorp, Inc. |
| Sector: Technology | |
| SubSector: Software - Infrastructure | |
| MarketCap: 5070 Millions | |
| Recent Price: 32.78 Smart Investing & Trading Score: 76 | |
| Day Percent Change: -0.09% Day Change: -0.03 | |
| Week Change: -0.09% Year-to-date Change: 35.9% | |
| HCP Links: Profile News Message Board | |
| Charts:- Daily , Weekly | |
| Add HCP to Watchlist: View: Get Complete HCP Trend Analysis ➞ | |
 | CRDO Credo Technology Group Holding Ltd |
| Sector: Technology | |
| SubSector: Communication Equipment | |
| MarketCap: 2590 Millions | |
| Recent Price: 17.25 Smart Investing & Trading Score: 33 | |
| Day Percent Change: -0.09% Day Change: -0.02 | |
| Week Change: -0.09% Year-to-date Change: -11.8% | |
| CRDO Links: Profile News Message Board | |
| Charts:- Daily , Weekly | |
| Add CRDO to Watchlist: View: Get Complete CRDO Trend Analysis ➞ | |
 | DLB Dolby Laboratories, Inc. |
| Sector: Technology | |
| SubSector: Diversified Electronics | |
| MarketCap: 5618.16 Millions | |
| Recent Price: 82.00 Smart Investing & Trading Score: 100 | |
| Day Percent Change: -0.10% Day Change: -0.08 | |
| Week Change: -0.1% Year-to-date Change: -4.9% | |
| DLB Links: Profile News Message Board | |
| Charts:- Daily , Weekly | |
| Add DLB to Watchlist: View: Get Complete DLB Trend Analysis ➞ | |
 | NET Cloudflare, Inc. |
| Sector: Technology | |
| SubSector: Application Software | |
| MarketCap: 7063.72 Millions | |
| Recent Price: 74.30 Smart Investing & Trading Score: 0 | |
| Day Percent Change: -0.13% Day Change: -0.10 | |
| Week Change: -0.13% Year-to-date Change: -10.8% | |
| NET Links: Profile News Message Board | |
| Charts:- Daily , Weekly | |
| Add NET to Watchlist: View: Get Complete NET Trend Analysis ➞ | |
 | JNPR Juniper Networks, Inc. |
| Sector: Technology | |
| SubSector: Communication Equipment | |
| MarketCap: 6161.49 Millions | |
| Recent Price: 34.78 Smart Investing & Trading Score: 18 | |
| Day Percent Change: -0.17% Day Change: -0.06 | |
| Week Change: -0.17% Year-to-date Change: 18.0% | |
| JNPR Links: Profile News Message Board | |
| Charts:- Daily , Weekly | |
| Add JNPR to Watchlist: View: Get Complete JNPR Trend Analysis ➞ | |
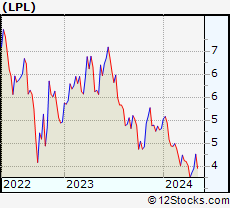 | LPL LG Display Co., Ltd. |
| Sector: Technology | |
| SubSector: Diversified Electronics | |
| MarketCap: 3292.46 Millions | |
| Recent Price: 4.25 Smart Investing & Trading Score: 100 | |
| Day Percent Change: -0.23% Day Change: -0.01 | |
| Week Change: -0.23% Year-to-date Change: -11.8% | |
| LPL Links: Profile News Message Board | |
| Charts:- Daily , Weekly | |
| Add LPL to Watchlist: View: Get Complete LPL Trend Analysis ➞ | |
 | COMP Compass, Inc. |
| Sector: Technology | |
| SubSector: Software - Application | |
| MarketCap: 1580 Millions | |
| Recent Price: 3.36 Smart Investing & Trading Score: 45 | |
| Day Percent Change: -0.30% Day Change: -0.01 | |
| Week Change: -0.3% Year-to-date Change: -9.9% | |
| COMP Links: Profile News Message Board | |
| Charts:- Daily , Weekly | |
| Add COMP to Watchlist: View: Get Complete COMP Trend Analysis ➞ | |
 | BL BlackLine, Inc. |
| Sector: Technology | |
| SubSector: Application Software | |
| MarketCap: 2972.62 Millions | |
| Recent Price: 60.71 Smart Investing & Trading Score: 90 | |
| Day Percent Change: -0.33% Day Change: -0.20 | |
| Week Change: -0.33% Year-to-date Change: -2.8% | |
| BL Links: Profile News Message Board | |
| Charts:- Daily , Weekly | |
| Add BL to Watchlist: View: Get Complete BL Trend Analysis ➞ | |
 | BILI Bilibili Inc. |
| Sector: Technology | |
| SubSector: Internet Information Providers | |
| MarketCap: 7043.1 Millions | |
| Recent Price: 14.78 Smart Investing & Trading Score: 88 | |
| Day Percent Change: -0.34% Day Change: -0.05 | |
| Week Change: -0.34% Year-to-date Change: 21.5% | |
| BILI Links: Profile News Message Board | |
| Charts:- Daily , Weekly | |
| Add BILI to Watchlist: View: Get Complete BILI Trend Analysis ➞ | |
 | UMC United Microelectronics Corporation |
| Sector: Technology | |
| SubSector: Semiconductor Equipment & Materials | |
| MarketCap: 5672.78 Millions | |
| Recent Price: 8.12 Smart Investing & Trading Score: 100 | |
| Day Percent Change: -0.37% Day Change: -0.03 | |
| Week Change: -0.37% Year-to-date Change: -4.0% | |
| UMC Links: Profile News Message Board | |
| Charts:- Daily , Weekly | |
| Add UMC to Watchlist: View: Get Complete UMC Trend Analysis ➞ | |
 | VZIO VIZIO Holding Corp. |
| Sector: Technology | |
| SubSector: Consumer Electronics | |
| MarketCap: 1300 Millions | |
| Recent Price: 10.56 Smart Investing & Trading Score: 15 | |
| Day Percent Change: -0.38% Day Change: -0.04 | |
| Week Change: -0.38% Year-to-date Change: 36.9% | |
| VZIO Links: Profile News Message Board | |
| Charts:- Daily , Weekly | |
| Add VZIO to Watchlist: View: Get Complete VZIO Trend Analysis ➞ | |
 | OMCL Omnicell, Inc. |
| Sector: Technology | |
| SubSector: Healthcare Information Services | |
| MarketCap: 2781.05 Millions | |
| Recent Price: 29.98 Smart Investing & Trading Score: 100 | |
| Day Percent Change: -0.50% Day Change: -0.15 | |
| Week Change: -0.5% Year-to-date Change: -20.3% | |
| OMCL Links: Profile News Message Board | |
| Charts:- Daily , Weekly | |
| Add OMCL to Watchlist: View: Get Complete OMCL Trend Analysis ➞ | |
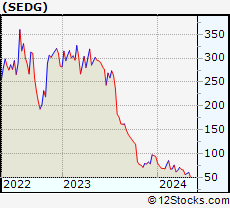 | SEDG SolarEdge Technologies, Inc. |
| Sector: Technology | |
| SubSector: Semiconductor - Specialized | |
| MarketCap: 4008.8 Millions | |
| Recent Price: 60.07 Smart Investing & Trading Score: 57 | |
| Day Percent Change: -0.63% Day Change: -0.38 | |
| Week Change: -0.63% Year-to-date Change: -35.8% | |
| SEDG Links: Profile News Message Board | |
| Charts:- Daily , Weekly | |
| Add SEDG to Watchlist: View: Get Complete SEDG Trend Analysis ➞ | |
 | TXG 10x Genomics, Inc. |
| Sector: Technology | |
| SubSector: Healthcare Information Services | |
| MarketCap: 5490.45 Millions | |
| Recent Price: 27.26 Smart Investing & Trading Score: 42 | |
| Day Percent Change: -0.80% Day Change: -0.22 | |
| Week Change: -0.8% Year-to-date Change: -51.3% | |
| TXG Links: Profile News Message Board | |
| Charts:- Daily , Weekly | |
| Add TXG to Watchlist: View: Get Complete TXG Trend Analysis ➞ | |
 | VEON VEON Ltd. |
| Sector: Technology | |
| SubSector: Telecom Services - Foreign | |
| MarketCap: 2497.89 Millions | |
| Recent Price: 24.60 Smart Investing & Trading Score: 59 | |
| Day Percent Change: -0.81% Day Change: -0.20 | |
| Week Change: -0.81% Year-to-date Change: 24.9% | |
| VEON Links: Profile News Message Board | |
| Charts:- Daily , Weekly | |
| Add VEON to Watchlist: View: Get Complete VEON Trend Analysis ➞ | |
 | MOMO Momo Inc. |
| Sector: Technology | |
| SubSector: Internet Software & Services | |
| MarketCap: 4796.71 Millions | |
| Recent Price: 6.13 Smart Investing & Trading Score: 59 | |
| Day Percent Change: -0.89% Day Change: -0.06 | |
| Week Change: -0.89% Year-to-date Change: -11.7% | |
| MOMO Links: Profile News Message Board | |
| Charts:- Daily , Weekly | |
| Add MOMO to Watchlist: View: Get Complete MOMO Trend Analysis ➞ | |
| For tabular summary view of above stock list: Summary View ➞ 0 - 25 , 25 - 50 , 50 - 75 , 75 - 100 , 100 - 125 , 125 - 150 , 150 - 175 , 175 - 200 , 200 - 225 , 225 - 250 | ||
| Click To Change The Sort Order: By Market Cap or Company Size Performance: Year-to-date, Week and Day | |
| Select Chart Type: | ||
|
Best Stocks Today 12Stocks.com |
© 2024 12Stocks.com Terms & Conditions Privacy Contact Us
All Information Provided Only For Education And Not To Be Used For Investing or Trading. See Terms & Conditions


One More Thing ... Get Best Stocks Delivered Daily!
Never Ever Miss A Move With Our Top Ten Stocks Lists
Find Best Stocks In Any Market - Bull or Bear Market
Take A Peek At Our Top Ten Stocks Lists: Daily, Weekly, Year-to-Date & Top Trends
Find Best Stocks In Any Market - Bull or Bear Market
Take A Peek At Our Top Ten Stocks Lists: Daily, Weekly, Year-to-Date & Top Trends
Technology Stocks With Best Up Trends [0-bearish to 100-bullish]: Perficient [100], GigaCloud [100], Universal Electronics[100], Silicon Motion[100], Benchmark Electronics[100], Onto Innovation[100], Arlo [100], Ceragon Networks[100], Warner Music[100], Red Violet[100], NetApp [100]
Best Technology Stocks Year-to-Date:
MicroCloud Hologram[498.56%], MediaCo Holding[383.57%], Smith Micro[209.93%], Bakkt [197.53%], CXApp [194.21%], Super Micro[192.11%], Uxin [191.01%], SoundHound AI[142.99%], CuriosityStream [125.88%], GigaCloud [124.6%], MicroStrategy [100.88%] Best Technology Stocks This Week:
Perficient [52.28%], Arteris [32.26%], Upland Software[23.17%], SoundHound AI[19.54%], CXApp [14.07%], GigaCloud [13.95%], Thoughtworks Holding[12%], Universal Electronics[11.94%], SYLA [11.42%], Smith Micro[9.4%], Telephone and[9.33%] Best Technology Stocks Daily:
Perficient [52.28%], Arteris [32.26%], Upland Software[23.17%], SoundHound AI[19.54%], CXApp [14.07%], GigaCloud [13.95%], Thoughtworks Holding[12.00%], Universal Electronics[11.94%], SYLA [11.42%], Smith Micro[9.40%], Telephone and[9.33%]