
 Login Sign Up


| |||||
 |  | ||||

| 12Stocks.com Market Intelligence |
Best Tech Stocks
| In a hurry? Tech Stocks Lists: Performance & Trends, Stock Charts, FANG Stocks
Sort Tech stocks: Daily, Weekly, Year-to-Date, Market Cap & Trends. Filter Tech stocks list by size:All Tech Large Mid-Range Small and MicroCap |
| 12Stocks.com Tech Stocks Performances & Trends Daily | |||||||||
|
|  The overall Smart Investing & Trading Score is 100 (0-bearish to 100-bullish) which puts Technology sector in short term bullish trend. The Smart Investing & Trading Score from previous trading session is 90 and an improvement of trend continues.
| ||||||||
Here are the Smart Investing & Trading Scores of the most requested Technology stocks at 12Stocks.com (click stock name for detailed review):
|


| 12Stocks.com: Investing in Technology sector with Stocks | |
|
The following table helps investors and traders sort through current performance and trends (as measured by Smart Investing & Trading Score) of various
stocks in the Tech sector. Quick View: Move mouse or cursor over stock symbol (ticker) to view short-term technical chart and over stock name to view long term chart. Click on  to add stock symbol to your watchlist and to add stock symbol to your watchlist and  to view watchlist. Click on any ticker or stock name for detailed market intelligence report for that stock. to view watchlist. Click on any ticker or stock name for detailed market intelligence report for that stock. |
12Stocks.com Performance of Stocks in Tech Sector
| Ticker | Stock Name | Watchlist | Category | Recent Price | Smart Investing & Trading Score | Change % | YTD Change% |
| RESN | Resonant |   | Semiconductor | 23.15 | 100 | 416.74 | 0.00% |
| TWER | Towerstream | | Communication | 0.15 | 60 | 50.00 | 0.00% |
| EBON | Ebang | | Computer Hardware | 5.33 | 100 | 15.87 | -16.20% |
| UAVS | AgEagle Aerial | | Computer Hardware | 2.49 | 90 | 14.75 | -26.76% |
| CNTF | China Techfaith | | Networking | 7.59 | 30 | 13.28 | 0.00% |
| XGTI | xG | | Wireless | 7.59 | 30 | 13.28 | 0.00% |
| QH | Quhuo | | Software - | 9.05 | 90 | 11.73 | 511.49% |
| BDR | Blonder Tongue | | Communication | 0.21 | 60 | 11.68 | 0.00% |
| VLTC | Voltari | | Communication | 0.10 | 0 | 11.11 | 0.00% |
| LEDS | Semileds Corp | | Semiconductors | 2.40 | 100 | 10.09 | 79.78% |
| VVPR | VivoPower | | Solar | 5.62 | 90 | 9.55 | 298.58% |
| MOSY | MoSys | | Semiconductor | 202.80 | 80 | 9.50 | 0.00% |
| PXLW | Pixelworks | | Semiconductors | 11.98 | 100 | 9.31 | 33.11% |
| BBGI | Beasley Broadcast | | Broadcasting | 5.69 | 80 | 8.80 | -39.95% |
| CXAI | CXApp | | Software - | 0.80 | 80 | 7.42 | -60.02% |
| VISL | Vislink | | Communication | 2.48 | 90 | 7.36 | -35.08% |
| FTFT | Future FinTech | | Software - | 2.23 | 70 | 7.21 | -28.64% |
| IZEA | IZEA Worldwide | | Internet Content & Information | 3.88 | 80 | 7.18 | 48.66% |
| MOGO | Mogo | | Software - Infrastructure | 2.00 | 100 | 6.95 | 50.38% |
| SONM | Sonim | | Communication | 0.65 | 50 | 6.93 | -81.02% |
| QBAK | Qualstar | | Electronics | 8.00 | 100 | 6.67 | 95.12% |
| NOTE | FiscalNote | | IT | 4.97 | 100 | 6.20 | 377.89% |
| KONE | Kingtone Wirelessinfo | | Software | 0.40 | 60 | 5.33 | 0.00% |
| MAXN | Maxeon Solar | | Solar | 3.77 | 50 | 5.31 | -55.59% |
| SMSI | Smith Micro | | Software - | 0.77 | 90 | 5.30 | -46.85% |
| For chart view version of above stock list: Chart View ➞ 0 - 25 , 25 - 50 , 50 - 75 , 75 - 100 , 100 - 125 , 125 - 150 , 150 - 175 , 175 - 200 | ||
 | Click To Change The Sort Order: By Market Cap or Company Size Performance: Year-to-date, Week and Day |  |
|
Get the most comprehensive stock market coverage daily at 12Stocks.com ➞ Best Stocks Today ➞ Best Stocks Weekly ➞ Best Stocks Year-to-Date ➞ Best Stocks Trends ➞  Best Stocks Today 12Stocks.com Best Nasdaq Stocks ➞ Best S&P 500 Stocks ➞ Best Tech Stocks ➞ Best Biotech Stocks ➞ |
| Detailed Overview of Tech Stocks |
| Tech Technical Overview, Leaders & Laggards, Top Tech ETF Funds & Detailed Tech Stocks List, Charts, Trends & More |
| Tech Sector: Technical Analysis, Trends & YTD Performance | |
| Technology sector is composed of stocks
from semiconductors, software, web, social media
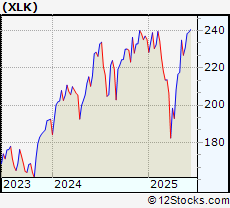
and services subsectors. Technology sector, as represented by XLK, an exchange-traded fund [ETF] that holds basket of tech stocks (e.g, Intel, Google) is up by 23.7823% and is currently outperforming the overall market by 9.0244% year-to-date. Below is a quick view of technical charts and trends: |
|
 XLK Weekly Chart |
|
| Long Term Trend: Very Good | |
| Medium Term Trend: Good | |
 XLK Daily Chart |
|
| Short Term Trend: Very Good | |
| Overall Trend Score: 100 | |
| YTD Performance: 23.7823% | |
| **Trend Scores & Views Are Only For Educational Purposes And Not For Investing | |
| 12Stocks.com: Top Performing Technology Sector Stocks | ||||||||||||||||||||||||||||||||||||||||||||||||
 The top performing Technology sector stocks year to date are
Now, more recently, over last week, the top performing Technology sector stocks on the move are


|
||||||||||||||||||||||||||||||||||||||||||||||||
| 12Stocks.com: Investing in Tech Sector using Exchange Traded Funds | |
|
The following table shows list of key exchange traded funds (ETF) that
help investors track Tech Index. For detailed view, check out our ETF Funds section of our website. Quick View: Move mouse or cursor over ETF symbol (ticker) to view short-term technical chart and over ETF name to view long term chart. Click on ticker or stock name for detailed view. Click on to add stock symbol to your watchlist and to view watchlist. |
12Stocks.com List of ETFs that track Tech Index
| Ticker | ETF Name | Watchlist | Recent Price | Smart Investing & Trading Score | Change % | Week % | Year-to-date % |
| IGN | Tech-Multimd Ntwk | | 53.86 | 40 | 0.918119 | -20.6435 | 0% |
| 12Stocks.com: Charts, Trends, Fundamental Data and Performances of Tech Stocks | |
|
We now take in-depth look at all Tech stocks including charts, multi-period performances and overall trends (as measured by Smart Investing & Trading Score). One can sort Tech stocks (click link to choose) by Daily, Weekly and by Year-to-Date performances. Also, one can sort by size of the company or by market capitalization. |
| Select Your Default Chart Type: | |||||
| |||||
| Click on stock symbol or name for detailed view. Click on to add stock symbol to your watchlist and to view watchlist. Quick View: Move mouse or cursor over "Daily" to quickly view daily technical stock chart and over "Weekly" to view weekly technical stock chart. | |||||


 | RESN Resonant Inc. |
| Sector: Technology | |
| SubSector: Semiconductor - Integrated Circuits | |
| MarketCap: 64.951 Millions | |
| Recent Price: 23.15 Smart Investing & Trading Score: 100 | |
| Day Percent Change: 416.741% Day Change: -9999 | |
| Week Change: 416.741% Year-to-date Change: 0.0% | |
| RESN Links: Profile News Message Board | |
| Charts:- Daily , Weekly | |
| Add RESN to Watchlist: View: Get Complete RESN Trend Analysis ➞ | |
 | TWER Towerstream Corporation |
| Sector: Technology | |
| SubSector: Diversified Communication Services | |
| MarketCap: 2.93 Millions | |
| Recent Price: 0.15 Smart Investing & Trading Score: 60 | |
| Day Percent Change: 50% Day Change: -9999 | |
| Week Change: 0% Year-to-date Change: 0.0% | |
| TWER Links: Profile News Message Board | |
| Charts:- Daily , Weekly | |
| Add TWER to Watchlist: View: Get Complete TWER Trend Analysis ➞ | |
 | EBON Ebang International Holdings Inc |
| Sector: Technology | |
| SubSector: Computer Hardware | |
| MarketCap: 25.39 Millions | |
| Recent Price: 5.33 Smart Investing & Trading Score: 100 | |
| Day Percent Change: 15.8696% Day Change: 0.03 | |
| Week Change: 11.5063% Year-to-date Change: -16.2% | |
| EBON Links: Profile News Message Board | |
| Charts:- Daily , Weekly | |
| Add EBON to Watchlist: View: Get Complete EBON Trend Analysis ➞ | |
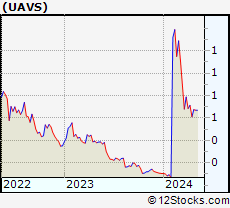 | UAVS AgEagle Aerial Systems Inc |
| Sector: Technology | |
| SubSector: Computer Hardware | |
| MarketCap: 62.96 Millions | |
| Recent Price: 2.49 Smart Investing & Trading Score: 90 | |
| Day Percent Change: 14.7465% Day Change: 0.1 | |
| Week Change: 16.3551% Year-to-date Change: -26.8% | |
| UAVS Links: Profile News Message Board | |
| Charts:- Daily , Weekly | |
| Add UAVS to Watchlist: View: Get Complete UAVS Trend Analysis ➞ | |
 | CNTF China Techfaith Wireless Communication Technology Limited |
| Sector: Technology | |
| SubSector: Networking & Communication Devices | |
| MarketCap: 14.99 Millions | |
| Recent Price: 7.59 Smart Investing & Trading Score: 30 | |
| Day Percent Change: 13.2836% Day Change: -9999 | |
| Week Change: -62.666% Year-to-date Change: 0.0% | |
| CNTF Links: Profile News Message Board | |
| Charts:- Daily , Weekly | |
| Add CNTF to Watchlist: View: Get Complete CNTF Trend Analysis ➞ | |
 | XGTI xG Technology, Inc. |
| Sector: Technology | |
| SubSector: Wireless Communications | |
| MarketCap: 15.05 Millions | |
| Recent Price: 7.59 Smart Investing & Trading Score: 30 | |
| Day Percent Change: 13.2836% Day Change: -9999 | |
| Week Change: -62.666% Year-to-date Change: 0.0% | |
| XGTI Links: Profile News Message Board | |
| Charts:- Daily , Weekly | |
| Add XGTI to Watchlist: View: Get Complete XGTI Trend Analysis ➞ | |
 | QH Quhuo Ltd ADR |
| Sector: Technology | |
| SubSector: Software - Application | |
| MarketCap: 5.35 Millions | |
| Recent Price: 9.05 Smart Investing & Trading Score: 90 | |
| Day Percent Change: 11.7284% Day Change: -0.04 | |
| Week Change: 43.7649% Year-to-date Change: 511.5% | |
| QH Links: Profile News Message Board | |
| Charts:- Daily , Weekly | |
| Add QH to Watchlist: View: Get Complete QH Trend Analysis ➞ | |
 | BDR Blonder Tongue Laboratories, Inc. |
| Sector: Technology | |
| SubSector: Communication Equipment | |
| MarketCap: 7.73539 Millions | |
| Recent Price: 0.21 Smart Investing & Trading Score: 60 | |
| Day Percent Change: 11.6757% Day Change: -9999 | |
| Week Change: 3.3% Year-to-date Change: 0.0% | |
| BDR Links: Profile News Message Board | |
| Charts:- Daily , Weekly | |
| Add BDR to Watchlist: View: Get Complete BDR Trend Analysis ➞ | |
 | VLTC Voltari Corporation |
| Sector: Technology | |
| SubSector: Diversified Communication Services | |
| MarketCap: 11.78 Millions | |
| Recent Price: 0.10 Smart Investing & Trading Score: 0 | |
| Day Percent Change: 11.1111% Day Change: -9999 | |
| Week Change: -99.5081% Year-to-date Change: 0.0% | |
| VLTC Links: Profile News Message Board | |
| Charts:- Daily , Weekly | |
| Add VLTC to Watchlist: View: Get Complete VLTC Trend Analysis ➞ | |
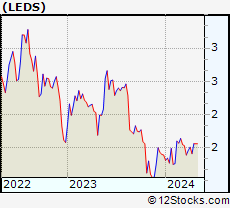 | LEDS Semileds Corp |
| Sector: Technology | |
| SubSector: Semiconductors | |
| MarketCap: 13.98 Millions | |
| Recent Price: 2.40 Smart Investing & Trading Score: 100 | |
| Day Percent Change: 10.0917% Day Change: 0.09 | |
| Week Change: 12.1495% Year-to-date Change: 79.8% | |
| LEDS Links: Profile News Message Board | |
| Charts:- Daily , Weekly | |
| Add LEDS to Watchlist: View: Get Complete LEDS Trend Analysis ➞ | |
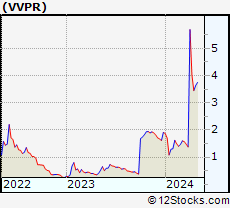 | VVPR VivoPower International PLC |
| Sector: Technology | |
| SubSector: Solar | |
| MarketCap: 48.49 Millions | |
| Recent Price: 5.62 Smart Investing & Trading Score: 90 | |
| Day Percent Change: 9.55166% Day Change: -0.06 | |
| Week Change: 11.2871% Year-to-date Change: 298.6% | |
| VVPR Links: Profile News Message Board | |
| Charts:- Daily , Weekly | |
| Add VVPR to Watchlist: View: Get Complete VVPR Trend Analysis ➞ | |
 | MOSY MoSys, Inc. |
| Sector: Technology | |
| SubSector: Semiconductor - Integrated Circuits | |
| MarketCap: 2.4751 Millions | |
| Recent Price: 202.80 Smart Investing & Trading Score: 80 | |
| Day Percent Change: 9.50324% Day Change: -9999 | |
| Week Change: 20.1422% Year-to-date Change: 0.0% | |
| MOSY Links: Profile News Message Board | |
| Charts:- Daily , Weekly | |
| Add MOSY to Watchlist: View: Get Complete MOSY Trend Analysis ➞ | |
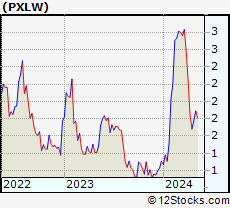 | PXLW Pixelworks Inc |
| Sector: Technology | |
| SubSector: Semiconductors | |
| MarketCap: 46.2 Millions | |
| Recent Price: 11.98 Smart Investing & Trading Score: 100 | |
| Day Percent Change: 9.30657% Day Change: -0.29 | |
| Week Change: 20.5231% Year-to-date Change: 33.1% | |
| PXLW Links: Profile News Message Board | |
| Charts:- Daily , Weekly | |
| Add PXLW to Watchlist: View: Get Complete PXLW Trend Analysis ➞ | |
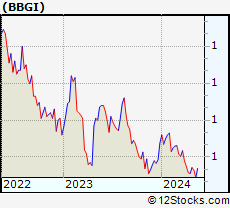 | BBGI Beasley Broadcast Group Inc |
| Sector: Technology | |
| SubSector: Broadcasting | |
| MarketCap: 8.48 Millions | |
| Recent Price: 5.69 Smart Investing & Trading Score: 80 | |
| Day Percent Change: 8.79541% Day Change: 0.05 | |
| Week Change: -16.3235% Year-to-date Change: -39.9% | |
| BBGI Links: Profile News Message Board | |
| Charts:- Daily , Weekly | |
| Add BBGI to Watchlist: View: Get Complete BBGI Trend Analysis ➞ | |
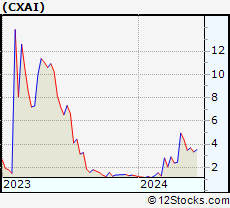 | CXAI CXApp Inc |
| Sector: Technology | |
| SubSector: Software - Application | |
| MarketCap: 17.16 Millions | |
| Recent Price: 0.80 Smart Investing & Trading Score: 80 | |
| Day Percent Change: 7.41537% Day Change: 0 | |
| Week Change: 5.15518% Year-to-date Change: -60.0% | |
| CXAI Links: Profile News Message Board | |
| Charts:- Daily , Weekly | |
| Add CXAI to Watchlist: View: Get Complete CXAI Trend Analysis ➞ | |
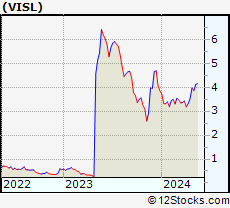 | VISL Vislink Technologies, Inc. |
| Sector: Technology | |
| SubSector: Communication Equipment | |
| MarketCap: 8.43539 Millions | |
| Recent Price: 2.48 Smart Investing & Trading Score: 90 | |
| Day Percent Change: 7.35931% Day Change: -9999 | |
| Week Change: 9.73451% Year-to-date Change: -35.1% | |
| VISL Links: Profile News Message Board | |
| Charts:- Daily , Weekly | |
| Add VISL to Watchlist: View: Get Complete VISL Trend Analysis ➞ | |
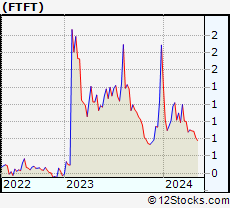 | FTFT Future FinTech Group Inc |
| Sector: Technology | |
| SubSector: Software - Application | |
| MarketCap: 7.73 Millions | |
| Recent Price: 2.23 Smart Investing & Trading Score: 70 | |
| Day Percent Change: 7.21154% Day Change: 0.17 | |
| Week Change: 4.20561% Year-to-date Change: -28.6% | |
| FTFT Links: Profile News Message Board | |
| Charts:- Daily , Weekly | |
| Add FTFT to Watchlist: View: Get Complete FTFT Trend Analysis ➞ | |
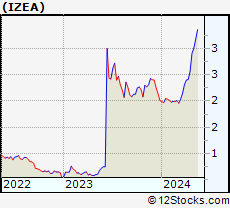 | IZEA IZEA Worldwide Inc |
| Sector: Technology | |
| SubSector: Internet Content & Information | |
| MarketCap: 60.72 Millions | |
| Recent Price: 3.88 Smart Investing & Trading Score: 80 | |
| Day Percent Change: 7.18232% Day Change: 0.09 | |
| Week Change: 2.37467% Year-to-date Change: 48.7% | |
| IZEA Links: Profile News Message Board | |
| Charts:- Daily , Weekly | |
| Add IZEA to Watchlist: View: Get Complete IZEA Trend Analysis ➞ | |
 | MOGO Mogo Inc |
| Sector: Technology | |
| SubSector: Software - Infrastructure | |
| MarketCap: 43.83 Millions | |
| Recent Price: 2.00 Smart Investing & Trading Score: 100 | |
| Day Percent Change: 6.95187% Day Change: -0.03 | |
| Week Change: 6.38298% Year-to-date Change: 50.4% | |
| MOGO Links: Profile News Message Board | |
| Charts:- Daily , Weekly | |
| Add MOGO to Watchlist: View: Get Complete MOGO Trend Analysis ➞ | |
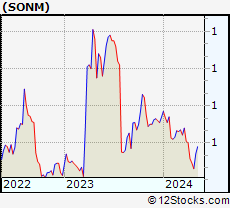 | SONM Sonim Technologies Inc |
| Sector: Technology | |
| SubSector: Communication Equipment | |
| MarketCap: 10.11 Millions | |
| Recent Price: 0.65 Smart Investing & Trading Score: 50 | |
| Day Percent Change: 6.92841% Day Change: 0.02 | |
| Week Change: -0.475971% Year-to-date Change: -81.0% | |
| SONM Links: Profile News Message Board | |
| Charts:- Daily , Weekly | |
| Add SONM to Watchlist: View: Get Complete SONM Trend Analysis ➞ | |
 | QBAK Qualstar Corporation |
| Sector: Technology | |
| SubSector: Diversified Electronics | |
| MarketCap: 4.27396 Millions | |
| Recent Price: 8.00 Smart Investing & Trading Score: 100 | |
| Day Percent Change: 6.66667% Day Change: -9999 | |
| Week Change: 14.2857% Year-to-date Change: 95.1% | |
| QBAK Links: Profile News Message Board | |
| Charts:- Daily , Weekly | |
| Add QBAK to Watchlist: View: Get Complete QBAK Trend Analysis ➞ | |
 | NOTE FiscalNote Holdings Inc |
| Sector: Technology | |
| SubSector: Information Technology Services | |
| MarketCap: 58.75 Millions | |
| Recent Price: 4.97 Smart Investing & Trading Score: 100 | |
| Day Percent Change: 6.19658% Day Change: 0.01 | |
| Week Change: 1.63599% Year-to-date Change: 377.9% | |
| NOTE Links: Profile News Message Board | |
| Charts:- Daily , Weekly | |
| Add NOTE to Watchlist: View: Get Complete NOTE Trend Analysis ➞ | |
 | KONE Kingtone Wirelessinfo Solution Holding Ltd |
| Sector: Technology | |
| SubSector: Business Software & Services | |
| MarketCap: 4.64 Millions | |
| Recent Price: 0.40 Smart Investing & Trading Score: 60 | |
| Day Percent Change: 5.33333% Day Change: -9999 | |
| Week Change: 11.2676% Year-to-date Change: 0.0% | |
| KONE Links: Profile News Message Board | |
| Charts:- Daily , Weekly | |
| Add KONE to Watchlist: View: Get Complete KONE Trend Analysis ➞ | |
 | MAXN Maxeon Solar Technologies Ltd |
| Sector: Technology | |
| SubSector: Solar | |
| MarketCap: 66.91 Millions | |
| Recent Price: 3.77 Smart Investing & Trading Score: 50 | |
| Day Percent Change: 5.30726% Day Change: 0.03 | |
| Week Change: -1.04987% Year-to-date Change: -55.6% | |
| MAXN Links: Profile News Message Board | |
| Charts:- Daily , Weekly | |
| Add MAXN to Watchlist: View: Get Complete MAXN Trend Analysis ➞ | |
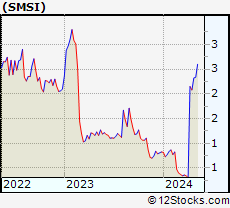 | SMSI Smith Micro Software, Inc |
| Sector: Technology | |
| SubSector: Software - Application | |
| MarketCap: 15.53 Millions | |
| Recent Price: 0.77 Smart Investing & Trading Score: 90 | |
| Day Percent Change: 5.30127% Day Change: -0.01 | |
| Week Change: 2.22841% Year-to-date Change: -46.8% | |
| SMSI Links: Profile News Message Board | |
| Charts:- Daily , Weekly | |
| Add SMSI to Watchlist: View: Get Complete SMSI Trend Analysis ➞ | |
| For tabular summary view of above stock list: Summary View ➞ 0 - 25 , 25 - 50 , 50 - 75 , 75 - 100 , 100 - 125 , 125 - 150 , 150 - 175 , 175 - 200 | ||
| Click To Change The Sort Order: By Market Cap or Company Size Performance: Year-to-date, Week and Day | |
| Select Chart Type: | ||
|
Best Stocks Today 12Stocks.com |
© 2025 12Stocks.com Terms & Conditions Privacy Contact Us
All Information Provided Only For Education And Not To Be Used For Investing or Trading. See Terms & Conditions


One More Thing ... Get Best Stocks Delivered Daily!
Never Ever Miss A Move With Our Top Ten Stocks Lists
Find Best Stocks In Any Market - Bull or Bear Market
Take A Peek At Our Top Ten Stocks Lists: Daily, Weekly, Year-to-Date & Top Trends
Find Best Stocks In Any Market - Bull or Bear Market
Take A Peek At Our Top Ten Stocks Lists: Daily, Weekly, Year-to-Date & Top Trends
Technology Stocks With Best Up Trends [0-bearish to 100-bullish]: Sony [100], Bakkt [100], Rigetti Computing[100], Fair Isaac[100], Arqit Quantum[100], D-Wave Quantum[100], Navitas Semiconductor[100], Shoals [100], Vuzix [100], Arteris [100], Lantronix [100]
Best Technology Stocks Year-to-Date:
Xunlei [370.476%], Sify [315.033%], Wolfspeed [307.01%], Digital Turbine[265.057%], EchoStar Corp[247.253%], CuriosityStream [241.605%], Viasat [224.029%], Pagaya [222.638%], Oneconnect Financial[209.053%], D-Wave Quantum[203.954%], CommScope Holding[203.101%] Best Technology Stocks This Week:
GTT [443626%], Barracuda Networks[71050%], Mobile TeleSystems[10483.5%], Nam Tai[5033.33%], Ebix [4200.85%], Fang [4150%], NantHealth [3114.02%], Hemisphere Media[2981.82%], Yandex N.V[2935.27%], Wolfspeed [1961.98%], Castlight Health[1751.96%] Best Technology Stocks Daily:
Sony [194.565%], Bakkt [28.6091%], Rigetti Computing[18.4925%], Fair Isaac[17.979%], Arqit Quantum[17.9369%], Marti [17%], Latch [16.6667%], Oclaro [14.734%], D-Wave Quantum[13.968%], Arbe Robotics[13.0178%], Navitas Semiconductor[12.3288%]