
 Login Sign Up


| |||||
 |  | ||||

| 12Stocks.com Market Intelligence |
Best Tech Stocks
| In a hurry? Tech Stocks Lists: Performance & Trends, Stock Charts, FANG Stocks
Sort Tech stocks: Daily, Weekly, Year-to-Date, Market Cap & Trends. Filter Tech stocks list by size:All Tech Large Mid-Range Small and MicroCap |
| 12Stocks.com Tech Stocks Performances & Trends Daily | |||||||||
|
|  The overall Smart Investing & Trading Score is 100 (0-bearish to 100-bullish) which puts Technology sector in short term bullish trend. The Smart Investing & Trading Score from previous trading session is 90 and an improvement of trend continues.
| ||||||||
Here are the Smart Investing & Trading Scores of the most requested Technology stocks at 12Stocks.com (click stock name for detailed review):
|


| 12Stocks.com: Investing in Technology sector with Stocks | |
|
The following table helps investors and traders sort through current performance and trends (as measured by Smart Investing & Trading Score) of various
stocks in the Tech sector. Quick View: Move mouse or cursor over stock symbol (ticker) to view short-term technical chart and over stock name to view long term chart. Click on  to add stock symbol to your watchlist and to add stock symbol to your watchlist and  to view watchlist. Click on any ticker or stock name for detailed market intelligence report for that stock. to view watchlist. Click on any ticker or stock name for detailed market intelligence report for that stock. |
12Stocks.com Performance of Stocks in Tech Sector
| Ticker | Stock Name | Watchlist | Category | Recent Price | Smart Investing & Trading Score | Change % | YTD Change% |
| PLTK | Playtika Holding |   | Electronic Gaming & Multimedia | 3.85 | 40 | -1.91% | -41.63% |
| ASGN | ASGN | | IT | 47.90 | 50 | -0.77% | -42.19% |
| SPSC | SPS Commerce | | Software - | 104.54 | 30 | 1.13% | -42.81% |
| FIVN | Five9 | | Software - Infrastructure | 23.01 | 10 | -2.75% | -43.10% |
| PUBM | PubMatic | | Software - | 8.28 | 40 | 0.24% | -44.17% |
| CCOI | Cogent | | Telecom | 40.39 | 80 | 3.30% | -45.65% |
| CRTO | Criteo S.A | | Advertising Agencies | 21.31 | 0 | -3.92% | -45.82% |
| MLAB | Mesa | | Instruments | 71.23 | 70 | 1.08% | -45.88% |
| TEO | Telecom Argentina | | Telecom | 7.45 | 70 | 2.34% | -46.01% |
| ALTS | ALT5 Sigma | | Software - | 2.78 | 30 | 5.70% | -46.02% |
| HKD | AMTD Digital | | Software - | 1.83 | 26 | 0.00% | -46.28% |
| PAR | Par | | Software - | 38.17 | 10 | 1.30% | -46.62% |
| IT | Gartner | | IT | 257.23 | 20 | 2.48% | -46.78% |
| ENPH | Enphase Energy | | Solar | 37.74 | 90 | 1.97% | -47.11% |
| AI | C3.ai | | Software - Infrastructure | 18.24 | 70 | 4.23% | -47.39% |
| EXFY | Expensify | | Software - | 1.76 | 48 | 1.75% | -48.06% |
| MDRX | Allscripts Healthcare | | Software | 4.70 | 80 | 0.00% | -48.35% |
| SABR | Sabre Corp | | Software - Infrastructure | 1.84 | 30 | -1.08% | -48.46% |
| TRUE | Truecar | | Internet Content & Information | 1.79 | 20 | 4.97% | -48.71% |
| MYPS | PLAYSTUDIOS | | Electronic Gaming & Multimedia | 0.94 | 20 | -0.77% | -50.12% |
| WPP | WPP . | | Advertising Agencies | 24.28 | 30 | -2.18% | -50.53% |
| ALIT | Alight | | Software - | 3.21 | 20 | 0.63% | -51.81% |
| CRNT | Ceragon Networks | | Communication | 2.33 | 70 | 2.19% | -52.06% |
| TZOO | Travelzoo | | Internet Content & Information | 9.85 | 20 | -0.10% | -52.32% |
| RPD | Rapid7 | | Software - Infrastructure | 18.64 | 10 | 0.00% | -52.67% |
| For chart view version of above stock list: Chart View ➞ 0 - 25 , 25 - 50 , 50 - 75 , 75 - 100 , 100 - 125 , 125 - 150 , 150 - 175 , 175 - 200 , 200 - 225 , 225 - 250 , 250 - 275 , 275 - 300 , 300 - 325 , 325 - 350 , 350 - 375 , 375 - 400 , 400 - 425 , 425 - 450 , 450 - 475 , 475 - 500 , 500 - 525 , 525 - 550 , 550 - 575 , 575 - 600 , 600 - 625 , 625 - 650 , 650 - 675 , 675 - 700 , 700 - 725 , 725 - 750 , 750 - 775 , 775 - 800 , 800 - 825 , 825 - 850 , 850 - 875 , 875 - 900 | ||
 | Click To Change The Sort Order: By Market Cap or Company Size Performance: Year-to-date, Week and Day |  |
|
Get the most comprehensive stock market coverage daily at 12Stocks.com ➞ Best Stocks Today ➞ Best Stocks Weekly ➞ Best Stocks Year-to-Date ➞ Best Stocks Trends ➞  Best Stocks Today 12Stocks.com Best Nasdaq Stocks ➞ Best S&P 500 Stocks ➞ Best Tech Stocks ➞ Best Biotech Stocks ➞ |
| Detailed Overview of Tech Stocks |
| Tech Technical Overview, Leaders & Laggards, Top Tech ETF Funds & Detailed Tech Stocks List, Charts, Trends & More |
| Tech Sector: Technical Analysis, Trends & YTD Performance | |
| Technology sector is composed of stocks
from semiconductors, software, web, social media
and services subsectors. Technology sector, as represented by XLK, an exchange-traded fund [ETF] that holds basket of tech stocks (e.g, Intel, Google) is up by 23.7823% and is currently outperforming the overall market by 9.0244% year-to-date. Below is a quick view of technical charts and trends: |
|
 XLK Weekly Chart |
|
| Long Term Trend: Very Good | |
| Medium Term Trend: Good | |
 XLK Daily Chart |
|
| Short Term Trend: Very Good | |
| Overall Trend Score: 100 | |
| YTD Performance: 23.7823% | |
| **Trend Scores & Views Are Only For Educational Purposes And Not For Investing | |
| 12Stocks.com: Top Performing Technology Sector Stocks | ||||||||||||||||||||||||||||||||||||||||||||||||
 The top performing Technology sector stocks year to date are
Now, more recently, over last week, the top performing Technology sector stocks on the move are


|
||||||||||||||||||||||||||||||||||||||||||||||||
| 12Stocks.com: Investing in Tech Sector using Exchange Traded Funds | |
|
The following table shows list of key exchange traded funds (ETF) that
help investors track Tech Index. For detailed view, check out our ETF Funds section of our website. Quick View: Move mouse or cursor over ETF symbol (ticker) to view short-term technical chart and over ETF name to view long term chart. Click on ticker or stock name for detailed view. Click on to add stock symbol to your watchlist and to view watchlist. |
12Stocks.com List of ETFs that track Tech Index
| Ticker | ETF Name | Watchlist | Recent Price | Smart Investing & Trading Score | Change % | Week % | Year-to-date % |
| IGN | Tech-Multimd Ntwk | | 53.86 | 40 | 0.918119 | -20.6435 | 0% |
| 12Stocks.com: Charts, Trends, Fundamental Data and Performances of Tech Stocks | |
|
We now take in-depth look at all Tech stocks including charts, multi-period performances and overall trends (as measured by Smart Investing & Trading Score). One can sort Tech stocks (click link to choose) by Daily, Weekly and by Year-to-Date performances. Also, one can sort by size of the company or by market capitalization. |
| Select Your Default Chart Type: | |||||
| |||||
| Click on stock symbol or name for detailed view. Click on to add stock symbol to your watchlist and to view watchlist. Quick View: Move mouse or cursor over "Daily" to quickly view daily technical stock chart and over "Weekly" to view weekly technical stock chart. | |||||


 | PLTK Playtika Holding Corp |
| Sector: Technology | |
| SubSector: Electronic Gaming & Multimedia | |
| MarketCap: 1397.96 Millions | |
| Recent Price: 3.85 Smart Investing & Trading Score: 40 | |
| Day Percent Change: -1.91327% Day Change: -0.1 | |
| Week Change: 7.70308% Year-to-date Change: -41.6% | |
| PLTK Links: Profile News Message Board | |
| Charts:- Daily , Weekly | |
| Add PLTK to Watchlist: View: Get Complete PLTK Trend Analysis ➞ | |
 | ASGN ASGN Inc |
| Sector: Technology | |
| SubSector: Information Technology Services | |
| MarketCap: 2324.47 Millions | |
| Recent Price: 47.90 Smart Investing & Trading Score: 50 | |
| Day Percent Change: -0.766522% Day Change: -0.13 | |
| Week Change: -2.56306% Year-to-date Change: -42.2% | |
| ASGN Links: Profile News Message Board | |
| Charts:- Daily , Weekly | |
| Add ASGN to Watchlist: View: Get Complete ASGN Trend Analysis ➞ | |
 | SPSC SPS Commerce Inc |
| Sector: Technology | |
| SubSector: Software - Application | |
| MarketCap: 4192.71 Millions | |
| Recent Price: 104.54 Smart Investing & Trading Score: 30 | |
| Day Percent Change: 1.13186% Day Change: 1.87 | |
| Week Change: -2.74444% Year-to-date Change: -42.8% | |
| SPSC Links: Profile News Message Board | |
| Charts:- Daily , Weekly | |
| Add SPSC to Watchlist: View: Get Complete SPSC Trend Analysis ➞ | |
 | FIVN Five9 Inc |
| Sector: Technology | |
| SubSector: Software - Infrastructure | |
| MarketCap: 2062.91 Millions | |
| Recent Price: 23.01 Smart Investing & Trading Score: 10 | |
| Day Percent Change: -2.74725% Day Change: -0.49 | |
| Week Change: -10.883% Year-to-date Change: -43.1% | |
| FIVN Links: Profile News Message Board | |
| Charts:- Daily , Weekly | |
| Add FIVN to Watchlist: View: Get Complete FIVN Trend Analysis ➞ | |
 | PUBM PubMatic Inc |
| Sector: Technology | |
| SubSector: Software - Application | |
| MarketCap: 382.73 Millions | |
| Recent Price: 8.28 Smart Investing & Trading Score: 40 | |
| Day Percent Change: 0.242131% Day Change: 0.68 | |
| Week Change: -1.89573% Year-to-date Change: -44.2% | |
| PUBM Links: Profile News Message Board | |
| Charts:- Daily , Weekly | |
| Add PUBM to Watchlist: View: Get Complete PUBM Trend Analysis ➞ | |
 | CCOI Cogent Communications Holdings Inc |
| Sector: Technology | |
| SubSector: Telecom Services | |
| MarketCap: 1813.86 Millions | |
| Recent Price: 40.39 Smart Investing & Trading Score: 80 | |
| Day Percent Change: 3.29923% Day Change: 0.02 | |
| Week Change: -0.688468% Year-to-date Change: -45.7% | |
| CCOI Links: Profile News Message Board | |
| Charts:- Daily , Weekly | |
| Add CCOI to Watchlist: View: Get Complete CCOI Trend Analysis ➞ | |
 | CRTO Criteo S.A ADR |
| Sector: Technology | |
| SubSector: Advertising Agencies | |
| MarketCap: 1349.64 Millions | |
| Recent Price: 21.31 Smart Investing & Trading Score: 0 | |
| Day Percent Change: -3.92245% Day Change: -0.2 | |
| Week Change: -5.03565% Year-to-date Change: -45.8% | |
| CRTO Links: Profile News Message Board | |
| Charts:- Daily , Weekly | |
| Add CRTO to Watchlist: View: Get Complete CRTO Trend Analysis ➞ | |
 | MLAB Mesa Laboratories, Inc |
| Sector: Technology | |
| SubSector: Scientific & Technical Instruments | |
| MarketCap: 356.22 Millions | |
| Recent Price: 71.23 Smart Investing & Trading Score: 70 | |
| Day Percent Change: 1.07847% Day Change: -1.96 | |
| Week Change: 7.25794% Year-to-date Change: -45.9% | |
| MLAB Links: Profile News Message Board | |
| Charts:- Daily , Weekly | |
| Add MLAB to Watchlist: View: Get Complete MLAB Trend Analysis ➞ | |
 | TEO Telecom Argentina S.A. ADR |
| Sector: Technology | |
| SubSector: Telecom Services | |
| MarketCap: 1070.2 Millions | |
| Recent Price: 7.45 Smart Investing & Trading Score: 70 | |
| Day Percent Change: 2.33516% Day Change: 0.23 | |
| Week Change: -1.97368% Year-to-date Change: -46.0% | |
| TEO Links: Profile News Message Board | |
| Charts:- Daily , Weekly | |
| Add TEO to Watchlist: View: Get Complete TEO Trend Analysis ➞ | |
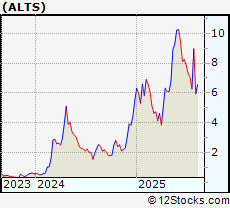 | ALTS ALT5 Sigma Corp |
| Sector: Technology | |
| SubSector: Software - Application | |
| MarketCap: 534.47 Millions | |
| Recent Price: 2.78 Smart Investing & Trading Score: 30 | |
| Day Percent Change: 5.70342% Day Change: -0.38 | |
| Week Change: -18.4751% Year-to-date Change: -46.0% | |
| ALTS Links: Profile News Message Board | |
| Charts:- Daily , Weekly | |
| Add ALTS to Watchlist: View: Get Complete ALTS Trend Analysis ➞ | |
 | HKD AMTD Digital Inc ADR |
| Sector: Technology | |
| SubSector: Software - Application | |
| MarketCap: 131.17 Millions | |
| Recent Price: 1.83 Smart Investing & Trading Score: 26 | |
| Day Percent Change: 0% Day Change: 0 | |
| Week Change: -3.05% Year-to-date Change: -46.3% | |
| HKD Links: Profile News Message Board | |
| Charts:- Daily , Weekly | |
| Add HKD to Watchlist: View: Get Complete HKD Trend Analysis ➞ | |
 | PAR Par Technology Corp |
| Sector: Technology | |
| SubSector: Software - Application | |
| MarketCap: 1960.07 Millions | |
| Recent Price: 38.17 Smart Investing & Trading Score: 10 | |
| Day Percent Change: 1.30042% Day Change: -0.26 | |
| Week Change: -7.39932% Year-to-date Change: -46.6% | |
| PAR Links: Profile News Message Board | |
| Charts:- Daily , Weekly | |
| Add PAR to Watchlist: View: Get Complete PAR Trend Analysis ➞ | |
 | IT Gartner, Inc |
| Sector: Technology | |
| SubSector: Information Technology Services | |
| MarketCap: 18624.2 Millions | |
| Recent Price: 257.23 Smart Investing & Trading Score: 20 | |
| Day Percent Change: 2.48207% Day Change: 4.83 | |
| Week Change: -2.12693% Year-to-date Change: -46.8% | |
| IT Links: Profile News Message Board | |
| Charts:- Daily , Weekly | |
| Add IT to Watchlist: View: Get Complete IT Trend Analysis ➞ | |
 | ENPH Enphase Energy Inc |
| Sector: Technology | |
| SubSector: Solar | |
| MarketCap: 5184.27 Millions | |
| Recent Price: 37.74 Smart Investing & Trading Score: 90 | |
| Day Percent Change: 1.97244% Day Change: 0.48 | |
| Week Change: -0.658068% Year-to-date Change: -47.1% | |
| ENPH Links: Profile News Message Board | |
| Charts:- Daily , Weekly | |
| Add ENPH to Watchlist: View: Get Complete ENPH Trend Analysis ➞ | |
 | AI C3.ai Inc |
| Sector: Technology | |
| SubSector: Software - Infrastructure | |
| MarketCap: 2099.11 Millions | |
| Recent Price: 18.24 Smart Investing & Trading Score: 70 | |
| Day Percent Change: 4.22857% Day Change: -0.08 | |
| Week Change: 0.551268% Year-to-date Change: -47.4% | |
| AI Links: Profile News Message Board | |
| Charts:- Daily , Weekly | |
| Add AI to Watchlist: View: Get Complete AI Trend Analysis ➞ | |
 | EXFY Expensify Inc |
| Sector: Technology | |
| SubSector: Software - Application | |
| MarketCap: 177.89 Millions | |
| Recent Price: 1.76 Smart Investing & Trading Score: 48 | |
| Day Percent Change: 1.75% Day Change: 0.03 | |
| Week Change: -3.33% Year-to-date Change: -48.1% | |
| EXFY Links: Profile News Message Board | |
| Charts:- Daily , Weekly | |
| Add EXFY to Watchlist: View: Get Complete EXFY Trend Analysis ➞ | |
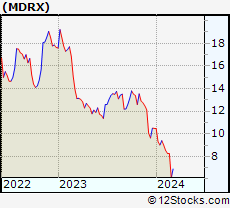 | MDRX Allscripts Healthcare Solutions, Inc. |
| Sector: Technology | |
| SubSector: Application Software | |
| MarketCap: 1026.62 Millions | |
| Recent Price: 4.70 Smart Investing & Trading Score: 80 | |
| Day Percent Change: 0% Day Change: -0.05 | |
| Week Change: 0% Year-to-date Change: -48.4% | |
| MDRX Links: Profile News Message Board | |
| Charts:- Daily , Weekly | |
| Add MDRX to Watchlist: View: Get Complete MDRX Trend Analysis ➞ | |
 | SABR Sabre Corp |
| Sector: Technology | |
| SubSector: Software - Infrastructure | |
| MarketCap: 674.62 Millions | |
| Recent Price: 1.84 Smart Investing & Trading Score: 30 | |
| Day Percent Change: -1.07527% Day Change: -0.04 | |
| Week Change: 1.65746% Year-to-date Change: -48.5% | |
| SABR Links: Profile News Message Board | |
| Charts:- Daily , Weekly | |
| Add SABR to Watchlist: View: Get Complete SABR Trend Analysis ➞ | |
 | TRUE Truecar Inc |
| Sector: Technology | |
| SubSector: Internet Content & Information | |
| MarketCap: 191.03 Millions | |
| Recent Price: 1.79 Smart Investing & Trading Score: 20 | |
| Day Percent Change: 4.97076% Day Change: 0.04 | |
| Week Change: -17.2811% Year-to-date Change: -48.7% | |
| TRUE Links: Profile News Message Board | |
| Charts:- Daily , Weekly | |
| Add TRUE to Watchlist: View: Get Complete TRUE Trend Analysis ➞ | |
 | MYPS PLAYSTUDIOS Inc |
| Sector: Technology | |
| SubSector: Electronic Gaming & Multimedia | |
| MarketCap: 121.56 Millions | |
| Recent Price: 0.94 Smart Investing & Trading Score: 20 | |
| Day Percent Change: -0.76834% Day Change: -0.01 | |
| Week Change: -3.43132% Year-to-date Change: -50.1% | |
| MYPS Links: Profile News Message Board | |
| Charts:- Daily , Weekly | |
| Add MYPS to Watchlist: View: Get Complete MYPS Trend Analysis ➞ | |
 | WPP WPP Plc. ADR |
| Sector: Technology | |
| SubSector: Advertising Agencies | |
| MarketCap: 5825.25 Millions | |
| Recent Price: 24.28 Smart Investing & Trading Score: 30 | |
| Day Percent Change: -2.17566% Day Change: -0.67 | |
| Week Change: 1.20884% Year-to-date Change: -50.5% | |
| WPP Links: Profile News Message Board | |
| Charts:- Daily , Weekly | |
| Add WPP to Watchlist: View: Get Complete WPP Trend Analysis ➞ | |
 | ALIT Alight Inc |
| Sector: Technology | |
| SubSector: Software - Application | |
| MarketCap: 2038.51 Millions | |
| Recent Price: 3.21 Smart Investing & Trading Score: 20 | |
| Day Percent Change: 0.626959% Day Change: -0.05 | |
| Week Change: 1.90476% Year-to-date Change: -51.8% | |
| ALIT Links: Profile News Message Board | |
| Charts:- Daily , Weekly | |
| Add ALIT to Watchlist: View: Get Complete ALIT Trend Analysis ➞ | |
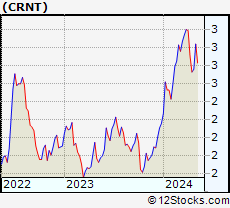 | CRNT Ceragon Networks Ltd |
| Sector: Technology | |
| SubSector: Communication Equipment | |
| MarketCap: 177.68 Millions | |
| Recent Price: 2.33 Smart Investing & Trading Score: 70 | |
| Day Percent Change: 2.19298% Day Change: 0.02 | |
| Week Change: -5.66802% Year-to-date Change: -52.1% | |
| CRNT Links: Profile News Message Board | |
| Charts:- Daily , Weekly | |
| Add CRNT to Watchlist: View: Get Complete CRNT Trend Analysis ➞ | |
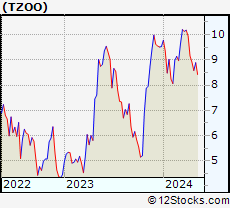 | TZOO Travelzoo |
| Sector: Technology | |
| SubSector: Internet Content & Information | |
| MarketCap: 103.88 Millions | |
| Recent Price: 9.85 Smart Investing & Trading Score: 20 | |
| Day Percent Change: -0.10142% Day Change: -0.18 | |
| Week Change: -5.83174% Year-to-date Change: -52.3% | |
| TZOO Links: Profile News Message Board | |
| Charts:- Daily , Weekly | |
| Add TZOO to Watchlist: View: Get Complete TZOO Trend Analysis ➞ | |
 | RPD Rapid7 Inc |
| Sector: Technology | |
| SubSector: Software - Infrastructure | |
| MarketCap: 1315.64 Millions | |
| Recent Price: 18.64 Smart Investing & Trading Score: 10 | |
| Day Percent Change: 0% Day Change: -0.16 | |
| Week Change: -4.06588% Year-to-date Change: -52.7% | |
| RPD Links: Profile News Message Board | |
| Charts:- Daily , Weekly | |
| Add RPD to Watchlist: View: Get Complete RPD Trend Analysis ➞ | |
| For tabular summary view of above stock list: Summary View ➞ 0 - 25 , 25 - 50 , 50 - 75 , 75 - 100 , 100 - 125 , 125 - 150 , 150 - 175 , 175 - 200 , 200 - 225 , 225 - 250 , 250 - 275 , 275 - 300 , 300 - 325 , 325 - 350 , 350 - 375 , 375 - 400 , 400 - 425 , 425 - 450 , 450 - 475 , 475 - 500 , 500 - 525 , 525 - 550 , 550 - 575 , 575 - 600 , 600 - 625 , 625 - 650 , 650 - 675 , 675 - 700 , 700 - 725 , 725 - 750 , 750 - 775 , 775 - 800 , 800 - 825 , 825 - 850 , 850 - 875 , 875 - 900 | ||
| Click To Change The Sort Order: By Market Cap or Company Size Performance: Year-to-date, Week and Day | |
| Select Chart Type: | ||
|
Best Stocks Today 12Stocks.com |
© 2025 12Stocks.com Terms & Conditions Privacy Contact Us
All Information Provided Only For Education And Not To Be Used For Investing or Trading. See Terms & Conditions


One More Thing ... Get Best Stocks Delivered Daily!
Never Ever Miss A Move With Our Top Ten Stocks Lists
Find Best Stocks In Any Market - Bull or Bear Market
Take A Peek At Our Top Ten Stocks Lists: Daily, Weekly, Year-to-Date & Top Trends
Find Best Stocks In Any Market - Bull or Bear Market
Take A Peek At Our Top Ten Stocks Lists: Daily, Weekly, Year-to-Date & Top Trends
Technology Stocks With Best Up Trends [0-bearish to 100-bullish]: Sony [100], Bakkt [100], Rigetti Computing[100], Fair Isaac[100], Arqit Quantum[100], D-Wave Quantum[100], Navitas Semiconductor[100], Shoals [100], Vuzix [100], Arteris [100], Lantronix [100]
Best Technology Stocks Year-to-Date:
Xunlei [370.476%], Sify [315.033%], Wolfspeed [307.01%], Digital Turbine[265.057%], EchoStar Corp[247.253%], CuriosityStream [241.605%], Viasat [224.029%], Pagaya [222.638%], Oneconnect Financial[209.053%], D-Wave Quantum[203.954%], CommScope Holding[203.101%] Best Technology Stocks This Week:
GTT [443626%], Barracuda Networks[71050%], Mobile TeleSystems[10483.5%], Nam Tai[5033.33%], Ebix [4200.85%], Fang [4150%], NantHealth [3114.02%], Hemisphere Media[2981.82%], Yandex N.V[2935.27%], Wolfspeed [1961.98%], Castlight Health[1751.96%] Best Technology Stocks Daily:
Sony [194.565%], Bakkt [28.6091%], Rigetti Computing[18.4925%], Fair Isaac[17.979%], Arqit Quantum[17.9369%], Marti [17%], Latch [16.6667%], Oclaro [14.734%], D-Wave Quantum[13.968%], Arbe Robotics[13.0178%], Navitas Semiconductor[12.3288%]