
 Login Sign Up


| |||||
 |  | ||||

| 12Stocks.com Market Intelligence |
Best Tech Stocks
| In a hurry? Tech Stocks Lists: Performance & Trends, Stock Charts, FANG Stocks
Sort Tech stocks: Daily, Weekly, Year-to-Date, Market Cap & Trends. Filter Tech stocks list by size:All Tech Large Mid-Range Small and MicroCap |
| 12Stocks.com Tech Stocks Performances & Trends Daily | |||||||||
|
|  The overall Smart Investing & Trading Score is 100 (0-bearish to 100-bullish) which puts Technology sector in short term bullish trend. The Smart Investing & Trading Score from previous trading session is 90 and an improvement of trend continues.
| ||||||||
Here are the Smart Investing & Trading Scores of the most requested Technology stocks at 12Stocks.com (click stock name for detailed review):
|


| 12Stocks.com: Investing in Technology sector with Stocks | |
|
The following table helps investors and traders sort through current performance and trends (as measured by Smart Investing & Trading Score) of various
stocks in the Tech sector. Quick View: Move mouse or cursor over stock symbol (ticker) to view short-term technical chart and over stock name to view long term chart. Click on  to add stock symbol to your watchlist and to add stock symbol to your watchlist and  to view watchlist. Click on any ticker or stock name for detailed market intelligence report for that stock. to view watchlist. Click on any ticker or stock name for detailed market intelligence report for that stock. |
12Stocks.com Performance of Stocks in Tech Sector
| Ticker | Stock Name | Watchlist | Category | Recent Price | Smart Investing & Trading Score | Change % | Weekly Change% |
| WIN | Windstream |   | Telecom | 14.14 | 30 | 0.86% | -28.80% |
| VRTU | Virtusa | | IT | 58.69 | 30 | -0.46% | -29.23% |
| SYT | SYLA | | Software - | 1.50 | 0 | 0.00% | -29.25% |
| COUP | Coupa Software | | Internet | 55.71 | 10 | 2.07% | -31.20% |
| RTEC | Rudolph | | Instruments | 5.79 | 40 | 2.84% | -32.67% |
| MANT | ManTech | | Security Software | 59.79 | 20 | 2.15% | -37.71% |
| EIGI | Endurance | | Software | 10.17 | 20 | 0.49% | -40.11% |
| ACXM | Acxiom | | IT | 870.77 | 10 | -0.26% | -41.91% |
| NEWR | New Relic | | Software | 50.32 | 0 | -15.80% | -42.14% |
| CCMP | Cabot Microelectronics | | Semiconductor | 99.90 | 0 | 0.39% | -42.48% |
| NCIT | NCI | | IT | 10.30 | 30 | 1.08% | -45.36% |
| KZ | KongZhong | | Software | 2.44 | 0 | 0.41% | -48.31% |
| IXYS | IXYS | | Semiconductor | 2.18 | 10 | -1.80% | -48.71% |
| BBOX | Black Box | | Networking | 5.60 | 10 | -4.92% | -48.72% |
| INXN | InterXion Holding | | IT | 2.01 | 40 | 0.50% | -51.33% |
| STMP | Stamps.com | | Software | 152.62 | 50 | 1.47% | -53.70% |
| BBRY | BlackBerry | | Communication | 15.81 | 0 | -0.38% | -54.93% |
| CTRL | Control4 | | Electronics | 1.52 | 10 | -0.65% | -55.43% |
| PTNR | Partner | | Wireless | 1.63 | 0 | -1.21% | -56.76% |
| NIHD | NII | | Wireless | 2.64 | 20 | -4.00% | -57.76% |
| CDK | CDK Global | | Software | 23.01 | 0 | -0.65% | -57.98% |
| QADA | QAD | | Software | 36.60 | 0 | -58.23% | -58.23% |
| DST | DST Systems | | Software | 29.76 | 10 | -1.00% | -59.69% |
| ACIA | Acacia | | Communication | 21.82 | 10 | 0.32% | -61.83% |
| MLNX | Mellanox | | Semiconductor | 13.79 | 10 | 1.40% | -62.30% |
| For chart view version of above stock list: Chart View ➞ 0 - 25 , 25 - 50 , 50 - 75 , 75 - 100 , 100 - 125 , 125 - 150 , 150 - 175 , 175 - 200 , 200 - 225 , 225 - 250 , 250 - 275 , 275 - 300 , 300 - 325 , 325 - 350 , 350 - 375 , 375 - 400 , 400 - 425 , 425 - 450 , 450 - 475 , 475 - 500 , 500 - 525 , 525 - 550 , 550 - 575 , 575 - 600 , 600 - 625 , 625 - 650 , 650 - 675 , 675 - 700 , 700 - 725 , 725 - 750 , 750 - 775 , 775 - 800 , 800 - 825 , 825 - 850 , 850 - 875 , 875 - 900 | ||
 | Click To Change The Sort Order: By Market Cap or Company Size Performance: Year-to-date, Week and Day |  |
|
Get the most comprehensive stock market coverage daily at 12Stocks.com ➞ Best Stocks Today ➞ Best Stocks Weekly ➞ Best Stocks Year-to-Date ➞ Best Stocks Trends ➞  Best Stocks Today 12Stocks.com Best Nasdaq Stocks ➞ Best S&P 500 Stocks ➞ Best Tech Stocks ➞ Best Biotech Stocks ➞ |
| Detailed Overview of Tech Stocks |
| Tech Technical Overview, Leaders & Laggards, Top Tech ETF Funds & Detailed Tech Stocks List, Charts, Trends & More |
| Tech Sector: Technical Analysis, Trends & YTD Performance | |
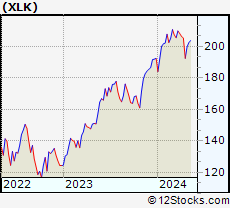
| Technology sector is composed of stocks
from semiconductors, software, web, social media
and services subsectors. Technology sector, as represented by XLK, an exchange-traded fund [ETF] that holds basket of tech stocks (e.g, Intel, Google) is up by 23.7823% and is currently outperforming the overall market by 9.0244% year-to-date. Below is a quick view of technical charts and trends: |
|
 XLK Weekly Chart |
|
| Long Term Trend: Very Good | |
| Medium Term Trend: Good | |
 XLK Daily Chart |
|
| Short Term Trend: Very Good | |
| Overall Trend Score: 100 | |
| YTD Performance: 23.7823% | |
| **Trend Scores & Views Are Only For Educational Purposes And Not For Investing | |
| 12Stocks.com: Top Performing Technology Sector Stocks | ||||||||||||||||||||||||||||||||||||||||||||||||
 The top performing Technology sector stocks year to date are
Now, more recently, over last week, the top performing Technology sector stocks on the move are


|
||||||||||||||||||||||||||||||||||||||||||||||||
| 12Stocks.com: Investing in Tech Sector using Exchange Traded Funds | |
|
The following table shows list of key exchange traded funds (ETF) that
help investors track Tech Index. For detailed view, check out our ETF Funds section of our website. Quick View: Move mouse or cursor over ETF symbol (ticker) to view short-term technical chart and over ETF name to view long term chart. Click on ticker or stock name for detailed view. Click on to add stock symbol to your watchlist and to view watchlist. |
12Stocks.com List of ETFs that track Tech Index
| Ticker | ETF Name | Watchlist | Recent Price | Smart Investing & Trading Score | Change % | Week % | Year-to-date % |
| IGN | Tech-Multimd Ntwk | | 53.86 | 40 | 0.918119 | -20.6435 | 0% |
| 12Stocks.com: Charts, Trends, Fundamental Data and Performances of Tech Stocks | |
|
We now take in-depth look at all Tech stocks including charts, multi-period performances and overall trends (as measured by Smart Investing & Trading Score). One can sort Tech stocks (click link to choose) by Daily, Weekly and by Year-to-Date performances. Also, one can sort by size of the company or by market capitalization. |
| Select Your Default Chart Type: | |||||
| |||||
| Click on stock symbol or name for detailed view. Click on to add stock symbol to your watchlist and to view watchlist. Quick View: Move mouse or cursor over "Daily" to quickly view daily technical stock chart and over "Weekly" to view weekly technical stock chart. | |||||


 | WIN Windstream Holdings, Inc. |
| Sector: Technology | |
| SubSector: Telecom Services - Domestic | |
| MarketCap: 1110.06 Millions | |
| Recent Price: 14.14 Smart Investing & Trading Score: 30 | |
| Day Percent Change: 0.85592% Day Change: -9999 | |
| Week Change: -28.8016% Year-to-date Change: 0.0% | |
| WIN Links: Profile News Message Board | |
| Charts:- Daily , Weekly | |
| Add WIN to Watchlist: View: Get Complete WIN Trend Analysis ➞ | |
 | VRTU Virtusa Corporation |
| Sector: Technology | |
| SubSector: Information Technology Services | |
| MarketCap: 993.268 Millions | |
| Recent Price: 58.69 Smart Investing & Trading Score: 30 | |
| Day Percent Change: -0.457938% Day Change: -9999 | |
| Week Change: -29.2295% Year-to-date Change: 0.0% | |
| VRTU Links: Profile News Message Board | |
| Charts:- Daily , Weekly | |
| Add VRTU to Watchlist: View: Get Complete VRTU Trend Analysis ➞ | |
 | SYT SYLA Technologies Co., Ltd. |
| Sector: Technology | |
| SubSector: Software - Application | |
| MarketCap: 187 Millions | |
| Recent Price: 1.50 Smart Investing & Trading Score: 0 | |
| Day Percent Change: 0% Day Change: -9999 | |
| Week Change: -29.2453% Year-to-date Change: -25.0% | |
| SYT Links: Profile News Message Board | |
| Charts:- Daily , Weekly | |
| Add SYT to Watchlist: View: Get Complete SYT Trend Analysis ➞ | |
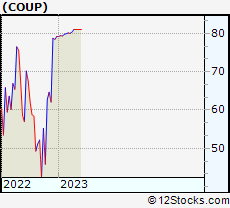 | COUP Coupa Software Incorporated |
| Sector: Technology | |
| SubSector: Internet Software & Services | |
| MarketCap: 9424.21 Millions | |
| Recent Price: 55.71 Smart Investing & Trading Score: 10 | |
| Day Percent Change: 2.07036% Day Change: -9999 | |
| Week Change: -31.1967% Year-to-date Change: 0.0% | |
| COUP Links: Profile News Message Board | |
| Charts:- Daily , Weekly | |
| Add COUP to Watchlist: View: Get Complete COUP Trend Analysis ➞ | |
 | RTEC Rudolph Technologies, Inc. |
| Sector: Technology | |
| SubSector: Scientific & Technical Instruments | |
| MarketCap: 674.52 Millions | |
| Recent Price: 5.79 Smart Investing & Trading Score: 40 | |
| Day Percent Change: 2.84192% Day Change: -9999 | |
| Week Change: -32.6744% Year-to-date Change: 0.0% | |
| RTEC Links: Profile News Message Board | |
| Charts:- Daily , Weekly | |
| Add RTEC to Watchlist: View: Get Complete RTEC Trend Analysis ➞ | |
 | MANT ManTech International Corporation |
| Sector: Technology | |
| SubSector: Security Software & Services | |
| MarketCap: 2555.37 Millions | |
| Recent Price: 59.79 Smart Investing & Trading Score: 20 | |
| Day Percent Change: 2.15274% Day Change: -9999 | |
| Week Change: -37.7058% Year-to-date Change: 0.0% | |
| MANT Links: Profile News Message Board | |
| Charts:- Daily , Weekly | |
| Add MANT to Watchlist: View: Get Complete MANT Trend Analysis ➞ | |
 | EIGI Endurance International Group Holdings, Inc. |
| Sector: Technology | |
| SubSector: Application Software | |
| MarketCap: 259.962 Millions | |
| Recent Price: 10.17 Smart Investing & Trading Score: 20 | |
| Day Percent Change: 0.494071% Day Change: -9999 | |
| Week Change: -40.106% Year-to-date Change: 0.0% | |
| EIGI Links: Profile News Message Board | |
| Charts:- Daily , Weekly | |
| Add EIGI to Watchlist: View: Get Complete EIGI Trend Analysis ➞ | |
 | ACXM Acxiom Corporation |
| Sector: Technology | |
| SubSector: Information Technology Services | |
| MarketCap: 2197.32 Millions | |
| Recent Price: 870.77 Smart Investing & Trading Score: 10 | |
| Day Percent Change: -0.256584% Day Change: -9999 | |
| Week Change: -41.9115% Year-to-date Change: 0.0% | |
| ACXM Links: Profile News Message Board | |
| Charts:- Daily , Weekly | |
| Add ACXM to Watchlist: View: Get Complete ACXM Trend Analysis ➞ | |
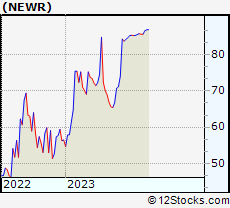 | NEWR New Relic, Inc. |
| Sector: Technology | |
| SubSector: Business Software & Services | |
| MarketCap: 2627.28 Millions | |
| Recent Price: 50.32 Smart Investing & Trading Score: 0 | |
| Day Percent Change: -15.7965% Day Change: -9999 | |
| Week Change: -42.141% Year-to-date Change: 0.0% | |
| NEWR Links: Profile News Message Board | |
| Charts:- Daily , Weekly | |
| Add NEWR to Watchlist: View: Get Complete NEWR Trend Analysis ➞ | |
 | CCMP Cabot Microelectronics Corporation |
| Sector: Technology | |
| SubSector: Semiconductor Equipment & Materials | |
| MarketCap: 3004.38 Millions | |
| Recent Price: 99.90 Smart Investing & Trading Score: 0 | |
| Day Percent Change: 0.39192% Day Change: -9999 | |
| Week Change: -42.4837% Year-to-date Change: 0.0% | |
| CCMP Links: Profile News Message Board | |
| Charts:- Daily , Weekly | |
| Add CCMP to Watchlist: View: Get Complete CCMP Trend Analysis ➞ | |
 | NCIT NCI, Inc. |
| Sector: Technology | |
| SubSector: Information Technology Services | |
| MarketCap: 202.37 Millions | |
| Recent Price: 10.30 Smart Investing & Trading Score: 30 | |
| Day Percent Change: 1.07949% Day Change: -9999 | |
| Week Change: -45.3581% Year-to-date Change: 0.0% | |
| NCIT Links: Profile News Message Board | |
| Charts:- Daily , Weekly | |
| Add NCIT to Watchlist: View: Get Complete NCIT Trend Analysis ➞ | |
 | KZ KongZhong Corporation |
| Sector: Technology | |
| SubSector: Multimedia & Graphics Software | |
| MarketCap: 344.27 Millions | |
| Recent Price: 2.44 Smart Investing & Trading Score: 0 | |
| Day Percent Change: 0.411523% Day Change: -9999 | |
| Week Change: -48.3051% Year-to-date Change: 0.0% | |
| KZ Links: Profile News Message Board | |
| Charts:- Daily , Weekly | |
| Add KZ to Watchlist: View: Get Complete KZ Trend Analysis ➞ | |
 | IXYS IXYS Corporation |
| Sector: Technology | |
| SubSector: Semiconductor - Specialized | |
| MarketCap: 426.79 Millions | |
| Recent Price: 2.18 Smart Investing & Trading Score: 10 | |
| Day Percent Change: -1.8018% Day Change: -9999 | |
| Week Change: -48.7059% Year-to-date Change: 0.0% | |
| IXYS Links: Profile News Message Board | |
| Charts:- Daily , Weekly | |
| Add IXYS to Watchlist: View: Get Complete IXYS Trend Analysis ➞ | |
 | BBOX Black Box Corporation |
| Sector: Technology | |
| SubSector: Networking & Communication Devices | |
| MarketCap: 131.75 Millions | |
| Recent Price: 5.60 Smart Investing & Trading Score: 10 | |
| Day Percent Change: -4.9236% Day Change: -9999 | |
| Week Change: -48.7179% Year-to-date Change: 0.0% | |
| BBOX Links: Profile News Message Board | |
| Charts:- Daily , Weekly | |
| Add BBOX to Watchlist: View: Get Complete BBOX Trend Analysis ➞ | |
 | INXN InterXion Holding N.V. |
| Sector: Technology | |
| SubSector: Information Technology Services | |
| MarketCap: 5930.48 Millions | |
| Recent Price: 2.01 Smart Investing & Trading Score: 40 | |
| Day Percent Change: 0.5% Day Change: -9999 | |
| Week Change: -51.3317% Year-to-date Change: 0.0% | |
| INXN Links: Profile News Message Board | |
| Charts:- Daily , Weekly | |
| Add INXN to Watchlist: View: Get Complete INXN Trend Analysis ➞ | |
 | STMP Stamps.com Inc. |
| Sector: Technology | |
| SubSector: Application Software | |
| MarketCap: 2009.42 Millions | |
| Recent Price: 152.62 Smart Investing & Trading Score: 50 | |
| Day Percent Change: 1.46932% Day Change: -9999 | |
| Week Change: -53.6968% Year-to-date Change: 0.0% | |
| STMP Links: Profile News Message Board | |
| Charts:- Daily , Weekly | |
| Add STMP to Watchlist: View: Get Complete STMP Trend Analysis ➞ | |
 | BBRY BlackBerry Limited |
| Sector: Technology | |
| SubSector: Diversified Communication Services | |
| MarketCap: 3755.71 Millions | |
| Recent Price: 15.81 Smart Investing & Trading Score: 0 | |
| Day Percent Change: -0.378072% Day Change: -9999 | |
| Week Change: -54.9316% Year-to-date Change: 0.0% | |
| BBRY Links: Profile News Message Board | |
| Charts:- Daily , Weekly | |
| Add BBRY to Watchlist: View: Get Complete BBRY Trend Analysis ➞ | |
 | CTRL Control4 Corporation |
| Sector: Technology | |
| SubSector: Diversified Electronics | |
| MarketCap: 359.16 Millions | |
| Recent Price: 1.52 Smart Investing & Trading Score: 10 | |
| Day Percent Change: -0.653595% Day Change: -9999 | |
| Week Change: -55.4252% Year-to-date Change: 0.0% | |
| CTRL Links: Profile News Message Board | |
| Charts:- Daily , Weekly | |
| Add CTRL to Watchlist: View: Get Complete CTRL Trend Analysis ➞ | |
 | PTNR Partner Communications Company Ltd. |
| Sector: Technology | |
| SubSector: Wireless Communications | |
| MarketCap: 754.027 Millions | |
| Recent Price: 1.63 Smart Investing & Trading Score: 0 | |
| Day Percent Change: -1.21212% Day Change: -9999 | |
| Week Change: -56.7639% Year-to-date Change: 0.0% | |
| PTNR Links: Profile News Message Board | |
| Charts:- Daily , Weekly | |
| Add PTNR to Watchlist: View: Get Complete PTNR Trend Analysis ➞ | |
 | NIHD NII Holdings, Inc. |
| Sector: Technology | |
| SubSector: Wireless Communications | |
| MarketCap: 179.22 Millions | |
| Recent Price: 2.64 Smart Investing & Trading Score: 20 | |
| Day Percent Change: -4% Day Change: -9999 | |
| Week Change: -57.76% Year-to-date Change: 0.0% | |
| NIHD Links: Profile News Message Board | |
| Charts:- Daily , Weekly | |
| Add NIHD to Watchlist: View: Get Complete NIHD Trend Analysis ➞ | |
 | CDK CDK Global, Inc. |
| Sector: Technology | |
| SubSector: Application Software | |
| MarketCap: 3953.32 Millions | |
| Recent Price: 23.01 Smart Investing & Trading Score: 0 | |
| Day Percent Change: -0.647668% Day Change: -9999 | |
| Week Change: -57.9803% Year-to-date Change: 0.0% | |
| CDK Links: Profile News Message Board | |
| Charts:- Daily , Weekly | |
| Add CDK to Watchlist: View: Get Complete CDK Trend Analysis ➞ | |
 | QADA QAD Inc. |
| Sector: Technology | |
| SubSector: Application Software | |
| MarketCap: 714.762 Millions | |
| Recent Price: 36.60 Smart Investing & Trading Score: 0 | |
| Day Percent Change: -58.2335% Day Change: -9999 | |
| Week Change: -58.2335% Year-to-date Change: 0.0% | |
| QADA Links: Profile News Message Board | |
| Charts:- Daily , Weekly | |
| Add QADA to Watchlist: View: Get Complete QADA Trend Analysis ➞ | |
 | DST DST Systems, Inc. |
| Sector: Technology | |
| SubSector: Business Software & Services | |
| MarketCap: 3702.89 Millions | |
| Recent Price: 29.76 Smart Investing & Trading Score: 10 | |
| Day Percent Change: -0.998004% Day Change: -9999 | |
| Week Change: -59.6912% Year-to-date Change: 0.0% | |
| DST Links: Profile News Message Board | |
| Charts:- Daily , Weekly | |
| Add DST to Watchlist: View: Get Complete DST Trend Analysis ➞ | |
 | ACIA Acacia Communications, Inc. |
| Sector: Technology | |
| SubSector: Communication Equipment | |
| MarketCap: 2711.99 Millions | |
| Recent Price: 21.82 Smart Investing & Trading Score: 10 | |
| Day Percent Change: 0.321839% Day Change: -9999 | |
| Week Change: -61.8265% Year-to-date Change: 0.0% | |
| ACIA Links: Profile News Message Board | |
| Charts:- Daily , Weekly | |
| Add ACIA to Watchlist: View: Get Complete ACIA Trend Analysis ➞ | |
 | MLNX Mellanox Technologies, Ltd. |
| Sector: Technology | |
| SubSector: Semiconductor - Broad Line | |
| MarketCap: 6440.62 Millions | |
| Recent Price: 13.79 Smart Investing & Trading Score: 10 | |
| Day Percent Change: 1.39706% Day Change: -9999 | |
| Week Change: -62.3018% Year-to-date Change: 0.0% | |
| MLNX Links: Profile News Message Board | |
| Charts:- Daily , Weekly | |
| Add MLNX to Watchlist: View: Get Complete MLNX Trend Analysis ➞ | |
| For tabular summary view of above stock list: Summary View ➞ 0 - 25 , 25 - 50 , 50 - 75 , 75 - 100 , 100 - 125 , 125 - 150 , 150 - 175 , 175 - 200 , 200 - 225 , 225 - 250 , 250 - 275 , 275 - 300 , 300 - 325 , 325 - 350 , 350 - 375 , 375 - 400 , 400 - 425 , 425 - 450 , 450 - 475 , 475 - 500 , 500 - 525 , 525 - 550 , 550 - 575 , 575 - 600 , 600 - 625 , 625 - 650 , 650 - 675 , 675 - 700 , 700 - 725 , 725 - 750 , 750 - 775 , 775 - 800 , 800 - 825 , 825 - 850 , 850 - 875 , 875 - 900 | ||
| Click To Change The Sort Order: By Market Cap or Company Size Performance: Year-to-date, Week and Day | |
| Select Chart Type: | ||
|
Best Stocks Today 12Stocks.com |
© 2025 12Stocks.com Terms & Conditions Privacy Contact Us
All Information Provided Only For Education And Not To Be Used For Investing or Trading. See Terms & Conditions


One More Thing ... Get Best Stocks Delivered Daily!
Never Ever Miss A Move With Our Top Ten Stocks Lists
Find Best Stocks In Any Market - Bull or Bear Market
Take A Peek At Our Top Ten Stocks Lists: Daily, Weekly, Year-to-Date & Top Trends
Find Best Stocks In Any Market - Bull or Bear Market
Take A Peek At Our Top Ten Stocks Lists: Daily, Weekly, Year-to-Date & Top Trends
Technology Stocks With Best Up Trends [0-bearish to 100-bullish]: Sony [100], Bakkt [100], Rigetti Computing[100], Fair Isaac[100], Arqit Quantum[100], D-Wave Quantum[100], Navitas Semiconductor[100], Shoals [100], Vuzix [100], Arteris [100], Lantronix [100]
Best Technology Stocks Year-to-Date:
Xunlei [370.476%], Sify [315.033%], Wolfspeed [307.01%], Digital Turbine[265.057%], EchoStar Corp[247.253%], CuriosityStream [241.605%], Viasat [224.029%], Pagaya [222.638%], Oneconnect Financial[209.053%], D-Wave Quantum[203.954%], CommScope Holding[203.101%] Best Technology Stocks This Week:
GTT [443626%], Barracuda Networks[71050%], Mobile TeleSystems[10483.5%], Nam Tai[5033.33%], Ebix [4200.85%], Fang [4150%], NantHealth [3114.02%], Hemisphere Media[2981.82%], Yandex N.V[2935.27%], Wolfspeed [1961.98%], Castlight Health[1751.96%] Best Technology Stocks Daily:
Sony [194.565%], Bakkt [28.6091%], Rigetti Computing[18.4925%], Fair Isaac[17.979%], Arqit Quantum[17.9369%], Marti [17%], Latch [16.6667%], Oclaro [14.734%], D-Wave Quantum[13.968%], Arbe Robotics[13.0178%], Navitas Semiconductor[12.3288%]