
 Login Sign Up


| |||||
 |  | ||||

| 12Stocks.com Market Intelligence |
Best Tech Stocks
| In a hurry? Tech Stocks Lists: Performance & Trends, Stock Charts, FANG Stocks
Sort Tech stocks: Daily, Weekly, Year-to-Date, Market Cap & Trends. Filter Tech stocks list by size:All Tech Large Mid-Range Small and MicroCap |
| 12Stocks.com Tech Stocks Performances & Trends Daily | |||||||||
|
|  The overall Smart Investing & Trading Score is 90 (0-bearish to 100-bullish) which puts Technology sector in short term bullish trend. The Smart Investing & Trading Score from previous trading session is 100 and hence a deterioration of trend.
| ||||||||
Here are the Smart Investing & Trading Scores of the most requested Technology stocks at 12Stocks.com (click stock name for detailed review):
|


| 12Stocks.com: Investing in Technology sector with Stocks | |
|
The following table helps investors and traders sort through current performance and trends (as measured by Smart Investing & Trading Score) of various
stocks in the Tech sector. Quick View: Move mouse or cursor over stock symbol (ticker) to view short-term technical chart and over stock name to view long term chart. Click on  to add stock symbol to your watchlist and to add stock symbol to your watchlist and  to view watchlist. Click on any ticker or stock name for detailed market intelligence report for that stock. to view watchlist. Click on any ticker or stock name for detailed market intelligence report for that stock. |
12Stocks.com Performance of Stocks in Tech Sector
| Ticker | Stock Name | Watchlist | Category | Recent Price | Smart Investing & Trading Score | Change % | YTD Change% |
| SMWB | Similarweb |   | Software - | 9.99 | 90 | 1.32% | -28.59% |
| UTEK | Ultratech | | Semiconductor | 16.75 | 30 | 2.13% | 0.00% |
| PDFS | | Software - | 19.38 | 10 | -2.95% | -29.09% | |
| IBTA | Ibotta | | Software - | 26.62 | 20 | -1.38% | -58.41% |
| ADTN | ADTRAN | | Communication | 10.11 | 60 | -4.71% | 16.21% |
| GETY | Getty Images | | Internet Content & Information | 1.95 | 80 | -0.51% | -7.58% |
| AEHR | Aehr Test | | Semiconductor | 26.47 | 80 | -0.38% | 59.94% |
| PTNR | Partner | | Wireless | 1.63 | 0 | -1.21% | 0.00% |
| CSIQ | Canadian Solar | | Solar | 10.89 | 40 | 1.02% | -9.55% |
| PRO | Pros | | Software - | 14.53 | 10 | -6.14% | -32.39% |
| VTEX | Vtex | | Software - | 4.08 | 40 | -0.97% | -31.66% |
| SHEN | Shenandoah Tele | | Telecom | 13.56 | 40 | -1.02% | 9.89% |
| RSKD | Riskified | | Software - | 4.60 | 10 | -1.50% | -3.16% |
| VMEO | Vimeo | | Software - | 7.72 | 100 | 0.00% | 19.14% |
| QTNA | Quantenna | | Communication | 23.19 | 20 | 0.26% | 0.00% |
| NANO | Nanometrics | | Semiconductor | 81.90 | 80 | 0.21% | 0.00% |
| CBB | Cinnati Bell | | Telecom | 49.58 | 70 | -0.54% | 0.00% |
| FARO | FARO | | Instruments | 43.99 | 60 | 0.48% | 68.93% |
| QADA | QAD | | Software | 36.60 | 0 | -58.23% | 0.00% |
| SSTK | Shutterstock | | Internet Content & Information | 20.92 | 80 | -1.09% | -25.79% |
| RDVT | Red Violet | | Software - | 48.61 | 30 | 0.52% | 40.00% |
| RBBN | Ribbon | | Software - | 3.82 | 10 | -3.05% | -3.54% |
| CHUBA | CommerceHub | | Software | 3.65 | 20 | 1.39% | 0.00% |
| TLND | Talend S.A | | Software | 142.22 | 60 | 2.83% | 0.00% |
| LYTS | LSI Industries | | Electronic Components | 22.47 | 40 | -1.83% | 16.65% |
| For chart view version of above stock list: Chart View ➞ 0 - 25 , 25 - 50 , 50 - 75 , 75 - 100 , 100 - 125 , 125 - 150 , 150 - 175 , 175 - 200 , 200 - 225 , 225 - 250 , 250 - 275 , 275 - 300 , 300 - 325 , 325 - 350 , 350 - 375 , 375 - 400 , 400 - 425 , 425 - 450 , 450 - 475 , 475 - 500 , 500 - 525 , 525 - 550 , 550 - 575 , 575 - 600 , 600 - 625 , 625 - 650 , 650 - 675 , 675 - 700 , 700 - 725 , 725 - 750 , 750 - 775 , 775 - 800 , 800 - 825 , 825 - 850 , 850 - 875 , 875 - 900 | ||
 | Click To Change The Sort Order: By Market Cap or Company Size Performance: Year-to-date, Week and Day |  |
|
Get the most comprehensive stock market coverage daily at 12Stocks.com ➞ Best Stocks Today ➞ Best Stocks Weekly ➞ Best Stocks Year-to-Date ➞ Best Stocks Trends ➞  Best Stocks Today 12Stocks.com Best Nasdaq Stocks ➞ Best S&P 500 Stocks ➞ Best Tech Stocks ➞ Best Biotech Stocks ➞ |
| Detailed Overview of Tech Stocks |
| Tech Technical Overview, Leaders & Laggards, Top Tech ETF Funds & Detailed Tech Stocks List, Charts, Trends & More |
| Tech Sector: Technical Analysis, Trends & YTD Performance | |
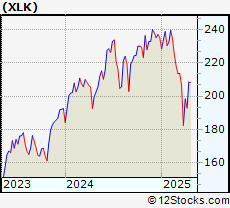
| Technology sector is composed of stocks
from semiconductors, software, web, social media
and services subsectors. Technology sector, as represented by XLK, an exchange-traded fund [ETF] that holds basket of tech stocks (e.g, Intel, Google) is up by 17.1728% and is currently outperforming the overall market by 4.3218% year-to-date. Below is a quick view of technical charts and trends: |
|
 XLK Weekly Chart |
|
| Long Term Trend: Very Good | |
| Medium Term Trend: Good | |
 XLK Daily Chart |
|
| Short Term Trend: Very Good | |
| Overall Trend Score: 90 | |
| YTD Performance: 17.1728% | |
| **Trend Scores & Views Are Only For Educational Purposes And Not For Investing | |
| 12Stocks.com: Top Performing Technology Sector Stocks | ||||||||||||||||||||||||||||||||||||||||||||||||
 The top performing Technology sector stocks year to date are
Now, more recently, over last week, the top performing Technology sector stocks on the move are


|
||||||||||||||||||||||||||||||||||||||||||||||||
| 12Stocks.com: Investing in Tech Sector using Exchange Traded Funds | |
|
The following table shows list of key exchange traded funds (ETF) that
help investors track Tech Index. For detailed view, check out our ETF Funds section of our website. Quick View: Move mouse or cursor over ETF symbol (ticker) to view short-term technical chart and over ETF name to view long term chart. Click on ticker or stock name for detailed view. Click on to add stock symbol to your watchlist and to view watchlist. |
12Stocks.com List of ETFs that track Tech Index
| Ticker | ETF Name | Watchlist | Recent Price | Smart Investing & Trading Score | Change % | Week % | Year-to-date % |
| IGN | Tech-Multimd Ntwk | | 53.86 | 40 | 0.918119 | -20.6435 | 0% |
| 12Stocks.com: Charts, Trends, Fundamental Data and Performances of Tech Stocks | |
|
We now take in-depth look at all Tech stocks including charts, multi-period performances and overall trends (as measured by Smart Investing & Trading Score). One can sort Tech stocks (click link to choose) by Daily, Weekly and by Year-to-Date performances. Also, one can sort by size of the company or by market capitalization. |
| Select Your Default Chart Type: | |||||
| |||||
| Click on stock symbol or name for detailed view. Click on to add stock symbol to your watchlist and to view watchlist. Quick View: Move mouse or cursor over "Daily" to quickly view daily technical stock chart and over "Weekly" to view weekly technical stock chart. | |||||


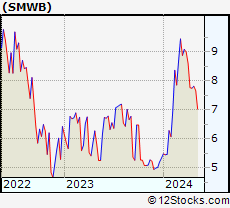 | SMWB Similarweb Ltd |
| Sector: Technology | |
| SubSector: Software - Application | |
| MarketCap: 805.1 Millions | |
| Recent Price: 9.99 Smart Investing & Trading Score: 90 | |
| Day Percent Change: 1.31846% Day Change: 0.09 | |
| Week Change: 2.88363% Year-to-date Change: -28.6% | |
| SMWB Links: Profile News Message Board | |
| Charts:- Daily , Weekly | |
| Add SMWB to Watchlist: View: Get Complete SMWB Trend Analysis ➞ | |
 | UTEK Ultratech, Inc. |
| Sector: Technology | |
| SubSector: Semiconductor Equipment & Materials | |
| MarketCap: 795.22 Millions | |
| Recent Price: 16.75 Smart Investing & Trading Score: 30 | |
| Day Percent Change: 2.13415% Day Change: -9999 | |
| Week Change: -78.2862% Year-to-date Change: 0.0% | |
| UTEK Links: Profile News Message Board | |
| Charts:- Daily , Weekly | |
| Add UTEK to Watchlist: View: Get Complete UTEK Trend Analysis ➞ | |
 | PDFS PDF Solutions Inc |
| Sector: Technology | |
| SubSector: Software - Application | |
| MarketCap: 787.88 Millions | |
| Recent Price: 19.38 Smart Investing & Trading Score: 10 | |
| Day Percent Change: -2.95443% Day Change: -0.04 | |
| Week Change: -1.5744% Year-to-date Change: -29.1% | |
| PDFS Links: Profile News Message Board | |
| Charts:- Daily , Weekly | |
| Add PDFS to Watchlist: View: Get Complete PDFS Trend Analysis ➞ | |
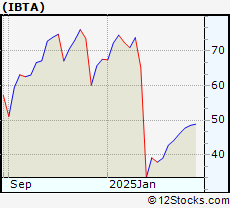 | IBTA Ibotta Inc |
| Sector: Technology | |
| SubSector: Software - Application | |
| MarketCap: 781.25 Millions | |
| Recent Price: 26.62 Smart Investing & Trading Score: 20 | |
| Day Percent Change: -1.38% Day Change: -0.38 | |
| Week Change: 14.61% Year-to-date Change: -58.4% | |
| IBTA Links: Profile News Message Board | |
| Charts:- Daily , Weekly | |
| Add IBTA to Watchlist: View: Get Complete IBTA Trend Analysis ➞ | |
 | ADTN ADTRAN Holdings Inc |
| Sector: Technology | |
| SubSector: Communication Equipment | |
| MarketCap: 780.51 Millions | |
| Recent Price: 10.11 Smart Investing & Trading Score: 60 | |
| Day Percent Change: -4.71254% Day Change: 0.29 | |
| Week Change: 4.55016% Year-to-date Change: 16.2% | |
| ADTN Links: Profile News Message Board | |
| Charts:- Daily , Weekly | |
| Add ADTN to Watchlist: View: Get Complete ADTN Trend Analysis ➞ | |
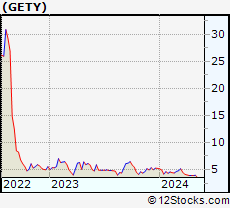 | GETY Getty Images Holdings Inc |
| Sector: Technology | |
| SubSector: Internet Content & Information | |
| MarketCap: 771.55 Millions | |
| Recent Price: 1.95 Smart Investing & Trading Score: 80 | |
| Day Percent Change: -0.510204% Day Change: -0.01 | |
| Week Change: 8.33333% Year-to-date Change: -7.6% | |
| GETY Links: Profile News Message Board | |
| Charts:- Daily , Weekly | |
| Add GETY to Watchlist: View: Get Complete GETY Trend Analysis ➞ | |
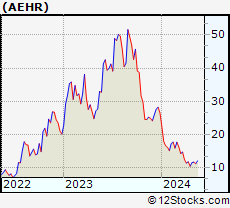 | AEHR Aehr Test Systems |
| Sector: Technology | |
| SubSector: Semiconductor Equipment & Materials | |
| MarketCap: 764.63 Millions | |
| Recent Price: 26.47 Smart Investing & Trading Score: 80 | |
| Day Percent Change: -0.376364% Day Change: 0.28 | |
| Week Change: 0.684671% Year-to-date Change: 59.9% | |
| AEHR Links: Profile News Message Board | |
| Charts:- Daily , Weekly | |
| Add AEHR to Watchlist: View: Get Complete AEHR Trend Analysis ➞ | |
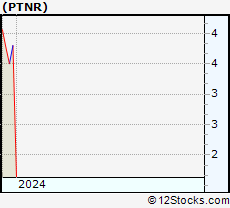 | PTNR Partner Communications Company Ltd. |
| Sector: Technology | |
| SubSector: Wireless Communications | |
| MarketCap: 754.027 Millions | |
| Recent Price: 1.63 Smart Investing & Trading Score: 0 | |
| Day Percent Change: -1.21212% Day Change: -9999 | |
| Week Change: -56.7639% Year-to-date Change: 0.0% | |
| PTNR Links: Profile News Message Board | |
| Charts:- Daily , Weekly | |
| Add PTNR to Watchlist: View: Get Complete PTNR Trend Analysis ➞ | |
 | CSIQ Canadian Solar Inc |
| Sector: Technology | |
| SubSector: Solar | |
| MarketCap: 748.08 Millions | |
| Recent Price: 10.89 Smart Investing & Trading Score: 40 | |
| Day Percent Change: 1.02041% Day Change: -2.37 | |
| Week Change: 12.1524% Year-to-date Change: -9.6% | |
| CSIQ Links: Profile News Message Board | |
| Charts:- Daily , Weekly | |
| Add CSIQ to Watchlist: View: Get Complete CSIQ Trend Analysis ➞ | |
 | PRO Pros Holdings Inc |
| Sector: Technology | |
| SubSector: Software - Application | |
| MarketCap: 745.65 Millions | |
| Recent Price: 14.53 Smart Investing & Trading Score: 10 | |
| Day Percent Change: -6.13695% Day Change: 0.41 | |
| Week Change: -3.83852% Year-to-date Change: -32.4% | |
| PRO Links: Profile News Message Board | |
| Charts:- Daily , Weekly | |
| Add PRO to Watchlist: View: Get Complete PRO Trend Analysis ➞ | |
 | VTEX Vtex |
| Sector: Technology | |
| SubSector: Software - Application | |
| MarketCap: 744.23 Millions | |
| Recent Price: 4.08 Smart Investing & Trading Score: 40 | |
| Day Percent Change: -0.970874% Day Change: -0.04 | |
| Week Change: 1.49254% Year-to-date Change: -31.7% | |
| VTEX Links: Profile News Message Board | |
| Charts:- Daily , Weekly | |
| Add VTEX to Watchlist: View: Get Complete VTEX Trend Analysis ➞ | |
 | SHEN Shenandoah Telecommunications Co |
| Sector: Technology | |
| SubSector: Telecom Services | |
| MarketCap: 738.37 Millions | |
| Recent Price: 13.56 Smart Investing & Trading Score: 40 | |
| Day Percent Change: -1.0219% Day Change: 0.21 | |
| Week Change: 3.35366% Year-to-date Change: 9.9% | |
| SHEN Links: Profile News Message Board | |
| Charts:- Daily , Weekly | |
| Add SHEN to Watchlist: View: Get Complete SHEN Trend Analysis ➞ | |
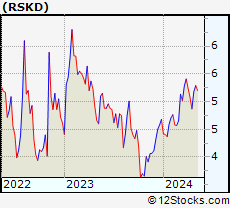 | RSKD Riskified Ltd |
| Sector: Technology | |
| SubSector: Software - Application | |
| MarketCap: 737.07 Millions | |
| Recent Price: 4.60 Smart Investing & Trading Score: 10 | |
| Day Percent Change: -1.49893% Day Change: 0.19 | |
| Week Change: 0.656455% Year-to-date Change: -3.2% | |
| RSKD Links: Profile News Message Board | |
| Charts:- Daily , Weekly | |
| Add RSKD to Watchlist: View: Get Complete RSKD Trend Analysis ➞ | |
 | VMEO Vimeo Inc |
| Sector: Technology | |
| SubSector: Software - Application | |
| MarketCap: 734.1 Millions | |
| Recent Price: 7.72 Smart Investing & Trading Score: 100 | |
| Day Percent Change: 0% Day Change: -0.01 | |
| Week Change: 80.7962% Year-to-date Change: 19.1% | |
| VMEO Links: Profile News Message Board | |
| Charts:- Daily , Weekly | |
| Add VMEO to Watchlist: View: Get Complete VMEO Trend Analysis ➞ | |
 | QTNA Quantenna Communications, Inc. |
| Sector: Technology | |
| SubSector: Communication Equipment | |
| MarketCap: 729.3 Millions | |
| Recent Price: 23.19 Smart Investing & Trading Score: 20 | |
| Day Percent Change: 0.259403% Day Change: -9999 | |
| Week Change: -12.5566% Year-to-date Change: 0.0% | |
| QTNA Links: Profile News Message Board | |
| Charts:- Daily , Weekly | |
| Add QTNA to Watchlist: View: Get Complete QTNA Trend Analysis ➞ | |
 | NANO Nanometrics Incorporated |
| Sector: Technology | |
| SubSector: Semiconductor Equipment & Materials | |
| MarketCap: 728.33 Millions | |
| Recent Price: 81.90 Smart Investing & Trading Score: 80 | |
| Day Percent Change: 0.208002% Day Change: -9999 | |
| Week Change: 197.062% Year-to-date Change: 0.0% | |
| NANO Links: Profile News Message Board | |
| Charts:- Daily , Weekly | |
| Add NANO to Watchlist: View: Get Complete NANO Trend Analysis ➞ | |
 | CBB Cincinnati Bell Inc. |
| Sector: Technology | |
| SubSector: Telecom Services - Domestic | |
| MarketCap: 722.977 Millions | |
| Recent Price: 49.58 Smart Investing & Trading Score: 70 | |
| Day Percent Change: -0.541625% Day Change: -9999 | |
| Week Change: 220.284% Year-to-date Change: 0.0% | |
| CBB Links: Profile News Message Board | |
| Charts:- Daily , Weekly | |
| Add CBB to Watchlist: View: Get Complete CBB Trend Analysis ➞ | |
 | FARO FARO Technologies, Inc. |
| Sector: Technology | |
| SubSector: Scientific & Technical Instruments | |
| MarketCap: 721.953 Millions | |
| Recent Price: 43.99 Smart Investing & Trading Score: 60 | |
| Day Percent Change: 0.479671% Day Change: -9999 | |
| Week Change: 0.182191% Year-to-date Change: 68.9% | |
| FARO Links: Profile News Message Board | |
| Charts:- Daily , Weekly | |
| Add FARO to Watchlist: View: Get Complete FARO Trend Analysis ➞ | |
 | QADA QAD Inc. |
| Sector: Technology | |
| SubSector: Application Software | |
| MarketCap: 714.762 Millions | |
| Recent Price: 36.60 Smart Investing & Trading Score: 0 | |
| Day Percent Change: -58.2335% Day Change: -9999 | |
| Week Change: -58.2335% Year-to-date Change: 0.0% | |
| QADA Links: Profile News Message Board | |
| Charts:- Daily , Weekly | |
| Add QADA to Watchlist: View: Get Complete QADA Trend Analysis ➞ | |
 | SSTK Shutterstock Inc |
| Sector: Technology | |
| SubSector: Internet Content & Information | |
| MarketCap: 713.38 Millions | |
| Recent Price: 20.92 Smart Investing & Trading Score: 80 | |
| Day Percent Change: -1.08747% Day Change: 0.28 | |
| Week Change: 1.60272% Year-to-date Change: -25.8% | |
| SSTK Links: Profile News Message Board | |
| Charts:- Daily , Weekly | |
| Add SSTK to Watchlist: View: Get Complete SSTK Trend Analysis ➞ | |
 | RDVT Red Violet Inc |
| Sector: Technology | |
| SubSector: Software - Application | |
| MarketCap: 708.39 Millions | |
| Recent Price: 48.61 Smart Investing & Trading Score: 30 | |
| Day Percent Change: 0.516956% Day Change: 0.94 | |
| Week Change: -2.36995% Year-to-date Change: 40.0% | |
| RDVT Links: Profile News Message Board | |
| Charts:- Daily , Weekly | |
| Add RDVT to Watchlist: View: Get Complete RDVT Trend Analysis ➞ | |
 | RBBN Ribbon Communications Inc |
| Sector: Technology | |
| SubSector: Software - Application | |
| MarketCap: 706.56 Millions | |
| Recent Price: 3.82 Smart Investing & Trading Score: 10 | |
| Day Percent Change: -3.04569% Day Change: 0.03 | |
| Week Change: -8.17308% Year-to-date Change: -3.5% | |
| RBBN Links: Profile News Message Board | |
| Charts:- Daily , Weekly | |
| Add RBBN to Watchlist: View: Get Complete RBBN Trend Analysis ➞ | |
 | CHUBA CommerceHub, Inc. |
| Sector: Technology | |
| SubSector: Application Software | |
| MarketCap: 702.21 Millions | |
| Recent Price: 3.65 Smart Investing & Trading Score: 20 | |
| Day Percent Change: 1.38889% Day Change: -9999 | |
| Week Change: -2.92553% Year-to-date Change: 0.0% | |
| CHUBA Links: Profile News Message Board | |
| Charts:- Daily , Weekly | |
| Add CHUBA to Watchlist: View: Get Complete CHUBA Trend Analysis ➞ | |
 | TLND Talend S.A. |
| Sector: Technology | |
| SubSector: Application Software | |
| MarketCap: 699.162 Millions | |
| Recent Price: 142.22 Smart Investing & Trading Score: 60 | |
| Day Percent Change: 2.82698% Day Change: -9999 | |
| Week Change: 115.616% Year-to-date Change: 0.0% | |
| TLND Links: Profile News Message Board | |
| Charts:- Daily , Weekly | |
| Add TLND to Watchlist: View: Get Complete TLND Trend Analysis ➞ | |
 | LYTS LSI Industries Inc |
| Sector: Technology | |
| SubSector: Electronic Components | |
| MarketCap: 698.8 Millions | |
| Recent Price: 22.47 Smart Investing & Trading Score: 40 | |
| Day Percent Change: -1.83486% Day Change: 1.1 | |
| Week Change: -3.35484% Year-to-date Change: 16.6% | |
| LYTS Links: Profile News Message Board | |
| Charts:- Daily , Weekly | |
| Add LYTS to Watchlist: View: Get Complete LYTS Trend Analysis ➞ | |
| For tabular summary view of above stock list: Summary View ➞ 0 - 25 , 25 - 50 , 50 - 75 , 75 - 100 , 100 - 125 , 125 - 150 , 150 - 175 , 175 - 200 , 200 - 225 , 225 - 250 , 250 - 275 , 275 - 300 , 300 - 325 , 325 - 350 , 350 - 375 , 375 - 400 , 400 - 425 , 425 - 450 , 450 - 475 , 475 - 500 , 500 - 525 , 525 - 550 , 550 - 575 , 575 - 600 , 600 - 625 , 625 - 650 , 650 - 675 , 675 - 700 , 700 - 725 , 725 - 750 , 750 - 775 , 775 - 800 , 800 - 825 , 825 - 850 , 850 - 875 , 875 - 900 | ||
| Click To Change The Sort Order: By Market Cap or Company Size Performance: Year-to-date, Week and Day | |
| Select Chart Type: | ||
|
Best Stocks Today 12Stocks.com |
© 2025 12Stocks.com Terms & Conditions Privacy Contact Us
All Information Provided Only For Education And Not To Be Used For Investing or Trading. See Terms & Conditions


One More Thing ... Get Best Stocks Delivered Daily!
Never Ever Miss A Move With Our Top Ten Stocks Lists
Find Best Stocks In Any Market - Bull or Bear Market
Take A Peek At Our Top Ten Stocks Lists: Daily, Weekly, Year-to-Date & Top Trends
Find Best Stocks In Any Market - Bull or Bear Market
Take A Peek At Our Top Ten Stocks Lists: Daily, Weekly, Year-to-Date & Top Trends
Technology Stocks With Best Up Trends [0-bearish to 100-bullish]: Sony [100], IBEX [100], IonQ [100], Bitdeer [100], Rigetti Computing[100], Kopin Corp[100], iHeartMedia [100], Grab [100], Truecar [100], AXT [100], Daktronics [100]
Best Technology Stocks Year-to-Date:
Pagaya [311.838%], Sify [281.373%], Xunlei [259.524%], EchoStar Corp[229.187%], CuriosityStream [222.645%], Viasat [220.567%], CommScope Holding[216.085%], Oneconnect Financial[196.708%], nLIGHT [175.673%], Dave [165.809%], Digital Turbine[162.5%] Best Technology Stocks This Week:
GTT [443626%], Barracuda Networks[71050%], Mobile TeleSystems[10483.5%], Nam Tai[5033.33%], Ebix [4200.85%], Fang [4150%], NantHealth [3114.02%], Hemisphere Media[2981.82%], Yandex N.V[2935.27%], Castlight Health[1751.96%], Benefitfocus [1254.48%] Best Technology Stocks Daily:
Sony [194.565%], IBEX [36.5069%], Wolfspeed [19.15%], Warner Bros.[18.55%], IonQ [18.1934%], Latch [16.6667%], Oclaro [14.734%], Bitdeer [14.4578%], Rigetti Computing[14.26%], Kopin Corp[12.4444%], Arqit Quantum[11.4196%]