
 Login Sign Up


| |||||
 |  | ||||

| 12Stocks.com Market Intelligence |
Best Tech Stocks
| In a hurry? Tech Stocks Lists: Performance & Trends, Stock Charts, FANG Stocks
Sort Tech stocks: Daily, Weekly, Year-to-Date, Market Cap & Trends. Filter Tech stocks list by size:All Tech Large Mid-Range Small and MicroCap |
| 12Stocks.com Tech Stocks Performances & Trends Daily | |||||||||
|
|  The overall Smart Investing & Trading Score is 100 (0-bearish to 100-bullish) which puts Technology sector in short term bullish trend. The Smart Investing & Trading Score from previous trading session is 90 and an improvement of trend continues.
| ||||||||
Here are the Smart Investing & Trading Scores of the most requested Technology stocks at 12Stocks.com (click stock name for detailed review):
|


| 12Stocks.com: Investing in Technology sector with Stocks | |
|
The following table helps investors and traders sort through current performance and trends (as measured by Smart Investing & Trading Score) of various
stocks in the Tech sector. Quick View: Move mouse or cursor over stock symbol (ticker) to view short-term technical chart and over stock name to view long term chart. Click on  to add stock symbol to your watchlist and to add stock symbol to your watchlist and  to view watchlist. Click on any ticker or stock name for detailed market intelligence report for that stock. to view watchlist. Click on any ticker or stock name for detailed market intelligence report for that stock. |
12Stocks.com Performance of Stocks in Tech Sector
| Ticker | Stock Name | Watchlist | Category | Recent Price | Smart Investing & Trading Score | Change % | YTD Change% |
| FIT | Fitbit |   | Instruments | 28.32 | 70 | 1.36% | 0.00% |
| OCLR | Oclaro | | Semiconductor | 8.41 | 30 | 14.73% | 0.00% |
| MITL | Mitel Networks | | Communication | 2.32 | 20 | 4.50% | 0.00% |
| TNAV | Telenav | | Internet | 19.98 | 80 | 0.45% | 0.00% |
| BSFT | BroadSoft | | Software | 18.39 | 40 | 0.00% | 0.00% |
| CLGX | CoreLogic | | IT | 80.00 | 20 | 0.00% | 0.00% |
| RP | RealPage | | Software | 12.89 | 40 | 0.31% | 0.00% |
| MSP | Datto Holding | | Software | 35.18 | 30 | 0.00% | 0.00% |
| IPHI | Inphi | | Semiconductor | 17.94 | 50 | 1.36% | 0.00% |
| QADA | QAD | | Software | 36.60 | 0 | -58.23% | 0.00% |
| NLSN | Nielsen | | IT | 27.98 | 20 | 0.00% | 0.00% |
| NPTN | NeoPhotonics | | Semiconductor | 13.00 | 0 | -0.08% | 0.00% |
| ELLI | Ellie Mae | | Software | 13.55 | 70 | -0.07% | 0.00% |
| NQ | NQ Mobile | | Software | 3.33 | 20 | -1.19% | 0.00% |
| WIFI | Boingo Wireless | | Communication | 38.61 | 100 | 4.10% | 0.00% |
| BITA | Bitauto | | Internet | 63.74 | 80 | -1.06% | 0.00% |
| INXN | InterXion Holding | | IT | 2.01 | 40 | 0.50% | 0.00% |
| CSOD | Cornerstone OnDemand | | Software | 62.26 | 80 | 1.82% | 0.00% |
| UBNT | Ubiquiti Networks | | Wireless | 358.84 | 60 | -2.51% | 0.00% |
| VCRA | Vocera | | Communication | 79.13 | 40 | 0.00% | 0.00% |
| TNGO | Tangoe | | Software | 0.91 | 10 | 1.11% | 0.00% |
| CARB | Carbonite | | Software | 13.02 | 0 | -0.31% | 0.00% |
| SPLK | Splunk | | Software | 217.18 | 80 | -0.51% | 0.00% |
| PFPT | Proofpoint | | Software | 37.68 | 30 | 7.08% | 0.00% |
| IMPV | Imperva | | Software | 57.69 | 70 | 2.23% | 0.00% |
| For chart view version of above stock list: Chart View ➞ 0 - 25 , 25 - 50 , 50 - 75 , 75 - 100 , 100 - 125 , 125 - 150 , 150 - 175 , 175 - 200 , 200 - 225 , 225 - 250 , 250 - 275 , 275 - 300 , 300 - 325 , 325 - 350 , 350 - 375 , 375 - 400 , 400 - 425 , 425 - 450 , 450 - 475 , 475 - 500 , 500 - 525 , 525 - 550 , 550 - 575 , 575 - 600 , 600 - 625 , 625 - 650 , 650 - 675 , 675 - 700 , 700 - 725 , 725 - 750 , 750 - 775 , 775 - 800 , 800 - 825 , 825 - 850 , 850 - 875 , 875 - 900 | ||
 | Click To Change The Sort Order: By Market Cap or Company Size Performance: Year-to-date, Week and Day |  |
|
Get the most comprehensive stock market coverage daily at 12Stocks.com ➞ Best Stocks Today ➞ Best Stocks Weekly ➞ Best Stocks Year-to-Date ➞ Best Stocks Trends ➞  Best Stocks Today 12Stocks.com Best Nasdaq Stocks ➞ Best S&P 500 Stocks ➞ Best Tech Stocks ➞ Best Biotech Stocks ➞ |
| Detailed Overview of Tech Stocks |
| Tech Technical Overview, Leaders & Laggards, Top Tech ETF Funds & Detailed Tech Stocks List, Charts, Trends & More |
| Tech Sector: Technical Analysis, Trends & YTD Performance | |
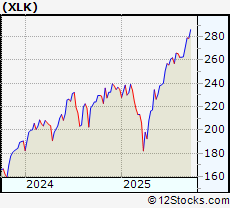
| Technology sector is composed of stocks
from semiconductors, software, web, social media
and services subsectors. Technology sector, as represented by XLK, an exchange-traded fund [ETF] that holds basket of tech stocks (e.g, Intel, Google) is up by 23.7823% and is currently outperforming the overall market by 9.0244% year-to-date. Below is a quick view of technical charts and trends: |
|
 XLK Weekly Chart |
|
| Long Term Trend: Very Good | |
| Medium Term Trend: Good | |
 XLK Daily Chart |
|
| Short Term Trend: Very Good | |
| Overall Trend Score: 100 | |
| YTD Performance: 23.7823% | |
| **Trend Scores & Views Are Only For Educational Purposes And Not For Investing | |
| 12Stocks.com: Top Performing Technology Sector Stocks | ||||||||||||||||||||||||||||||||||||||||||||||||
 The top performing Technology sector stocks year to date are
Now, more recently, over last week, the top performing Technology sector stocks on the move are


|
||||||||||||||||||||||||||||||||||||||||||||||||
| 12Stocks.com: Investing in Tech Sector using Exchange Traded Funds | |
|
The following table shows list of key exchange traded funds (ETF) that
help investors track Tech Index. For detailed view, check out our ETF Funds section of our website. Quick View: Move mouse or cursor over ETF symbol (ticker) to view short-term technical chart and over ETF name to view long term chart. Click on ticker or stock name for detailed view. Click on to add stock symbol to your watchlist and to view watchlist. |
12Stocks.com List of ETFs that track Tech Index
| Ticker | ETF Name | Watchlist | Recent Price | Smart Investing & Trading Score | Change % | Week % | Year-to-date % |
| IGN | Tech-Multimd Ntwk | | 53.86 | 40 | 0.918119 | -20.6435 | 0% |
| 12Stocks.com: Charts, Trends, Fundamental Data and Performances of Tech Stocks | |
|
We now take in-depth look at all Tech stocks including charts, multi-period performances and overall trends (as measured by Smart Investing & Trading Score). One can sort Tech stocks (click link to choose) by Daily, Weekly and by Year-to-Date performances. Also, one can sort by size of the company or by market capitalization. |
| Select Your Default Chart Type: | |||||
| |||||
| Click on stock symbol or name for detailed view. Click on to add stock symbol to your watchlist and to view watchlist. Quick View: Move mouse or cursor over "Daily" to quickly view daily technical stock chart and over "Weekly" to view weekly technical stock chart. | |||||


 | FIT Fitbit, Inc. |
| Sector: Technology | |
| SubSector: Scientific & Technical Instruments | |
| MarketCap: 1652.63 Millions | |
| Recent Price: 28.32 Smart Investing & Trading Score: 70 | |
| Day Percent Change: 1.36006% Day Change: -9999 | |
| Week Change: 1.14286% Year-to-date Change: 0.0% | |
| FIT Links: Profile News Message Board | |
| Charts:- Daily , Weekly | |
| Add FIT to Watchlist: View: Get Complete FIT Trend Analysis ➞ | |
 | OCLR Oclaro, Inc. |
| Sector: Technology | |
| SubSector: Semiconductor Equipment & Materials | |
| MarketCap: 1570 Millions | |
| Recent Price: 8.41 Smart Investing & Trading Score: 30 | |
| Day Percent Change: 14.734% Day Change: -9999 | |
| Week Change: -84.8904% Year-to-date Change: 0.0% | |
| OCLR Links: Profile News Message Board | |
| Charts:- Daily , Weekly | |
| Add OCLR to Watchlist: View: Get Complete OCLR Trend Analysis ➞ | |
 | MITL Mitel Networks Corporation |
| Sector: Technology | |
| SubSector: Communication Equipment | |
| MarketCap: 841.98 Millions | |
| Recent Price: 2.32 Smart Investing & Trading Score: 20 | |
| Day Percent Change: 4.5045% Day Change: -9999 | |
| Week Change: -93.7601% Year-to-date Change: 0.0% | |
| MITL Links: Profile News Message Board | |
| Charts:- Daily , Weekly | |
| Add MITL to Watchlist: View: Get Complete MITL Trend Analysis ➞ | |
 | TNAV Telenav, Inc. |
| Sector: Technology | |
| SubSector: Internet Software & Services | |
| MarketCap: 229.991 Millions | |
| Recent Price: 19.98 Smart Investing & Trading Score: 80 | |
| Day Percent Change: 0.452489% Day Change: -9999 | |
| Week Change: 598.601% Year-to-date Change: 0.0% | |
| TNAV Links: Profile News Message Board | |
| Charts:- Daily , Weekly | |
| Add TNAV to Watchlist: View: Get Complete TNAV Trend Analysis ➞ | |
 | BSFT BroadSoft, Inc. |
| Sector: Technology | |
| SubSector: Application Software | |
| MarketCap: 1297.94 Millions | |
| Recent Price: 18.39 Smart Investing & Trading Score: 40 | |
| Day Percent Change: 0% Day Change: -9999 | |
| Week Change: -12.8849% Year-to-date Change: 0.0% | |
| BSFT Links: Profile News Message Board | |
| Charts:- Daily , Weekly | |
| Add BSFT to Watchlist: View: Get Complete BSFT Trend Analysis ➞ | |
 | CLGX CoreLogic, Inc. |
| Sector: Technology | |
| SubSector: Information Technology Services | |
| MarketCap: 2427.48 Millions | |
| Recent Price: 80.00 Smart Investing & Trading Score: 20 | |
| Day Percent Change: 0% Day Change: -9999 | |
| Week Change: 0% Year-to-date Change: 0.0% | |
| CLGX Links: Profile News Message Board | |
| Charts:- Daily , Weekly | |
| Add CLGX to Watchlist: View: Get Complete CLGX Trend Analysis ➞ | |
 | RP RealPage, Inc. |
| Sector: Technology | |
| SubSector: Application Software | |
| MarketCap: 4674.12 Millions | |
| Recent Price: 12.89 Smart Investing & Trading Score: 40 | |
| Day Percent Change: 0.311284% Day Change: -9999 | |
| Week Change: -26.4269% Year-to-date Change: 0.0% | |
| RP Links: Profile News Message Board | |
| Charts:- Daily , Weekly | |
| Add RP to Watchlist: View: Get Complete RP Trend Analysis ➞ | |
 | MSP Datto Holding Corp. |
| Sector: Technology | |
| SubSector: Software Application | |
| MarketCap: 40987 Millions | |
| Recent Price: 35.18 Smart Investing & Trading Score: 30 | |
| Day Percent Change: 0% Day Change: -9999 | |
| Week Change: 0% Year-to-date Change: 0.0% | |
| MSP Links: Profile News Message Board | |
| Charts:- Daily , Weekly | |
| Add MSP to Watchlist: View: Get Complete MSP Trend Analysis ➞ | |
 | IPHI Inphi Corporation |
| Sector: Technology | |
| SubSector: Semiconductor - Broad Line | |
| MarketCap: 3015.02 Millions | |
| Recent Price: 17.94 Smart Investing & Trading Score: 50 | |
| Day Percent Change: 1.35593% Day Change: -9999 | |
| Week Change: 57.3684% Year-to-date Change: 0.0% | |
| IPHI Links: Profile News Message Board | |
| Charts:- Daily , Weekly | |
| Add IPHI to Watchlist: View: Get Complete IPHI Trend Analysis ➞ | |
 | QADA QAD Inc. |
| Sector: Technology | |
| SubSector: Application Software | |
| MarketCap: 714.762 Millions | |
| Recent Price: 36.60 Smart Investing & Trading Score: 0 | |
| Day Percent Change: -58.2335% Day Change: -9999 | |
| Week Change: -58.2335% Year-to-date Change: 0.0% | |
| QADA Links: Profile News Message Board | |
| Charts:- Daily , Weekly | |
| Add QADA to Watchlist: View: Get Complete QADA Trend Analysis ➞ | |
 | NLSN Nielsen Holdings plc |
| Sector: Technology | |
| SubSector: Information & Delivery Services | |
| MarketCap: 5487.07 Millions | |
| Recent Price: 27.98 Smart Investing & Trading Score: 20 | |
| Day Percent Change: 0% Day Change: -9999 | |
| Week Change: 0% Year-to-date Change: 0.0% | |
| NLSN Links: Profile News Message Board | |
| Charts:- Daily , Weekly | |
| Add NLSN to Watchlist: View: Get Complete NLSN Trend Analysis ➞ | |
 | NPTN NeoPhotonics Corporation |
| Sector: Technology | |
| SubSector: Semiconductor - Broad Line | |
| MarketCap: 291.842 Millions | |
| Recent Price: 13.00 Smart Investing & Trading Score: 0 | |
| Day Percent Change: -0.076864% Day Change: -9999 | |
| Week Change: -18.8007% Year-to-date Change: 0.0% | |
| NPTN Links: Profile News Message Board | |
| Charts:- Daily , Weekly | |
| Add NPTN to Watchlist: View: Get Complete NPTN Trend Analysis ➞ | |
 | ELLI Ellie Mae, Inc. |
| Sector: Technology | |
| SubSector: Application Software | |
| MarketCap: 3332.94 Millions | |
| Recent Price: 13.55 Smart Investing & Trading Score: 70 | |
| Day Percent Change: -0.0737463% Day Change: -9999 | |
| Week Change: 148.169% Year-to-date Change: 0.0% | |
| ELLI Links: Profile News Message Board | |
| Charts:- Daily , Weekly | |
| Add ELLI to Watchlist: View: Get Complete ELLI Trend Analysis ➞ | |
 | NQ NQ Mobile Inc. |
| Sector: Technology | |
| SubSector: Application Software | |
| MarketCap: 358.83 Millions | |
| Recent Price: 3.33 Smart Investing & Trading Score: 20 | |
| Day Percent Change: -1.18694% Day Change: -9999 | |
| Week Change: -5.9322% Year-to-date Change: 0.0% | |
| NQ Links: Profile News Message Board | |
| Charts:- Daily , Weekly | |
| Add NQ to Watchlist: View: Get Complete NQ Trend Analysis ➞ | |
 | WIFI Boingo Wireless, Inc. |
| Sector: Technology | |
| SubSector: Diversified Communication Services | |
| MarketCap: 479.864 Millions | |
| Recent Price: 38.61 Smart Investing & Trading Score: 100 | |
| Day Percent Change: 4.09814% Day Change: -9999 | |
| Week Change: 175.983% Year-to-date Change: 0.0% | |
| WIFI Links: Profile News Message Board | |
| Charts:- Daily , Weekly | |
| Add WIFI to Watchlist: View: Get Complete WIFI Trend Analysis ➞ | |
 | BITA Bitauto Holdings Limited |
| Sector: Technology | |
| SubSector: Internet Information Providers | |
| MarketCap: 827.98 Millions | |
| Recent Price: 63.74 Smart Investing & Trading Score: 80 | |
| Day Percent Change: -1.05557% Day Change: -9999 | |
| Week Change: 54.0358% Year-to-date Change: 0.0% | |
| BITA Links: Profile News Message Board | |
| Charts:- Daily , Weekly | |
| Add BITA to Watchlist: View: Get Complete BITA Trend Analysis ➞ | |
 | INXN InterXion Holding N.V. |
| Sector: Technology | |
| SubSector: Information Technology Services | |
| MarketCap: 5930.48 Millions | |
| Recent Price: 2.01 Smart Investing & Trading Score: 40 | |
| Day Percent Change: 0.5% Day Change: -9999 | |
| Week Change: -51.3317% Year-to-date Change: 0.0% | |
| INXN Links: Profile News Message Board | |
| Charts:- Daily , Weekly | |
| Add INXN to Watchlist: View: Get Complete INXN Trend Analysis ➞ | |
 | CSOD Cornerstone OnDemand, Inc. |
| Sector: Technology | |
| SubSector: Application Software | |
| MarketCap: 1717.82 Millions | |
| Recent Price: 62.26 Smart Investing & Trading Score: 80 | |
| Day Percent Change: 1.81521% Day Change: -9999 | |
| Week Change: 8.2971% Year-to-date Change: 0.0% | |
| CSOD Links: Profile News Message Board | |
| Charts:- Daily , Weekly | |
| Add CSOD to Watchlist: View: Get Complete CSOD Trend Analysis ➞ | |
 | UBNT Ubiquiti Networks, Inc. |
| Sector: Technology | |
| SubSector: Wireless Communications | |
| MarketCap: 4240.31 Millions | |
| Recent Price: 358.84 Smart Investing & Trading Score: 60 | |
| Day Percent Change: -2.51032% Day Change: -9999 | |
| Week Change: 64.8399% Year-to-date Change: 0.0% | |
| UBNT Links: Profile News Message Board | |
| Charts:- Daily , Weekly | |
| Add UBNT to Watchlist: View: Get Complete UBNT Trend Analysis ➞ | |
 | VCRA Vocera Communications, Inc. |
| Sector: Technology | |
| SubSector: Communication Equipment | |
| MarketCap: 639.139 Millions | |
| Recent Price: 79.13 Smart Investing & Trading Score: 40 | |
| Day Percent Change: 0% Day Change: -9999 | |
| Week Change: -0.0378979% Year-to-date Change: 0.0% | |
| VCRA Links: Profile News Message Board | |
| Charts:- Daily , Weekly | |
| Add VCRA to Watchlist: View: Get Complete VCRA Trend Analysis ➞ | |
 | TNGO Tangoe, Inc. |
| Sector: Technology | |
| SubSector: Business Software & Services | |
| MarketCap: 182.17 Millions | |
| Recent Price: 0.91 Smart Investing & Trading Score: 10 | |
| Day Percent Change: 1.11111% Day Change: -9999 | |
| Week Change: -69.4631% Year-to-date Change: 0.0% | |
| TNGO Links: Profile News Message Board | |
| Charts:- Daily , Weekly | |
| Add TNGO to Watchlist: View: Get Complete TNGO Trend Analysis ➞ | |
 | CARB Carbonite, Inc. |
| Sector: Technology | |
| SubSector: Business Software & Services | |
| MarketCap: 537.03 Millions | |
| Recent Price: 13.02 Smart Investing & Trading Score: 0 | |
| Day Percent Change: -0.306279% Day Change: -9999 | |
| Week Change: -72.4036% Year-to-date Change: 0.0% | |
| CARB Links: Profile News Message Board | |
| Charts:- Daily , Weekly | |
| Add CARB to Watchlist: View: Get Complete CARB Trend Analysis ➞ | |
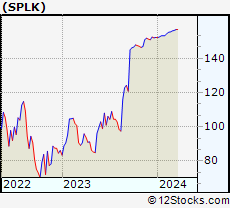 | SPLK Splunk Inc. |
| Sector: Technology | |
| SubSector: Application Software | |
| MarketCap: 19780.1 Millions | |
| Recent Price: 217.18 Smart Investing & Trading Score: 80 | |
| Day Percent Change: -0.508498% Day Change: -9999 | |
| Week Change: 38.7643% Year-to-date Change: 0.0% | |
| SPLK Links: Profile News Message Board | |
| Charts:- Daily , Weekly | |
| Add SPLK to Watchlist: View: Get Complete SPLK Trend Analysis ➞ | |
 | PFPT Proofpoint, Inc. |
| Sector: Technology | |
| SubSector: Application Software | |
| MarketCap: 6180.22 Millions | |
| Recent Price: 37.68 Smart Investing & Trading Score: 30 | |
| Day Percent Change: 7.07587% Day Change: -9999 | |
| Week Change: -78.5787% Year-to-date Change: 0.0% | |
| PFPT Links: Profile News Message Board | |
| Charts:- Daily , Weekly | |
| Add PFPT to Watchlist: View: Get Complete PFPT Trend Analysis ➞ | |
 | IMPV Imperva, Inc. |
| Sector: Technology | |
| SubSector: Application Software | |
| MarketCap: 1384.32 Millions | |
| Recent Price: 57.69 Smart Investing & Trading Score: 70 | |
| Day Percent Change: 2.23285% Day Change: -9999 | |
| Week Change: 315.934% Year-to-date Change: 0.0% | |
| IMPV Links: Profile News Message Board | |
| Charts:- Daily , Weekly | |
| Add IMPV to Watchlist: View: Get Complete IMPV Trend Analysis ➞ | |
| For tabular summary view of above stock list: Summary View ➞ 0 - 25 , 25 - 50 , 50 - 75 , 75 - 100 , 100 - 125 , 125 - 150 , 150 - 175 , 175 - 200 , 200 - 225 , 225 - 250 , 250 - 275 , 275 - 300 , 300 - 325 , 325 - 350 , 350 - 375 , 375 - 400 , 400 - 425 , 425 - 450 , 450 - 475 , 475 - 500 , 500 - 525 , 525 - 550 , 550 - 575 , 575 - 600 , 600 - 625 , 625 - 650 , 650 - 675 , 675 - 700 , 700 - 725 , 725 - 750 , 750 - 775 , 775 - 800 , 800 - 825 , 825 - 850 , 850 - 875 , 875 - 900 | ||
| Click To Change The Sort Order: By Market Cap or Company Size Performance: Year-to-date, Week and Day | |
| Select Chart Type: | ||
|
Best Stocks Today 12Stocks.com |
© 2025 12Stocks.com Terms & Conditions Privacy Contact Us
All Information Provided Only For Education And Not To Be Used For Investing or Trading. See Terms & Conditions


One More Thing ... Get Best Stocks Delivered Daily!
Never Ever Miss A Move With Our Top Ten Stocks Lists
Find Best Stocks In Any Market - Bull or Bear Market
Take A Peek At Our Top Ten Stocks Lists: Daily, Weekly, Year-to-Date & Top Trends
Find Best Stocks In Any Market - Bull or Bear Market
Take A Peek At Our Top Ten Stocks Lists: Daily, Weekly, Year-to-Date & Top Trends
Technology Stocks With Best Up Trends [0-bearish to 100-bullish]: Sony [100], Bakkt [100], Rigetti Computing[100], Fair Isaac[100], Arqit Quantum[100], D-Wave Quantum[100], Navitas Semiconductor[100], Shoals [100], Vuzix [100], Arteris [100], Lantronix [100]
Best Technology Stocks Year-to-Date:
Xunlei [370.476%], Sify [315.033%], Wolfspeed [307.01%], Digital Turbine[265.057%], EchoStar Corp[247.253%], CuriosityStream [241.605%], Viasat [224.029%], Pagaya [222.638%], Oneconnect Financial[209.053%], D-Wave Quantum[203.954%], CommScope Holding[203.101%] Best Technology Stocks This Week:
GTT [443626%], Barracuda Networks[71050%], Mobile TeleSystems[10483.5%], Nam Tai[5033.33%], Ebix [4200.85%], Fang [4150%], NantHealth [3114.02%], Hemisphere Media[2981.82%], Yandex N.V[2935.27%], Wolfspeed [1961.98%], Castlight Health[1751.96%] Best Technology Stocks Daily:
Sony [194.565%], Bakkt [28.6091%], Rigetti Computing[18.4925%], Fair Isaac[17.979%], Arqit Quantum[17.9369%], Marti [17%], Latch [16.6667%], Oclaro [14.734%], D-Wave Quantum[13.968%], Arbe Robotics[13.0178%], Navitas Semiconductor[12.3288%]