
 Login Sign Up


| |||||
 |  | ||||

| 12Stocks.com Market Intelligence |
Best SmallCap Stocks
|
| In a hurry? Small Cap Stock Lists: Performance Trends Table, Stock Charts
Sort Small Cap stocks: Daily, Weekly, Year-to-Date, Market Cap & Trends. Filter Small Cap stocks list by sector: Show all, Tech, Finance, Energy, Staples, Retail, Industrial, Materials, Utilities and HealthCare Filter Small Cap stocks list by size: All Large Medium Small and MicroCap |
| 12Stocks.com Small Cap Stocks Performances & Trends Daily | |||||||||
|
|  The overall Smart Investing & Trading Score is 76 (0-bearish to 100-bullish) which puts Small Cap index in short term neutral to bullish trend. The Smart Investing & Trading Score from previous trading session is 90 and hence a deterioration of trend.
| ||||||||
Here are the Smart Investing & Trading Scores of the most requested small cap stocks at 12Stocks.com (click stock name for detailed review):
|


| 12Stocks.com: Investing in Smallcap Index with Stocks | |
|
The following table helps investors and traders sort through current performance and trends (as measured by Smart Investing & Trading Score) of various
stocks in the Smallcap Index. Quick View: Move mouse or cursor over stock symbol (ticker) to view short-term technical chart and over stock name to view long term chart. Click on  to add stock symbol to your watchlist and to add stock symbol to your watchlist and  to view watchlist. Click on any ticker or stock name for detailed market intelligence report for that stock. to view watchlist. Click on any ticker or stock name for detailed market intelligence report for that stock. |
12Stocks.com Performance of Stocks in Smallcap Index
| Ticker | Stock Name | Watchlist | Category | Recent Price | Smart Investing & Trading Score | Change % | YTD Change% |
| PL | Planet Labs |   | Industrials | 1.96 | 30 | -3.45% | -20.97% |
| SHCR | Sharecare | | Health Care | 0.86 | 74 | 9.12% | -21.12% |
| COOK | Traeger | | Services & Goods | 2.20 | 20 | -3.93% | -22.12% |
| BKE | Buckle | | Services & Goods | 36.98 | 0 | -0.51% | -22.18% |
| NFBK | Northfield Bancorp | | Financials | 9.75 | 69 | 1.56% | -22.50% |
| ETNB | 89bio | | Health Care | 8.63 | 25 | -3.79% | -22.74% |
| WEAV | Weave | | Technology | 8.97 | 42 | -1.75% | -22.81% |
| RCKT | Rocket | | Health Care | 22.62 | 25 | -3.33% | -24.52% |
| HCAT | Health Catalyst | | Technology | 6.95 | 59 | -1.14% | -24.95% |
| KREF | KKR Real | | Financials | 9.88 | 100 | 0.41% | -25.32% |
| CCSI | Consensus Cloud | | Technology | 19.72 | 75 | 3.68% | -25.96% |
| OABI | OmniAb | | Health Care | 4.45 | 17 | -2.20% | -26.57% |
| VREX | Varex Imaging | | Health Care | 14.97 | 0 | -1.77% | -26.98% |
| IMVT | Immunovant | | Health Care | 30.70 | 47 | -2.48% | -27.13% |
| TBI | TrueBlue | | Services & Goods | 11.17 | 57 | -1.24% | -27.18% |
| CYTK | Cytokinetics | | Health Care | 59.53 | 18 | -0.65% | -28.70% |
| SES | SES AI | | Services & Goods | 1.26 | 0 | -0.79% | -29.61% |
| AMPH | Amphastar | | Health Care | 43.48 | 57 | 1.73% | -29.70% |
| TCX | Tucows | | Technology | 18.97 | 55 | 0.53% | -29.74% |
| IAUX | i-80 Gold | | Materials | 1.22 | 37 | 2.52% | -30.29% |
| JOUT | Johnson Outdoors | | Consumer Staples | 36.94 | 10 | -1.73% | -30.85% |
| UNFI | United Natural | | Consumer Staples | 11.21 | 69 | 1.54% | -30.93% |
| EGBN | Eagle Bancorp | | Financials | 20.72 | 74 | 0.10% | -31.25% |
| UHG | United Homes | | Services & Goods | 5.76 | 10 | -4.16% | -31.35% |
| KRNY | Kearny Financial | | Financials | 6.09 | 74 | 1.08% | -32.11% |
| For chart view version of above stock list: Chart View ➞ 0 - 25 , 25 - 50 , 50 - 75 , 75 - 100 , 100 - 125 , 125 - 150 , 150 - 175 , 175 - 200 , 200 - 225 , 225 - 250 , 250 - 275 , 275 - 300 , 300 - 325 , 325 - 350 | ||
 | Click To Change The Sort Order: By Market Cap or Company Size Performance: Year-to-date, Week and Day |  |
| Too many stocks? View smallcap stocks filtered by marketcap & sector |
| Marketcap: All SmallCap Stocks (default-no microcap), Large, Mid-Range, Small |
| Smallcap Sector: Tech, Finance, Energy, Staples, Retail, Industrial, Materials, & Medical |
|
Get the most comprehensive stock market coverage daily at 12Stocks.com ➞ Best Stocks Today ➞ Best Stocks Weekly ➞ Best Stocks Year-to-Date ➞ Best Stocks Trends ➞  Best Stocks Today 12Stocks.com Best Nasdaq Stocks ➞ Best S&P 500 Stocks ➞ Best Tech Stocks ➞ Best Biotech Stocks ➞ |
| Detailed Overview of SmallCap Stocks |
| SmallCap Technical Overview, Leaders & Laggards, Top SmallCap ETF Funds & Detailed SmallCap Stocks List, Charts, Trends & More |
| Smallcap: Technical Analysis, Trends & YTD Performance | |
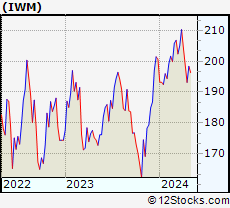
| SmallCap segment as represented by
IWM, an exchange-traded fund [ETF], holds basket of thousands of smallcap stocks from across all major sectors of the US stock market. The smallcap index (contains stocks like Riverbed & Sotheby's) is up by 3.67% and is currently underperforming the overall market by -6.9% year-to-date. Below is a quick view of technical charts and trends: | |
 IWM Weekly Chart |
|
| Long Term Trend: Very Good | |
| Medium Term Trend: Very Good | |
 IWM Daily Chart |
|
| Short Term Trend: Good | |
| Overall Trend Score: 76 | |
| YTD Performance: 3.67% | |
| **Trend Scores & Views Are Only For Educational Purposes And Not For Investing | |
| 12Stocks.com: Top Performing Small Cap Index Stocks | ||||||||||||||||||||||||||||||||||||||||||||||||
 The top performing Small Cap Index stocks year to date are
Now, more recently, over last week, the top performing Small Cap Index stocks on the move are


|
||||||||||||||||||||||||||||||||||||||||||||||||
| 12Stocks.com: Investing in Smallcap Index using Exchange Traded Funds | |
|
The following table shows list of key exchange traded funds (ETF) that
help investors track Smallcap index. The following list also includes leveraged ETF funds that track twice or thrice the daily returns of Smallcap indices. Short or inverse ETF funds move in the opposite direction to the index they track and are useful during market pullbacks or during bear markets. Quick View: Move mouse or cursor over ETF symbol (ticker) to view short-term technical chart and over ETF name to view long term chart. Click on ticker or stock name for detailed view. Click on to add stock symbol to your watchlist and to view watchlist. |
12Stocks.com List of ETFs that track Smallcap Index
| Ticker | ETF Name | Watchlist | Recent Price | Smart Investing & Trading Score | Change % | Week % | Year-to-date % |
| IWM | iShares Russell 2000 | | 208.08 | 76 | 0.07 | 1.85 | 3.67% |
| VTWO | Vanguard Russell 2000 ETF | | 84.11 | 71 | 0.00 | 1.8 | 3.71% |
| IJR | iShares Core S&P Small-Cap | | 110.39 | 68 | -0.22 | 1.29 | 1.98% |
| IWN | iShares Russell 2000 Value | | 158.71 | 76 | -0.07 | 1.61 | 2.18% |
| IWO | iShares Russell 2000 Growth | | 265.15 | 63 | -0.75 | 2.01 | 5.13% |
| IJS | iShares S&P Small-Cap 600 Value | | 101.87 | 76 | -0.15 | 1.34 | -1.16% |
| IJT | iShares S&P Small-Cap 600 Growth | | 131.34 | 71 | 0.04 | 1.14 | 4.95% |
| XSLV | PowerShares S&P SmallCap Low Volatil ETF | | 44.48 | 83 | -0.01 | 0.55 | 0.74% |
| SAA | ProShares Ultra SmallCap600 | | 24.90 | 71 | 0.50 | 2.28 | -0.18% |
| SMLV | SPDR SSGA US Small Cap Low Volatil ETF | | 113.28 | 95 | 0.43 | 1.85 | 0.68% |
| SDD | ProShares UltraShort SmallCap600 | | 17.84 | 35 | 0.96 | -2.41 | -3.19% |
| SBB | ProShares Short SmallCap600 | | 15.77 | 25 | 0.41 | -1.14 | -0.98% |
| 12Stocks.com: Charts, Trends, Fundamental Data and Performances of SmallCap Stocks | |
|
We now take in-depth look at all SmallCap stocks including charts, multi-period performances and overall trends (as measured by Smart Investing & Trading Score). One can sort SmallCap stocks (click link to choose) by Daily, Weekly and by Year-to-Date performances. Also, one can sort by size of the company or by market capitalization. |
| Select Your Default Chart Type: | |||||
| |||||
| Click on stock symbol or name for detailed view. Click on to add stock symbol to your watchlist and to view watchlist. Quick View: Move mouse or cursor over "Daily" to quickly view daily technical stock chart and over "Weekly" to view weekly technical stock chart. | |||||

 | PL Planet Labs PBC |
| Sector: Industrials | |
| SubSector: Aerospace & Defense | |
| MarketCap: 874 Millions | |
| Recent Price: 1.96 Smart Investing & Trading Score: 30 | |
| Day Percent Change: -3.45% Day Change: -0.07 | |
| Week Change: 1.03% Year-to-date Change: -21.0% | |
| PL Links: Profile News Message Board | |
| Charts:- Daily , Weekly | |
| Add PL to Watchlist: View: Get Complete PL Trend Analysis ➞ | |
 | SHCR Sharecare, Inc. |
| Sector: Health Care | |
| SubSector: Health Information Services | |
| MarketCap: 640 Millions | |
| Recent Price: 0.86 Smart Investing & Trading Score: 74 | |
| Day Percent Change: 9.12% Day Change: 0.07 | |
| Week Change: 10.88% Year-to-date Change: -21.1% | |
| SHCR Links: Profile News Message Board | |
| Charts:- Daily , Weekly | |
| Add SHCR to Watchlist: View: Get Complete SHCR Trend Analysis ➞ | |
 | COOK Traeger, Inc. |
| Sector: Services & Goods | |
| SubSector: Furnishings, Fixtures & Appliances | |
| MarketCap: 524 Millions | |
| Recent Price: 2.20 Smart Investing & Trading Score: 20 | |
| Day Percent Change: -3.93% Day Change: -0.09 | |
| Week Change: -5.58% Year-to-date Change: -22.1% | |
| COOK Links: Profile News Message Board | |
| Charts:- Daily , Weekly | |
| Add COOK to Watchlist: View: Get Complete COOK Trend Analysis ➞ | |
 | BKE The Buckle, Inc. |
| Sector: Services & Goods | |
| SubSector: Apparel Stores | |
| MarketCap: 913.808 Millions | |
| Recent Price: 36.98 Smart Investing & Trading Score: 0 | |
| Day Percent Change: -0.51% Day Change: -0.19 | |
| Week Change: -4.69% Year-to-date Change: -22.2% | |
| BKE Links: Profile News Message Board | |
| Charts:- Daily , Weekly | |
| Add BKE to Watchlist: View: Get Complete BKE Trend Analysis ➞ | |
 | NFBK Northfield Bancorp, Inc. (Staten Island, NY) |
| Sector: Financials | |
| SubSector: Regional - Northeast Banks | |
| MarketCap: 540.699 Millions | |
| Recent Price: 9.75 Smart Investing & Trading Score: 69 | |
| Day Percent Change: 1.56% Day Change: 0.15 | |
| Week Change: 3.61% Year-to-date Change: -22.5% | |
| NFBK Links: Profile News Message Board | |
| Charts:- Daily , Weekly | |
| Add NFBK to Watchlist: View: Get Complete NFBK Trend Analysis ➞ | |
 | ETNB 89bio, Inc. |
| Sector: Health Care | |
| SubSector: Biotechnology | |
| MarketCap: 517.485 Millions | |
| Recent Price: 8.63 Smart Investing & Trading Score: 25 | |
| Day Percent Change: -3.79% Day Change: -0.34 | |
| Week Change: -0.8% Year-to-date Change: -22.7% | |
| ETNB Links: Profile News Message Board | |
| Charts:- Daily , Weekly | |
| Add ETNB to Watchlist: View: Get Complete ETNB Trend Analysis ➞ | |
 | WEAV Weave Communications, Inc. |
| Sector: Technology | |
| SubSector: Software - Application | |
| MarketCap: 740 Millions | |
| Recent Price: 8.97 Smart Investing & Trading Score: 42 | |
| Day Percent Change: -1.75% Day Change: -0.16 | |
| Week Change: 1.01% Year-to-date Change: -22.8% | |
| WEAV Links: Profile News Message Board | |
| Charts:- Daily , Weekly | |
| Add WEAV to Watchlist: View: Get Complete WEAV Trend Analysis ➞ | |
 | RCKT Rocket Pharmaceuticals, Inc. |
| Sector: Health Care | |
| SubSector: Biotechnology | |
| MarketCap: 899.585 Millions | |
| Recent Price: 22.62 Smart Investing & Trading Score: 25 | |
| Day Percent Change: -3.33% Day Change: -0.78 | |
| Week Change: -1.91% Year-to-date Change: -24.5% | |
| RCKT Links: Profile News Message Board | |
| Charts:- Daily , Weekly | |
| Add RCKT to Watchlist: View: Get Complete RCKT Trend Analysis ➞ | |
 | HCAT Health Catalyst, Inc. |
| Sector: Technology | |
| SubSector: Healthcare Information Services | |
| MarketCap: 983.955 Millions | |
| Recent Price: 6.95 Smart Investing & Trading Score: 59 | |
| Day Percent Change: -1.14% Day Change: -0.08 | |
| Week Change: 9.79% Year-to-date Change: -25.0% | |
| HCAT Links: Profile News Message Board | |
| Charts:- Daily , Weekly | |
| Add HCAT to Watchlist: View: Get Complete HCAT Trend Analysis ➞ | |
 | KREF KKR Real Estate Finance Trust Inc. |
| Sector: Financials | |
| SubSector: Mortgage Investment | |
| MarketCap: 645.939 Millions | |
| Recent Price: 9.88 Smart Investing & Trading Score: 100 | |
| Day Percent Change: 0.41% Day Change: 0.04 | |
| Week Change: 3.46% Year-to-date Change: -25.3% | |
| KREF Links: Profile News Message Board | |
| Charts:- Daily , Weekly | |
| Add KREF to Watchlist: View: Get Complete KREF Trend Analysis ➞ | |
 | CCSI Consensus Cloud Solutions, Inc. |
| Sector: Technology | |
| SubSector: Software - Infrastructure | |
| MarketCap: 609 Millions | |
| Recent Price: 19.72 Smart Investing & Trading Score: 75 | |
| Day Percent Change: 3.68% Day Change: 0.70 | |
| Week Change: 3.19% Year-to-date Change: -26.0% | |
| CCSI Links: Profile News Message Board | |
| Charts:- Daily , Weekly | |
| Add CCSI to Watchlist: View: Get Complete CCSI Trend Analysis ➞ | |
 | OABI OmniAb, Inc. |
| Sector: Health Care | |
| SubSector: Biotechnology | |
| MarketCap: 570 Millions | |
| Recent Price: 4.45 Smart Investing & Trading Score: 17 | |
| Day Percent Change: -2.20% Day Change: -0.10 | |
| Week Change: -4.91% Year-to-date Change: -26.6% | |
| OABI Links: Profile News Message Board | |
| Charts:- Daily , Weekly | |
| Add OABI to Watchlist: View: Get Complete OABI Trend Analysis ➞ | |
 | VREX Varex Imaging Corporation |
| Sector: Health Care | |
| SubSector: Medical Appliances & Equipment | |
| MarketCap: 718.78 Millions | |
| Recent Price: 14.97 Smart Investing & Trading Score: 0 | |
| Day Percent Change: -1.77% Day Change: -0.27 | |
| Week Change: -2.54% Year-to-date Change: -27.0% | |
| VREX Links: Profile News Message Board | |
| Charts:- Daily , Weekly | |
| Add VREX to Watchlist: View: Get Complete VREX Trend Analysis ➞ | |
 | IMVT Immunovant, Inc. |
| Sector: Health Care | |
| SubSector: Biotechnology | |
| MarketCap: 552.885 Millions | |
| Recent Price: 30.70 Smart Investing & Trading Score: 47 | |
| Day Percent Change: -2.48% Day Change: -0.78 | |
| Week Change: 3.28% Year-to-date Change: -27.1% | |
| IMVT Links: Profile News Message Board | |
| Charts:- Daily , Weekly | |
| Add IMVT to Watchlist: View: Get Complete IMVT Trend Analysis ➞ | |
 | TBI TrueBlue, Inc. |
| Sector: Services & Goods | |
| SubSector: Staffing & Outsourcing Services | |
| MarketCap: 563.228 Millions | |
| Recent Price: 11.17 Smart Investing & Trading Score: 57 | |
| Day Percent Change: -1.24% Day Change: -0.14 | |
| Week Change: 3.23% Year-to-date Change: -27.2% | |
| TBI Links: Profile News Message Board | |
| Charts:- Daily , Weekly | |
| Add TBI to Watchlist: View: Get Complete TBI Trend Analysis ➞ | |
 | CYTK Cytokinetics, Incorporated |
| Sector: Health Care | |
| SubSector: Biotechnology | |
| MarketCap: 654.285 Millions | |
| Recent Price: 59.53 Smart Investing & Trading Score: 18 | |
| Day Percent Change: -0.65% Day Change: -0.39 | |
| Week Change: -4.14% Year-to-date Change: -28.7% | |
| CYTK Links: Profile News Message Board | |
| Charts:- Daily , Weekly | |
| Add CYTK to Watchlist: View: Get Complete CYTK Trend Analysis ➞ | |
 | SES SES AI Corporation |
| Sector: Services & Goods | |
| SubSector: Auto Parts | |
| MarketCap: 893 Millions | |
| Recent Price: 1.26 Smart Investing & Trading Score: 0 | |
| Day Percent Change: -0.79% Day Change: -0.01 | |
| Week Change: -13.1% Year-to-date Change: -29.6% | |
| SES Links: Profile News Message Board | |
| Charts:- Daily , Weekly | |
| Add SES to Watchlist: View: Get Complete SES Trend Analysis ➞ | |
 | AMPH Amphastar Pharmaceuticals, Inc. |
| Sector: Health Care | |
| SubSector: Drug Manufacturers - Other | |
| MarketCap: 655.533 Millions | |
| Recent Price: 43.48 Smart Investing & Trading Score: 57 | |
| Day Percent Change: 1.73% Day Change: 0.74 | |
| Week Change: 3.01% Year-to-date Change: -29.7% | |
| AMPH Links: Profile News Message Board | |
| Charts:- Daily , Weekly | |
| Add AMPH to Watchlist: View: Get Complete AMPH Trend Analysis ➞ | |
 | TCX Tucows Inc. |
| Sector: Technology | |
| SubSector: Internet Information Providers | |
| MarketCap: 557.78 Millions | |
| Recent Price: 18.97 Smart Investing & Trading Score: 55 | |
| Day Percent Change: 0.53% Day Change: 0.10 | |
| Week Change: 4.72% Year-to-date Change: -29.7% | |
| TCX Links: Profile News Message Board | |
| Charts:- Daily , Weekly | |
| Add TCX to Watchlist: View: Get Complete TCX Trend Analysis ➞ | |
 | IAUX i-80 Gold Corp. |
| Sector: Materials | |
| SubSector: Gold | |
| MarketCap: 616 Millions | |
| Recent Price: 1.22 Smart Investing & Trading Score: 37 | |
| Day Percent Change: 2.52% Day Change: 0.03 | |
| Week Change: 3.39% Year-to-date Change: -30.3% | |
| IAUX Links: Profile News Message Board | |
| Charts:- Daily , Weekly | |
| Add IAUX to Watchlist: View: Get Complete IAUX Trend Analysis ➞ | |
 | JOUT Johnson Outdoors Inc. |
| Sector: Consumer Staples | |
| SubSector: Sporting Goods | |
| MarketCap: 572.844 Millions | |
| Recent Price: 36.94 Smart Investing & Trading Score: 10 | |
| Day Percent Change: -1.73% Day Change: -0.65 | |
| Week Change: -1.96% Year-to-date Change: -30.9% | |
| JOUT Links: Profile News Message Board | |
| Charts:- Daily , Weekly | |
| Add JOUT to Watchlist: View: Get Complete JOUT Trend Analysis ➞ | |
 | UNFI United Natural Foods, Inc. |
| Sector: Consumer Staples | |
| SubSector: Food Wholesale | |
| MarketCap: 746.329 Millions | |
| Recent Price: 11.21 Smart Investing & Trading Score: 69 | |
| Day Percent Change: 1.54% Day Change: 0.17 | |
| Week Change: 11.21% Year-to-date Change: -30.9% | |
| UNFI Links: Profile News Message Board | |
| Charts:- Daily , Weekly | |
| Add UNFI to Watchlist: View: Get Complete UNFI Trend Analysis ➞ | |
 | EGBN Eagle Bancorp, Inc. |
| Sector: Financials | |
| SubSector: Regional - Mid-Atlantic Banks | |
| MarketCap: 906.559 Millions | |
| Recent Price: 20.72 Smart Investing & Trading Score: 74 | |
| Day Percent Change: 0.10% Day Change: 0.02 | |
| Week Change: 3.91% Year-to-date Change: -31.3% | |
| EGBN Links: Profile News Message Board | |
| Charts:- Daily , Weekly | |
| Add EGBN to Watchlist: View: Get Complete EGBN Trend Analysis ➞ | |
 | UHG United Homes Group, Inc. |
| Sector: Services & Goods | |
| SubSector: Residential Construction | |
| MarketCap: 566 Millions | |
| Recent Price: 5.76 Smart Investing & Trading Score: 10 | |
| Day Percent Change: -4.16% Day Change: -0.25 | |
| Week Change: -15.29% Year-to-date Change: -31.4% | |
| UHG Links: Profile News Message Board | |
| Charts:- Daily , Weekly | |
| Add UHG to Watchlist: View: Get Complete UHG Trend Analysis ➞ | |
 | KRNY Kearny Financial Corp. |
| Sector: Financials | |
| SubSector: Savings & Loans | |
| MarketCap: 781.73 Millions | |
| Recent Price: 6.09 Smart Investing & Trading Score: 74 | |
| Day Percent Change: 1.08% Day Change: 0.06 | |
| Week Change: 7.98% Year-to-date Change: -32.1% | |
| KRNY Links: Profile News Message Board | |
| Charts:- Daily , Weekly | |
| Add KRNY to Watchlist: View: Get Complete KRNY Trend Analysis ➞ | |
| For tabular summary view of above stock list: Summary View ➞ 0 - 25 , 25 - 50 , 50 - 75 , 75 - 100 , 100 - 125 , 125 - 150 , 150 - 175 , 175 - 200 , 200 - 225 , 225 - 250 , 250 - 275 , 275 - 300 , 300 - 325 , 325 - 350 | ||
| Click To Change The Sort Order: By Market Cap or Company Size Performance: Year-to-date, Week and Day | |
| Select Chart Type: | ||
| Too many stocks? View smallcap stocks filtered by marketcap & sector |
| Marketcap: All SmallCap Stocks (default-no microcap), Large, Mid-Range, Small & MicroCap |
| Sector: Tech, Finance, Energy, Staples, Retail, Industrial, Materials, Utilities & Medical |
|
Best Stocks Today 12Stocks.com |
© 2024 12Stocks.com Terms & Conditions Privacy Contact Us
All Information Provided Only For Education And Not To Be Used For Investing or Trading. See Terms & Conditions


One More Thing ... Get Best Stocks Delivered Daily!
Never Ever Miss A Move With Our Top Ten Stocks Lists
Find Best Stocks In Any Market - Bull or Bear Market
Take A Peek At Our Top Ten Stocks Lists: Daily, Weekly, Year-to-Date & Top Trends
Find Best Stocks In Any Market - Bull or Bear Market
Take A Peek At Our Top Ten Stocks Lists: Daily, Weekly, Year-to-Date & Top Trends
Smallcap Stocks With Best Up Trends [0-bearish to 100-bullish]: CommScope Holding[100], Coeur Mining[100], Hecla Mining[100], MicroStrategy [100], Enovix [100], Rayonier Advanced[100], Nurix [100], Energy Fuels[100], NovaGold Resources[100], Piedmont Lithium[100], Wave Life[100]
Best Smallcap Stocks Year-to-Date:
CareMax [495.88%], Bakkt [413.9%], Janux [338.34%], Viking [260.02%], Alpine Immune[241.23%], Longboard [238.63%], Avidity Biosciences[226.33%], Super Micro[212.35%], Arcutis Bio[184.83%], Sweetgreen [180.97%], Novavax [171.04%] Best Smallcap Stocks This Week:
Vaxxinity [58.82%], Novavax [46.51%], Vicarious Surgical[45.62%], Harrow Health[44.48%], ProKidney [44.31%], Workhorse Group[36.06%], Maxeon Solar[35.94%], Fossil Group[35.44%], Humacyte [34.68%], MicroStrategy [34.23%], Cadiz [33.48%] Best Smallcap Stocks Daily:
Vaxxinity [45.95%], Presto Automation[31.90%], Vicarious Surgical[27.93%], Orchestra BioMed[12.77%], CommScope Holding[11.86%], Coeur Mining[11.57%], Hecla Mining[11.11%], MicroStrategy [10.04%], Tenaya [9.65%], Bakkt [9.25%], Enovix [9.25%]