
 Login Sign Up


| |||||
 |  | ||||

| 12Stocks.com Market Intelligence |
Best SmallCap Stocks
|
| In a hurry? Small Cap Stock Lists: Performance Trends Table, Stock Charts
Sort Small Cap stocks: Daily, Weekly, Year-to-Date, Market Cap & Trends. Filter Small Cap stocks list by sector: Show all, Tech, Finance, Energy, Staples, Retail, Industrial, Materials, Utilities and HealthCare Filter Small Cap stocks list by size: All Large Medium Small and MicroCap |
| 12Stocks.com Small Cap Stocks Performances & Trends Daily | |||||||||
|
|  The overall Smart Investing & Trading Score is 49 (0-bearish to 100-bullish) which puts Small Cap index in short term neutral trend. The Smart Investing & Trading Score from previous trading session is 14 and hence an improvement of trend.
| ||||||||
Here are the Smart Investing & Trading Scores of the most requested small cap stocks at 12Stocks.com (click stock name for detailed review):
|


| 12Stocks.com: Investing in Smallcap Index with Stocks | |
|
The following table helps investors and traders sort through current performance and trends (as measured by Smart Investing & Trading Score) of various
stocks in the Smallcap Index. Quick View: Move mouse or cursor over stock symbol (ticker) to view short-term technical chart and over stock name to view long term chart. Click on  to add stock symbol to your watchlist and to add stock symbol to your watchlist and  to view watchlist. Click on any ticker or stock name for detailed market intelligence report for that stock. to view watchlist. Click on any ticker or stock name for detailed market intelligence report for that stock. |
12Stocks.com Performance of Stocks in Smallcap Index
| Ticker | Stock Name | Watchlist | Category | Recent Price | Smart Investing & Trading Score | Change % | YTD Change% |
| BARK | BARK |   | Services & Goods | 1.16 | 54 | 0.87% | 44.96% |
| RPHM | Reneo | | Health Care | 1.74 | 100 | 2.35% | 7.41% |
| KOP | Koppers | | Materials | 52.91 | 17 | 1.07% | 3.30% |
| NVEC | NVE | | Technology | 79.48 | 14 | -2.35% | 1.34% |
| ACNB | ACNB | | Financials | 33.20 | 57 | 0.21% | -25.83% |
| DFIN | Donnelley Financial | | Services & Goods | 62.42 | 0 | 4.85% | 0.08% |
| PKE | Park Aerospace | | Technology | 14.44 | 10 | 0.42% | -1.77% |
| SMMF | Summit Financial | | Financials | 25.84 | 15 | -1.97% | -15.80% |
| GERN | Geron | | Health Care | 3.94 | 70 | -3.43% | 86.73% |
| GLRE | Greenlight Capital | | Financials | 12.54 | 77 | -0.71% | 9.81% |
| OSW | OneSpaWorld | | Services & Goods | 14.85 | 100 | 3.85% | 5.32% |
| OPFI | OppFi | | Financials | 2.78 | 42 | 2.58% | -45.60% |
| RLYB | Rallybio | | Health Care | 1.84 | 37 | -3.41% | -22.03% |
| MASS | 908 Devices | | Health Care | 5.64 | 17 | -0.70% | -49.64% |
| MRSN | Mersana | | Health Care | 3.37 | 44 | 0.00% | 45.26% |
| CAL | Caleres | | Consumer Staples | 36.57 | 22 | 1.22% | 19.00% |
| VOR | Vor Biopharma | | Health Care | 1.75 | 5 | -1.13% | -21.17% |
| DAKT | Daktronics | | Technology | 10.13 | 90 | 5.25% | 19.40% |
| CWCO | Consolidated Water | | Utilities | 26.05 | 52 | 1.13% | -26.83% |
| MRNS | Marinus | | Health Care | 1.45 | 25 | -1.36% | -86.66% |
| VLGEA | Village Super | | Services & Goods | 28.50 | 53 | 0.64% | 8.65% |
| GCI | Gannett Co | | Services & Goods | 3.06 | 100 | 26.97% | 33.04% |
| DMRC | Digimarc | | Technology | 22.61 | 35 | 3.57% | -37.40% |
| FLGT | Fulgent Genetics | | Health Care | 21.24 | 52 | 2.61% | -26.53% |
| CABA | Cabaletta Bio | | Health Care | 12.62 | 42 | 1.69% | -44.41% |
| For chart view version of above stock list: Chart View ➞ 0 - 25 , 25 - 50 , 50 - 75 , 75 - 100 , 100 - 125 , 125 - 150 , 150 - 175 , 175 - 200 , 200 - 225 , 225 - 250 , 250 - 275 , 275 - 300 , 300 - 325 , 325 - 350 , 350 - 375 , 375 - 400 , 400 - 425 , 425 - 450 , 450 - 475 , 475 - 500 , 500 - 525 | ||
 | Click To Change The Sort Order: By Market Cap or Company Size Performance: Year-to-date, Week and Day |  |
| Too many stocks? View smallcap stocks filtered by marketcap & sector |
| Marketcap: All SmallCap Stocks (default-no microcap), Large, Mid-Range, Small |
| Smallcap Sector: Tech, Finance, Energy, Staples, Retail, Industrial, Materials, & Medical |
|
Get the most comprehensive stock market coverage daily at 12Stocks.com ➞ Best Stocks Today ➞ Best Stocks Weekly ➞ Best Stocks Year-to-Date ➞ Best Stocks Trends ➞  Best Stocks Today 12Stocks.com Best Nasdaq Stocks ➞ Best S&P 500 Stocks ➞ Best Tech Stocks ➞ Best Biotech Stocks ➞ |
| Detailed Overview of SmallCap Stocks |
| SmallCap Technical Overview, Leaders & Laggards, Top SmallCap ETF Funds & Detailed SmallCap Stocks List, Charts, Trends & More |
| Smallcap: Technical Analysis, Trends & YTD Performance | |
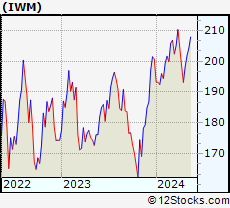
| SmallCap segment as represented by
IWM, an exchange-traded fund [ETF], holds basket of thousands of smallcap stocks from across all major sectors of the US stock market. The smallcap index (contains stocks like Riverbed & Sotheby's) is down by -0.39% and is currently underperforming the overall market by -6.01% year-to-date. Below is a quick view of technical charts and trends: | |
 IWM Weekly Chart |
|
| Long Term Trend: Not Good | |
| Medium Term Trend: Good | |
 IWM Daily Chart |
|
| Short Term Trend: Deteriorating | |
| Overall Trend Score: 49 | |
| YTD Performance: -0.39% | |
| **Trend Scores & Views Are Only For Educational Purposes And Not For Investing | |
| 12Stocks.com: Top Performing Small Cap Index Stocks | ||||||||||||||||||||||||||||||||||||||||||||||||
 The top performing Small Cap Index stocks year to date are
Now, more recently, over last week, the top performing Small Cap Index stocks on the move are


|
||||||||||||||||||||||||||||||||||||||||||||||||
| 12Stocks.com: Investing in Smallcap Index using Exchange Traded Funds | |
|
The following table shows list of key exchange traded funds (ETF) that
help investors track Smallcap index. The following list also includes leveraged ETF funds that track twice or thrice the daily returns of Smallcap indices. Short or inverse ETF funds move in the opposite direction to the index they track and are useful during market pullbacks or during bear markets. Quick View: Move mouse or cursor over ETF symbol (ticker) to view short-term technical chart and over ETF name to view long term chart. Click on ticker or stock name for detailed view. Click on to add stock symbol to your watchlist and to view watchlist. |
12Stocks.com List of ETFs that track Smallcap Index
| Ticker | ETF Name | Watchlist | Recent Price | Smart Investing & Trading Score | Change % | Week % | Year-to-date % |
| IWM | iShares Russell 2000 | | 199.92 | 49 | 1.84 | 0.77 | -0.39% |
| IJR | iShares Core S&P Small-Cap | | 106.33 | 50 | 1.52 | 0.64 | -1.77% |
| VTWO | Vanguard Russell 2000 ETF | | 80.83 | 7 | 1.85 | 0.76 | -0.33% |
| IWN | iShares Russell 2000 Value | | 152.88 | 57 | 2.04 | 1.15 | -1.58% |
| IWO | iShares Russell 2000 Growth | | 254.34 | 17 | 1.91 | 0.49 | 0.84% |
| IJS | iShares S&P Small-Cap 600 Value | | 98.02 | 13 | 1.68 | 0.85 | -4.9% |
| IJT | iShares S&P Small-Cap 600 Growth | | 126.47 | 20 | 1.22 | 0.3 | 1.06% |
| XSLV | PowerShares S&P SmallCap Low Volatil ETF | | 43.19 | 42 | 0.84 | 1.1 | -2.17% |
| SDD | ProShares UltraShort SmallCap600 | | 19.31 | 61 | -2.02 | -0.21 | 4.79% |
| SMLV | SPDR SSGA US Small Cap Low Volatil ETF | | 108.83 | 44 | 1.30 | 1.22 | -3.27% |
| SAA | ProShares Ultra SmallCap600 | | 22.93 | 32 | 1.56 | -0.46 | -8.08% |
| SBB | ProShares Short SmallCap600 | | 16.37 | 71 | -1.14 | -0.09 | 2.76% |
| 12Stocks.com: Charts, Trends, Fundamental Data and Performances of SmallCap Stocks | |
|
We now take in-depth look at all SmallCap stocks including charts, multi-period performances and overall trends (as measured by Smart Investing & Trading Score). One can sort SmallCap stocks (click link to choose) by Daily, Weekly and by Year-to-Date performances. Also, one can sort by size of the company or by market capitalization. |
| Select Your Default Chart Type: | |||||
| |||||
| Click on stock symbol or name for detailed view. Click on to add stock symbol to your watchlist and to view watchlist. Quick View: Move mouse or cursor over "Daily" to quickly view daily technical stock chart and over "Weekly" to view weekly technical stock chart. | |||||

 | BARK BARK, Inc. |
| Sector: Services & Goods | |
| SubSector: Specialty Retail | |
| MarketCap: 234 Millions | |
| Recent Price: 1.16 Smart Investing & Trading Score: 54 | |
| Day Percent Change: 0.87% Day Change: 0.01 | |
| Week Change: 5.45% Year-to-date Change: 45.0% | |
| BARK Links: Profile News Message Board | |
| Charts:- Daily , Weekly | |
| Add BARK to Watchlist: View: Get Complete BARK Trend Analysis ➞ | |
 | RPHM Reneo Pharmaceuticals, Inc. |
| Sector: Health Care | |
| SubSector: Biotechnology | |
| MarketCap: 233 Millions | |
| Recent Price: 1.74 Smart Investing & Trading Score: 100 | |
| Day Percent Change: 2.35% Day Change: 0.04 | |
| Week Change: 4.19% Year-to-date Change: 7.4% | |
| RPHM Links: Profile News Message Board | |
| Charts:- Daily , Weekly | |
| Add RPHM to Watchlist: View: Get Complete RPHM Trend Analysis ➞ | |
 | KOP Koppers Holdings Inc. |
| Sector: Materials | |
| SubSector: Specialty Chemicals | |
| MarketCap: 232.657 Millions | |
| Recent Price: 52.91 Smart Investing & Trading Score: 17 | |
| Day Percent Change: 1.07% Day Change: 0.56 | |
| Week Change: 0.34% Year-to-date Change: 3.3% | |
| KOP Links: Profile News Message Board | |
| Charts:- Daily , Weekly | |
| Add KOP to Watchlist: View: Get Complete KOP Trend Analysis ➞ | |
 | NVEC NVE Corporation |
| Sector: Technology | |
| SubSector: Semiconductor - Specialized | |
| MarketCap: 231.26 Millions | |
| Recent Price: 79.48 Smart Investing & Trading Score: 14 | |
| Day Percent Change: -2.35% Day Change: -1.91 | |
| Week Change: -1.13% Year-to-date Change: 1.3% | |
| NVEC Links: Profile News Message Board | |
| Charts:- Daily , Weekly | |
| Add NVEC to Watchlist: View: Get Complete NVEC Trend Analysis ➞ | |
 | ACNB ACNB Corporation |
| Sector: Financials | |
| SubSector: Regional - Southwest Banks | |
| MarketCap: 231.065 Millions | |
| Recent Price: 33.20 Smart Investing & Trading Score: 57 | |
| Day Percent Change: 0.21% Day Change: 0.07 | |
| Week Change: -2.81% Year-to-date Change: -25.8% | |
| ACNB Links: Profile News Message Board | |
| Charts:- Daily , Weekly | |
| Add ACNB to Watchlist: View: Get Complete ACNB Trend Analysis ➞ | |
 | DFIN Donnelley Financial Solutions, Inc. |
| Sector: Services & Goods | |
| SubSector: Business Services | |
| MarketCap: 229.882 Millions | |
| Recent Price: 62.42 Smart Investing & Trading Score: 0 | |
| Day Percent Change: 4.85% Day Change: 2.89 | |
| Week Change: -0.95% Year-to-date Change: 0.1% | |
| DFIN Links: Profile News Message Board | |
| Charts:- Daily , Weekly | |
| Add DFIN to Watchlist: View: Get Complete DFIN Trend Analysis ➞ | |
 | PKE Park Aerospace Corp. |
| Sector: Technology | |
| SubSector: Semiconductor Equipment & Materials | |
| MarketCap: 229.018 Millions | |
| Recent Price: 14.44 Smart Investing & Trading Score: 10 | |
| Day Percent Change: 0.42% Day Change: 0.06 | |
| Week Change: -2.17% Year-to-date Change: -1.8% | |
| PKE Links: Profile News Message Board | |
| Charts:- Daily , Weekly | |
| Add PKE to Watchlist: View: Get Complete PKE Trend Analysis ➞ | |
 | SMMF Summit Financial Group, Inc. |
| Sector: Financials | |
| SubSector: Regional - Mid-Atlantic Banks | |
| MarketCap: 228.959 Millions | |
| Recent Price: 25.84 Smart Investing & Trading Score: 15 | |
| Day Percent Change: -1.97% Day Change: -0.52 | |
| Week Change: -5.87% Year-to-date Change: -15.8% | |
| SMMF Links: Profile News Message Board | |
| Charts:- Daily , Weekly | |
| Add SMMF to Watchlist: View: Get Complete SMMF Trend Analysis ➞ | |
 | GERN Geron Corporation |
| Sector: Health Care | |
| SubSector: Biotechnology | |
| MarketCap: 228.685 Millions | |
| Recent Price: 3.94 Smart Investing & Trading Score: 70 | |
| Day Percent Change: -3.43% Day Change: -0.14 | |
| Week Change: 3.96% Year-to-date Change: 86.7% | |
| GERN Links: Profile News Message Board | |
| Charts:- Daily , Weekly | |
| Add GERN to Watchlist: View: Get Complete GERN Trend Analysis ➞ | |
 | GLRE Greenlight Capital Re, Ltd. |
| Sector: Financials | |
| SubSector: Accident & Health Insurance | |
| MarketCap: 228.66 Millions | |
| Recent Price: 12.54 Smart Investing & Trading Score: 77 | |
| Day Percent Change: -0.71% Day Change: -0.09 | |
| Week Change: 4.07% Year-to-date Change: 9.8% | |
| GLRE Links: Profile News Message Board | |
| Charts:- Daily , Weekly | |
| Add GLRE to Watchlist: View: Get Complete GLRE Trend Analysis ➞ | |
 | OSW OneSpaWorld Holdings Limited |
| Sector: Services & Goods | |
| SubSector: Resorts & Casinos | |
| MarketCap: 228.394 Millions | |
| Recent Price: 14.85 Smart Investing & Trading Score: 100 | |
| Day Percent Change: 3.85% Day Change: 0.55 | |
| Week Change: 16.2% Year-to-date Change: 5.3% | |
| OSW Links: Profile News Message Board | |
| Charts:- Daily , Weekly | |
| Add OSW to Watchlist: View: Get Complete OSW Trend Analysis ➞ | |
 | OPFI OppFi Inc. |
| Sector: Financials | |
| SubSector: Credit Services | |
| MarketCap: 226 Millions | |
| Recent Price: 2.78 Smart Investing & Trading Score: 42 | |
| Day Percent Change: 2.58% Day Change: 0.07 | |
| Week Change: 4.51% Year-to-date Change: -45.6% | |
| OPFI Links: Profile News Message Board | |
| Charts:- Daily , Weekly | |
| Add OPFI to Watchlist: View: Get Complete OPFI Trend Analysis ➞ | |
 | RLYB Rallybio Corporation |
| Sector: Health Care | |
| SubSector: Biotechnology | |
| MarketCap: 226 Millions | |
| Recent Price: 1.84 Smart Investing & Trading Score: 37 | |
| Day Percent Change: -3.41% Day Change: -0.06 | |
| Week Change: 8.24% Year-to-date Change: -22.0% | |
| RLYB Links: Profile News Message Board | |
| Charts:- Daily , Weekly | |
| Add RLYB to Watchlist: View: Get Complete RLYB Trend Analysis ➞ | |
 | MASS 908 Devices Inc. |
| Sector: Health Care | |
| SubSector: Medical Devices | |
| MarketCap: 225 Millions | |
| Recent Price: 5.64 Smart Investing & Trading Score: 17 | |
| Day Percent Change: -0.70% Day Change: -0.04 | |
| Week Change: -0.53% Year-to-date Change: -49.6% | |
| MASS Links: Profile News Message Board | |
| Charts:- Daily , Weekly | |
| Add MASS to Watchlist: View: Get Complete MASS Trend Analysis ➞ | |
 | MRSN Mersana Therapeutics, Inc. |
| Sector: Health Care | |
| SubSector: Biotechnology | |
| MarketCap: 224.385 Millions | |
| Recent Price: 3.37 Smart Investing & Trading Score: 44 | |
| Day Percent Change: 0.00% Day Change: 0.00 | |
| Week Change: 14.63% Year-to-date Change: 45.3% | |
| MRSN Links: Profile News Message Board | |
| Charts:- Daily , Weekly | |
| Add MRSN to Watchlist: View: Get Complete MRSN Trend Analysis ➞ | |
 | CAL Caleres, Inc. |
| Sector: Consumer Staples | |
| SubSector: Textile - Apparel Footwear & Accessories | |
| MarketCap: 224.07 Millions | |
| Recent Price: 36.57 Smart Investing & Trading Score: 22 | |
| Day Percent Change: 1.22% Day Change: 0.44 | |
| Week Change: -1% Year-to-date Change: 19.0% | |
| CAL Links: Profile News Message Board | |
| Charts:- Daily , Weekly | |
| Add CAL to Watchlist: View: Get Complete CAL Trend Analysis ➞ | |
 | VOR Vor Biopharma Inc. |
| Sector: Health Care | |
| SubSector: Biotechnology | |
| MarketCap: 224 Millions | |
| Recent Price: 1.75 Smart Investing & Trading Score: 5 | |
| Day Percent Change: -1.13% Day Change: -0.02 | |
| Week Change: 3.55% Year-to-date Change: -21.2% | |
| VOR Links: Profile News Message Board | |
| Charts:- Daily , Weekly | |
| Add VOR to Watchlist: View: Get Complete VOR Trend Analysis ➞ | |
 | DAKT Daktronics, Inc. |
| Sector: Technology | |
| SubSector: Computer Based Systems | |
| MarketCap: 223.539 Millions | |
| Recent Price: 10.13 Smart Investing & Trading Score: 90 | |
| Day Percent Change: 5.25% Day Change: 0.51 | |
| Week Change: 8.99% Year-to-date Change: 19.4% | |
| DAKT Links: Profile News Message Board | |
| Charts:- Daily , Weekly | |
| Add DAKT to Watchlist: View: Get Complete DAKT Trend Analysis ➞ | |
 | CWCO Consolidated Water Co. Ltd. |
| Sector: Utilities | |
| SubSector: Water Utilities | |
| MarketCap: 223.302 Millions | |
| Recent Price: 26.05 Smart Investing & Trading Score: 52 | |
| Day Percent Change: 1.13% Day Change: 0.29 | |
| Week Change: 3.29% Year-to-date Change: -26.8% | |
| CWCO Links: Profile News Message Board | |
| Charts:- Daily , Weekly | |
| Add CWCO to Watchlist: View: Get Complete CWCO Trend Analysis ➞ | |
 | MRNS Marinus Pharmaceuticals, Inc. |
| Sector: Health Care | |
| SubSector: Biotechnology | |
| MarketCap: 222.885 Millions | |
| Recent Price: 1.45 Smart Investing & Trading Score: 25 | |
| Day Percent Change: -1.36% Day Change: -0.02 | |
| Week Change: 3.2% Year-to-date Change: -86.7% | |
| MRNS Links: Profile News Message Board | |
| Charts:- Daily , Weekly | |
| Add MRNS to Watchlist: View: Get Complete MRNS Trend Analysis ➞ | |
 | VLGEA Village Super Market, Inc. |
| Sector: Services & Goods | |
| SubSector: Grocery Stores | |
| MarketCap: 222.375 Millions | |
| Recent Price: 28.50 Smart Investing & Trading Score: 53 | |
| Day Percent Change: 0.64% Day Change: 0.18 | |
| Week Change: 4.01% Year-to-date Change: 8.7% | |
| VLGEA Links: Profile News Message Board | |
| Charts:- Daily , Weekly | |
| Add VLGEA to Watchlist: View: Get Complete VLGEA Trend Analysis ➞ | |
 | GCI Gannett Co., Inc. |
| Sector: Services & Goods | |
| SubSector: Publishing - Newspapers | |
| MarketCap: 222.322 Millions | |
| Recent Price: 3.06 Smart Investing & Trading Score: 100 | |
| Day Percent Change: 26.97% Day Change: 0.65 | |
| Week Change: 18.6% Year-to-date Change: 33.0% | |
| GCI Links: Profile News Message Board | |
| Charts:- Daily , Weekly | |
| Add GCI to Watchlist: View: Get Complete GCI Trend Analysis ➞ | |
 | DMRC Digimarc Corporation |
| Sector: Technology | |
| SubSector: Information Technology Services | |
| MarketCap: 222.268 Millions | |
| Recent Price: 22.61 Smart Investing & Trading Score: 35 | |
| Day Percent Change: 3.57% Day Change: 0.78 | |
| Week Change: 1.03% Year-to-date Change: -37.4% | |
| DMRC Links: Profile News Message Board | |
| Charts:- Daily , Weekly | |
| Add DMRC to Watchlist: View: Get Complete DMRC Trend Analysis ➞ | |
 | FLGT Fulgent Genetics, Inc. |
| Sector: Health Care | |
| SubSector: Medical Laboratories & Research | |
| MarketCap: 222.2 Millions | |
| Recent Price: 21.24 Smart Investing & Trading Score: 52 | |
| Day Percent Change: 2.61% Day Change: 0.54 | |
| Week Change: 5.67% Year-to-date Change: -26.5% | |
| FLGT Links: Profile News Message Board | |
| Charts:- Daily , Weekly | |
| Add FLGT to Watchlist: View: Get Complete FLGT Trend Analysis ➞ | |
 | CABA Cabaletta Bio, Inc. |
| Sector: Health Care | |
| SubSector: Biotechnology | |
| MarketCap: 222.085 Millions | |
| Recent Price: 12.62 Smart Investing & Trading Score: 42 | |
| Day Percent Change: 1.69% Day Change: 0.21 | |
| Week Change: 14.62% Year-to-date Change: -44.4% | |
| CABA Links: Profile News Message Board | |
| Charts:- Daily , Weekly | |
| Add CABA to Watchlist: View: Get Complete CABA Trend Analysis ➞ | |
| For tabular summary view of above stock list: Summary View ➞ 0 - 25 , 25 - 50 , 50 - 75 , 75 - 100 , 100 - 125 , 125 - 150 , 150 - 175 , 175 - 200 , 200 - 225 , 225 - 250 , 250 - 275 , 275 - 300 , 300 - 325 , 325 - 350 , 350 - 375 , 375 - 400 , 400 - 425 , 425 - 450 , 450 - 475 , 475 - 500 , 500 - 525 | ||
| Click To Change The Sort Order: By Market Cap or Company Size Performance: Year-to-date, Week and Day | |
| Select Chart Type: | ||
| Too many stocks? View smallcap stocks filtered by marketcap & sector |
| Marketcap: All SmallCap Stocks (default-no microcap), Large, Mid-Range, Small & MicroCap |
| Sector: Tech, Finance, Energy, Staples, Retail, Industrial, Materials, Utilities & Medical |
|
Best Stocks Today 12Stocks.com |
© 2024 12Stocks.com Terms & Conditions Privacy Contact Us
All Information Provided Only For Education And Not To Be Used For Investing or Trading. See Terms & Conditions


One More Thing ... Get Best Stocks Delivered Daily!
Never Ever Miss A Move With Our Top Ten Stocks Lists
Find Best Stocks In Any Market - Bull or Bear Market
Take A Peek At Our Top Ten Stocks Lists: Daily, Weekly, Year-to-Date & Top Trends
Find Best Stocks In Any Market - Bull or Bear Market
Take A Peek At Our Top Ten Stocks Lists: Daily, Weekly, Year-to-Date & Top Trends
Smallcap Stocks With Best Up Trends [0-bearish to 100-bullish]: Emergent BioSolutions[100], Aspen Aerogels[100], Perdoceo Education[100], Gannett Co[100], Pitney Bowes[100], Benchmark Electronics[100], Origin Materials[100], FormFactor [100], Lantheus [100], Q2 [100], Blueprint Medicines[100]
Best Smallcap Stocks Year-to-Date:
Janux [440.16%], Viking [307.15%], Longboard [273.98%], Alpine Immune[239.23%], Bakkt [187.89%], Avidity Biosciences[182.96%], Vera [170.74%], Cullinan Oncology[169.74%], Super Micro[168.13%], Arcutis Bio[166.1%], Y-mAbs [153.08%] Best Smallcap Stocks This Week:
Deciphera [73.17%], Emergent BioSolutions[71.88%], Eyenovia [48.36%], Aspen Aerogels[47.89%], P3 Health[38.51%], Carvana Co[38.18%], Cue Biopharma[36.26%], Origin Materials[36.24%], TransMedics Group[35.13%], Seres [33.33%], Enovix [32.07%] Best Smallcap Stocks Daily:
Emergent BioSolutions[70.98%], Aspen Aerogels[56.44%], Carvana Co[33.77%], Perdoceo Education[31.79%], Enovix [31.06%], Office Properties[29.00%], Gannett Co[26.97%], Sunnova Energy[25.21%], Pitney Bowes[24.70%], Pulmonx [21.37%], CommScope Holding[20.38%]