
 Login Sign Up


| |||||
 |  | ||||

| 12Stocks.com Market Intelligence |
Best SmallCap Stocks
|
| In a hurry? Small Cap Stock Lists: Performance Trends Table, Stock Charts
Sort Small Cap stocks: Daily, Weekly, Year-to-Date, Market Cap & Trends. Filter Small Cap stocks list by sector: Show all, Tech, Finance, Energy, Staples, Retail, Industrial, Materials, Utilities and HealthCare Filter Small Cap stocks list by size: All Large Medium Small and MicroCap |
| 12Stocks.com Small Cap Stocks Performances & Trends Daily | |||||||||
|
|  The overall Smart Investing & Trading Score is 49 (0-bearish to 100-bullish) which puts Small Cap index in short term neutral trend. The Smart Investing & Trading Score from previous trading session is 14 and hence an improvement of trend.
| ||||||||
Here are the Smart Investing & Trading Scores of the most requested small cap stocks at 12Stocks.com (click stock name for detailed review):
|


| 12Stocks.com: Investing in Smallcap Index with Stocks | |
|
The following table helps investors and traders sort through current performance and trends (as measured by Smart Investing & Trading Score) of various
stocks in the Smallcap Index. Quick View: Move mouse or cursor over stock symbol (ticker) to view short-term technical chart and over stock name to view long term chart. Click on  to add stock symbol to your watchlist and to add stock symbol to your watchlist and  to view watchlist. Click on any ticker or stock name for detailed market intelligence report for that stock. to view watchlist. Click on any ticker or stock name for detailed market intelligence report for that stock. |
12Stocks.com Performance of Stocks in Smallcap Index
| Ticker | Stock Name | Watchlist | Category | Recent Price | Smart Investing & Trading Score | Change % | YTD Change% |
| NREF | NexPoint Real |   | Financials | 13.23 | 17 | 2.16% | -15.92% |
| PLRX | Pliant | | Health Care | 13.22 | 59 | 4.42% | -27.04% |
| ANNX | Annexon | | Health Care | 4.66 | 24 | -1.89% | 2.19% |
| AVO | Mission Produce | | Consumer Staples | 11.77 | 90 | 1.82% | 16.30% |
| MAXN | Maxeon Solar | | Technology | 2.24 | 39 | 15.46% | -68.80% |
| DYN | Dyne | | Health Care | 25.95 | 27 | 0.46% | 95.11% |
| EOSE | Eos Energy | | Industrials | 0.69 | 5 | 4.75% | -37.34% |
| FHTX | Foghorn | | Health Care | 6.06 | 49 | 3.41% | -5.53% |
| TARS | Tarsus | | Health Care | 34.57 | 39 | 6.40% | 70.46% |
| AMWL | American Well | | Health Care | 0.52 | 0 | -2.05% | -65.08% |
| MEG | Montrose Environmental | | Industrials | 44.27 | 68 | 2.71% | 37.66% |
| PSTX | Poseida | | Health Care | 2.79 | 64 | 0.90% | -16.94% |
| PUBM | PubMatic | | Technology | 23.09 | 64 | 1.36% | 41.66% |
| LMND | Lemonade | | Financials | 17.74 | 53 | 2.31% | 9.98% |
| MPLN | MultiPlan | | Health Care | 0.67 | 32 | 3.72% | -53.77% |
| INZY | Inozyme Pharma | | Health Care | 4.66 | 39 | 1.08% | 9.52% |
| NTST | NetSTREIT | | Financials | 17.09 | 64 | 0.53% | -4.31% |
| SEER | Seer | | Health Care | 2.15 | 90 | 1.65% | 10.51% |
| BIGC | BigCommerce | | Technology | 5.99 | 34 | 2.74% | -38.50% |
| SDGR | Schrodinger | | Health Care | 23.17 | 7 | -8.27% | -35.28% |
| ARRY | Array | | Technology | 13.05 | 90 | 4.74% | -22.32% |
| RLAY | Relay | | Health Care | 7.09 | 59 | 6.46% | -35.55% |
| ASAN | Asana | | Technology | 15.63 | 39 | 1.89% | -17.78% |
| BEAM | Beam | | Health Care | 22.72 | 32 | 4.51% | -16.53% |
| GOCO | GoHealth | | Financials | 10.35 | 64 | -5.91% | -21.17% |


| Too many stocks? View smallcap stocks filtered by marketcap & sector |
| Marketcap: All SmallCap Stocks (default-no microcap), Large, Mid-Range, Small |
| Smallcap Sector: Tech, Finance, Energy, Staples, Retail, Industrial, Materials, & Medical |
|
Get the most comprehensive stock market coverage daily at 12Stocks.com ➞ Best Stocks Today ➞ Best Stocks Weekly ➞ Best Stocks Year-to-Date ➞ Best Stocks Trends ➞  Best Stocks Today 12Stocks.com Best Nasdaq Stocks ➞ Best S&P 500 Stocks ➞ Best Tech Stocks ➞ Best Biotech Stocks ➞ |
| Detailed Overview of SmallCap Stocks |
| SmallCap Technical Overview, Leaders & Laggards, Top SmallCap ETF Funds & Detailed SmallCap Stocks List, Charts, Trends & More |
| Smallcap: Technical Analysis, Trends & YTD Performance | |
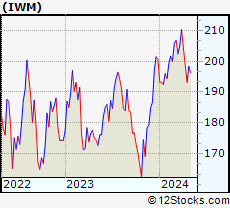
| SmallCap segment as represented by
IWM, an exchange-traded fund [ETF], holds basket of thousands of smallcap stocks from across all major sectors of the US stock market. The smallcap index (contains stocks like Riverbed & Sotheby's) is down by -0.39% and is currently underperforming the overall market by -6.01% year-to-date. Below is a quick view of technical charts and trends: | |
 IWM Weekly Chart |
|
| Long Term Trend: Not Good | |
| Medium Term Trend: Good | |
 IWM Daily Chart |
|
| Short Term Trend: Deteriorating | |
| Overall Trend Score: 49 | |
| YTD Performance: -0.39% | |
| **Trend Scores & Views Are Only For Educational Purposes And Not For Investing | |
| 12Stocks.com: Top Performing Small Cap Index Stocks | ||||||||||||||||||||||||||||||||||||||||||||||||
 The top performing Small Cap Index stocks year to date are
Now, more recently, over last week, the top performing Small Cap Index stocks on the move are


|
||||||||||||||||||||||||||||||||||||||||||||||||
| 12Stocks.com: Investing in Smallcap Index using Exchange Traded Funds | |
|
The following table shows list of key exchange traded funds (ETF) that
help investors track Smallcap index. The following list also includes leveraged ETF funds that track twice or thrice the daily returns of Smallcap indices. Short or inverse ETF funds move in the opposite direction to the index they track and are useful during market pullbacks or during bear markets. Quick View: Move mouse or cursor over ETF symbol (ticker) to view short-term technical chart and over ETF name to view long term chart. Click on ticker or stock name for detailed view. Click on to add stock symbol to your watchlist and to view watchlist. |
12Stocks.com List of ETFs that track Smallcap Index
| Ticker | ETF Name | Watchlist | Recent Price | Smart Investing & Trading Score | Change % | Week % | Year-to-date % |
| IWM | iShares Russell 2000 | | 199.92 | 49 | 1.84 | 0.77 | -0.39% |
| IJR | iShares Core S&P Small-Cap | | 106.33 | 50 | 1.52 | 0.64 | -1.77% |
| VTWO | Vanguard Russell 2000 ETF | | 80.83 | 7 | 1.85 | 0.76 | -0.33% |
| IWN | iShares Russell 2000 Value | | 152.88 | 57 | 2.04 | 1.15 | -1.58% |
| IWO | iShares Russell 2000 Growth | | 254.34 | 17 | 1.91 | 0.49 | 0.84% |
| IJS | iShares S&P Small-Cap 600 Value | | 98.02 | 13 | 1.68 | 0.85 | -4.9% |
| IJT | iShares S&P Small-Cap 600 Growth | | 126.47 | 20 | 1.22 | 0.3 | 1.06% |
| XSLV | PowerShares S&P SmallCap Low Volatil ETF | | 43.19 | 42 | 0.84 | 1.1 | -2.17% |
| SDD | ProShares UltraShort SmallCap600 | | 19.31 | 61 | -2.02 | -0.21 | 4.79% |
| SMLV | SPDR SSGA US Small Cap Low Volatil ETF | | 108.83 | 44 | 1.30 | 1.22 | -3.27% |
| SAA | ProShares Ultra SmallCap600 | | 22.93 | 32 | 1.56 | -0.46 | -8.08% |
| SBB | ProShares Short SmallCap600 | | 16.37 | 71 | -1.14 | -0.09 | 2.76% |
| 12Stocks.com: Charts, Trends, Fundamental Data and Performances of SmallCap Stocks | |
|
We now take in-depth look at all SmallCap stocks including charts, multi-period performances and overall trends (as measured by Smart Investing & Trading Score). One can sort SmallCap stocks (click link to choose) by Daily, Weekly and by Year-to-Date performances. Also, one can sort by size of the company or by market capitalization. |
| Select Your Default Chart Type: | |||||
| |||||
| Click on stock symbol or name for detailed view. Click on to add stock symbol to your watchlist and to view watchlist. Quick View: Move mouse or cursor over "Daily" to quickly view daily technical stock chart and over "Weekly" to view weekly technical stock chart. | |||||

 | NREF NexPoint Real Estate Finance, Inc. |
| Sector: Financials | |
| SubSector: REIT Diversified | |
| MarketCap: 97267 Millions | |
| Recent Price: 13.23 Smart Investing & Trading Score: 17 | |
| Day Percent Change: 2.16% Day Change: 0.28 | |
| Week Change: -0.23% Year-to-date Change: -15.9% | |
| NREF Links: Profile News Message Board | |
| Charts:- Daily , Weekly | |
| Add NREF to Watchlist: View: Get Complete NREF Trend Analysis ➞ | |
 | PLRX Pliant Therapeutics, Inc. |
| Sector: Health Care | |
| SubSector: Biotechnology | |
| MarketCap: 96487 Millions | |
| Recent Price: 13.22 Smart Investing & Trading Score: 59 | |
| Day Percent Change: 4.42% Day Change: 0.56 | |
| Week Change: 11.94% Year-to-date Change: -27.0% | |
| PLRX Links: Profile News Message Board | |
| Charts:- Daily , Weekly | |
| Add PLRX to Watchlist: View: Get Complete PLRX Trend Analysis ➞ | |
 | ANNX Annexon, Inc. |
| Sector: Health Care | |
| SubSector: Biotechnology | |
| MarketCap: 94487 Millions | |
| Recent Price: 4.66 Smart Investing & Trading Score: 24 | |
| Day Percent Change: -1.89% Day Change: -0.09 | |
| Week Change: -0.85% Year-to-date Change: 2.2% | |
| ANNX Links: Profile News Message Board | |
| Charts:- Daily , Weekly | |
| Add ANNX to Watchlist: View: Get Complete ANNX Trend Analysis ➞ | |
 | AVO Mission Produce, Inc. |
| Sector: Consumer Staples | |
| SubSector: Farm Products | |
| MarketCap: 91347 Millions | |
| Recent Price: 11.77 Smart Investing & Trading Score: 90 | |
| Day Percent Change: 1.82% Day Change: 0.21 | |
| Week Change: 3.79% Year-to-date Change: 16.3% | |
| AVO Links: Profile News Message Board | |
| Charts:- Daily , Weekly | |
| Add AVO to Watchlist: View: Get Complete AVO Trend Analysis ➞ | |
 | MAXN Maxeon Solar Technologies, Ltd. |
| Sector: Technology | |
| SubSector: Solar | |
| MarketCap: 88787 Millions | |
| Recent Price: 2.24 Smart Investing & Trading Score: 39 | |
| Day Percent Change: 15.46% Day Change: 0.30 | |
| Week Change: 7.18% Year-to-date Change: -68.8% | |
| MAXN Links: Profile News Message Board | |
| Charts:- Daily , Weekly | |
| Add MAXN to Watchlist: View: Get Complete MAXN Trend Analysis ➞ | |
 | DYN Dyne Therapeutics, Inc. |
| Sector: Health Care | |
| SubSector: Biotechnology | |
| MarketCap: 88487 Millions | |
| Recent Price: 25.95 Smart Investing & Trading Score: 27 | |
| Day Percent Change: 0.46% Day Change: 0.12 | |
| Week Change: 4.93% Year-to-date Change: 95.1% | |
| DYN Links: Profile News Message Board | |
| Charts:- Daily , Weekly | |
| Add DYN to Watchlist: View: Get Complete DYN Trend Analysis ➞ | |
 | EOSE Eos Energy Enterprises, Inc. |
| Sector: Industrials | |
| SubSector: Electrical Equipment & Parts | |
| MarketCap: 76627 Millions | |
| Recent Price: 0.69 Smart Investing & Trading Score: 5 | |
| Day Percent Change: 4.75% Day Change: 0.03 | |
| Week Change: -14.85% Year-to-date Change: -37.3% | |
| EOSE Links: Profile News Message Board | |
| Charts:- Daily , Weekly | |
| Add EOSE to Watchlist: View: Get Complete EOSE Trend Analysis ➞ | |
 | FHTX Foghorn Therapeutics Inc. |
| Sector: Health Care | |
| SubSector: Biotechnology | |
| MarketCap: 74487 Millions | |
| Recent Price: 6.06 Smart Investing & Trading Score: 49 | |
| Day Percent Change: 3.41% Day Change: 0.20 | |
| Week Change: 10.38% Year-to-date Change: -5.5% | |
| FHTX Links: Profile News Message Board | |
| Charts:- Daily , Weekly | |
| Add FHTX to Watchlist: View: Get Complete FHTX Trend Analysis ➞ | |
 | TARS Tarsus Pharmaceuticals, Inc. |
| Sector: Health Care | |
| SubSector: Biotechnology | |
| MarketCap: 74487 Millions | |
| Recent Price: 34.57 Smart Investing & Trading Score: 39 | |
| Day Percent Change: 6.40% Day Change: 2.08 | |
| Week Change: 7.9% Year-to-date Change: 70.5% | |
| TARS Links: Profile News Message Board | |
| Charts:- Daily , Weekly | |
| Add TARS to Watchlist: View: Get Complete TARS Trend Analysis ➞ | |
 | AMWL American Well Corporation |
| Sector: Health Care | |
| SubSector: Health Information Services | |
| MarketCap: 71987 Millions | |
| Recent Price: 0.52 Smart Investing & Trading Score: 0 | |
| Day Percent Change: -2.05% Day Change: -0.01 | |
| Week Change: -1.46% Year-to-date Change: -65.1% | |
| AMWL Links: Profile News Message Board | |
| Charts:- Daily , Weekly | |
| Add AMWL to Watchlist: View: Get Complete AMWL Trend Analysis ➞ | |
 | MEG Montrose Environmental Group, Inc. |
| Sector: Industrials | |
| SubSector: Waste Management | |
| MarketCap: 71627 Millions | |
| Recent Price: 44.27 Smart Investing & Trading Score: 68 | |
| Day Percent Change: 2.71% Day Change: 1.17 | |
| Week Change: 2.69% Year-to-date Change: 37.7% | |
| MEG Links: Profile News Message Board | |
| Charts:- Daily , Weekly | |
| Add MEG to Watchlist: View: Get Complete MEG Trend Analysis ➞ | |
 | PSTX Poseida Therapeutics, Inc. |
| Sector: Health Care | |
| SubSector: Biotechnology | |
| MarketCap: 64487 Millions | |
| Recent Price: 2.79 Smart Investing & Trading Score: 64 | |
| Day Percent Change: 0.90% Day Change: 0.02 | |
| Week Change: 31.22% Year-to-date Change: -16.9% | |
| PSTX Links: Profile News Message Board | |
| Charts:- Daily , Weekly | |
| Add PSTX to Watchlist: View: Get Complete PSTX Trend Analysis ➞ | |
 | PUBM PubMatic, Inc. |
| Sector: Technology | |
| SubSector: Software Application | |
| MarketCap: 56787 Millions | |
| Recent Price: 23.09 Smart Investing & Trading Score: 64 | |
| Day Percent Change: 1.36% Day Change: 0.31 | |
| Week Change: -0.52% Year-to-date Change: 41.7% | |
| PUBM Links: Profile News Message Board | |
| Charts:- Daily , Weekly | |
| Add PUBM to Watchlist: View: Get Complete PUBM Trend Analysis ➞ | |
 | LMND Lemonade, Inc. |
| Sector: Financials | |
| SubSector: Insurance Property & Casualty | |
| MarketCap: 56457 Millions | |
| Recent Price: 17.74 Smart Investing & Trading Score: 53 | |
| Day Percent Change: 2.31% Day Change: 0.40 | |
| Week Change: -1.17% Year-to-date Change: 10.0% | |
| LMND Links: Profile News Message Board | |
| Charts:- Daily , Weekly | |
| Add LMND to Watchlist: View: Get Complete LMND Trend Analysis ➞ | |
 | MPLN MultiPlan Corporation |
| Sector: Health Care | |
| SubSector: Healthcare Plans | |
| MarketCap: 56087 Millions | |
| Recent Price: 0.67 Smart Investing & Trading Score: 32 | |
| Day Percent Change: 3.72% Day Change: 0.02 | |
| Week Change: 15.67% Year-to-date Change: -53.8% | |
| MPLN Links: Profile News Message Board | |
| Charts:- Daily , Weekly | |
| Add MPLN to Watchlist: View: Get Complete MPLN Trend Analysis ➞ | |
 | INZY Inozyme Pharma, Inc. |
| Sector: Health Care | |
| SubSector: Biotechnology | |
| MarketCap: 53487 Millions | |
| Recent Price: 4.66 Smart Investing & Trading Score: 39 | |
| Day Percent Change: 1.08% Day Change: 0.05 | |
| Week Change: 4.95% Year-to-date Change: 9.5% | |
| INZY Links: Profile News Message Board | |
| Charts:- Daily , Weekly | |
| Add INZY to Watchlist: View: Get Complete INZY Trend Analysis ➞ | |
 | NTST NetSTREIT Corp. |
| Sector: Financials | |
| SubSector: REIT Retail | |
| MarketCap: 51267 Millions | |
| Recent Price: 17.09 Smart Investing & Trading Score: 64 | |
| Day Percent Change: 0.53% Day Change: 0.09 | |
| Week Change: 0.53% Year-to-date Change: -4.3% | |
| NTST Links: Profile News Message Board | |
| Charts:- Daily , Weekly | |
| Add NTST to Watchlist: View: Get Complete NTST Trend Analysis ➞ | |
 | SEER Seer, Inc. |
| Sector: Health Care | |
| SubSector: Biotechnology | |
| MarketCap: 48287 Millions | |
| Recent Price: 2.15 Smart Investing & Trading Score: 90 | |
| Day Percent Change: 1.65% Day Change: 0.03 | |
| Week Change: 12.83% Year-to-date Change: 10.5% | |
| SEER Links: Profile News Message Board | |
| Charts:- Daily , Weekly | |
| Add SEER to Watchlist: View: Get Complete SEER Trend Analysis ➞ | |
 | BIGC BigCommerce Holdings, Inc. |
| Sector: Technology | |
| SubSector: Software Application | |
| MarketCap: 47587 Millions | |
| Recent Price: 5.99 Smart Investing & Trading Score: 34 | |
| Day Percent Change: 2.74% Day Change: 0.16 | |
| Week Change: 1.53% Year-to-date Change: -38.5% | |
| BIGC Links: Profile News Message Board | |
| Charts:- Daily , Weekly | |
| Add BIGC to Watchlist: View: Get Complete BIGC Trend Analysis ➞ | |
 | SDGR Schrodinger, Inc. |
| Sector: Health Care | |
| SubSector: Health Information Services | |
| MarketCap: 47287 Millions | |
| Recent Price: 23.17 Smart Investing & Trading Score: 7 | |
| Day Percent Change: -8.27% Day Change: -2.09 | |
| Week Change: -3.34% Year-to-date Change: -35.3% | |
| SDGR Links: Profile News Message Board | |
| Charts:- Daily , Weekly | |
| Add SDGR to Watchlist: View: Get Complete SDGR Trend Analysis ➞ | |
 | ARRY Array Technologies, Inc. |
| Sector: Technology | |
| SubSector: Solar | |
| MarketCap: 45887 Millions | |
| Recent Price: 13.05 Smart Investing & Trading Score: 90 | |
| Day Percent Change: 4.74% Day Change: 0.59 | |
| Week Change: 5.24% Year-to-date Change: -22.3% | |
| ARRY Links: Profile News Message Board | |
| Charts:- Daily , Weekly | |
| Add ARRY to Watchlist: View: Get Complete ARRY Trend Analysis ➞ | |
 | RLAY Relay Therapeutics, Inc. |
| Sector: Health Care | |
| SubSector: Biotechnology | |
| MarketCap: 45887 Millions | |
| Recent Price: 7.09 Smart Investing & Trading Score: 59 | |
| Day Percent Change: 6.46% Day Change: 0.43 | |
| Week Change: 11.3% Year-to-date Change: -35.6% | |
| RLAY Links: Profile News Message Board | |
| Charts:- Daily , Weekly | |
| Add RLAY to Watchlist: View: Get Complete RLAY Trend Analysis ➞ | |
 | ASAN Asana, Inc. |
| Sector: Technology | |
| SubSector: Software Application | |
| MarketCap: 45087 Millions | |
| Recent Price: 15.63 Smart Investing & Trading Score: 39 | |
| Day Percent Change: 1.89% Day Change: 0.29 | |
| Week Change: 3.65% Year-to-date Change: -17.8% | |
| ASAN Links: Profile News Message Board | |
| Charts:- Daily , Weekly | |
| Add ASAN to Watchlist: View: Get Complete ASAN Trend Analysis ➞ | |
 | BEAM Beam Therapeutics Inc. |
| Sector: Health Care | |
| SubSector: Biotechnology | |
| MarketCap: 44987 Millions | |
| Recent Price: 22.72 Smart Investing & Trading Score: 32 | |
| Day Percent Change: 4.51% Day Change: 0.98 | |
| Week Change: 6.27% Year-to-date Change: -16.5% | |
| BEAM Links: Profile News Message Board | |
| Charts:- Daily , Weekly | |
| Add BEAM to Watchlist: View: Get Complete BEAM Trend Analysis ➞ | |
 | GOCO GoHealth, Inc. |
| Sector: Financials | |
| SubSector: Insurance Brokers | |
| MarketCap: 44157 Millions | |
| Recent Price: 10.35 Smart Investing & Trading Score: 64 | |
| Day Percent Change: -5.91% Day Change: -0.65 | |
| Week Change: 1.97% Year-to-date Change: -21.2% | |
| GOCO Links: Profile News Message Board | |
| Charts:- Daily , Weekly | |
| Add GOCO to Watchlist: View: Get Complete GOCO Trend Analysis ➞ | |
| Too many stocks? View smallcap stocks filtered by marketcap & sector |
| Marketcap: All SmallCap Stocks (default-no microcap), Large, Mid-Range, Small & MicroCap |
| Sector: Tech, Finance, Energy, Staples, Retail, Industrial, Materials, Utilities & Medical |
|
Best Stocks Today 12Stocks.com |
© 2024 12Stocks.com Terms & Conditions Privacy Contact Us
All Information Provided Only For Education And Not To Be Used For Investing or Trading. See Terms & Conditions


One More Thing ... Get Best Stocks Delivered Daily!
Never Ever Miss A Move With Our Top Ten Stocks Lists
Find Best Stocks In Any Market - Bull or Bear Market
Take A Peek At Our Top Ten Stocks Lists: Daily, Weekly, Year-to-Date & Top Trends
Find Best Stocks In Any Market - Bull or Bear Market
Take A Peek At Our Top Ten Stocks Lists: Daily, Weekly, Year-to-Date & Top Trends
Smallcap Stocks With Best Up Trends [0-bearish to 100-bullish]: Emergent BioSolutions[100], Aspen Aerogels[100], Perdoceo Education[100], Gannett Co[100], Pitney Bowes[100], Benchmark Electronics[100], Origin Materials[100], FormFactor [100], Lantheus [100], Q2 [100], Blueprint Medicines[100]
Best Smallcap Stocks Year-to-Date:
Janux [440.16%], Viking [307.15%], Longboard [273.98%], Alpine Immune[239.23%], Bakkt [187.89%], Avidity Biosciences[182.96%], Vera [170.74%], Cullinan Oncology[169.74%], Super Micro[168.13%], Arcutis Bio[166.1%], Y-mAbs [153.08%] Best Smallcap Stocks This Week:
Deciphera [73.17%], Emergent BioSolutions[71.88%], Eyenovia [48.36%], Aspen Aerogels[47.89%], P3 Health[38.51%], Carvana Co[38.18%], Cue Biopharma[36.26%], Origin Materials[36.24%], TransMedics Group[35.13%], Seres [33.33%], Enovix [32.07%] Best Smallcap Stocks Daily:
Emergent BioSolutions[70.98%], Aspen Aerogels[56.44%], Carvana Co[33.77%], Perdoceo Education[31.79%], Enovix [31.06%], Office Properties[29.00%], Gannett Co[26.97%], Sunnova Energy[25.21%], Pitney Bowes[24.70%], Pulmonx [21.37%], CommScope Holding[20.38%]