
 Login Sign Up


| |||||
 |  | ||||

| 12Stocks.com Market Intelligence |
Best SmallCap Stocks
|
| In a hurry? Small Cap Stock Lists: Performance Trends Table, Stock Charts
Sort Small Cap stocks: Daily, Weekly, Year-to-Date, Market Cap & Trends. Filter Small Cap stocks list by sector: Show all, Tech, Finance, Energy, Staples, Retail, Industrial, Materials, Utilities and HealthCare Filter Small Cap stocks list by size: All Large Medium Small and MicroCap |
| 12Stocks.com Small Cap Stocks Performances & Trends Daily | |||||||||
|
|  The overall Smart Investing & Trading Score is 39 (0-bearish to 100-bullish) which puts Small Cap index in short term bearish to neutral trend. The Smart Investing & Trading Score from previous trading session is 41 and hence a deterioration of trend.
| ||||||||
Here are the Smart Investing & Trading Scores of the most requested small cap stocks at 12Stocks.com (click stock name for detailed review):
|


| 12Stocks.com: Investing in Smallcap Index with Stocks | |
|
The following table helps investors and traders sort through current performance and trends (as measured by Smart Investing & Trading Score) of various
stocks in the Smallcap Index. Quick View: Move mouse or cursor over stock symbol (ticker) to view short-term technical chart and over stock name to view long term chart. Click on  to add stock symbol to your watchlist and to add stock symbol to your watchlist and  to view watchlist. Click on any ticker or stock name for detailed market intelligence report for that stock. to view watchlist. Click on any ticker or stock name for detailed market intelligence report for that stock. |
12Stocks.com Performance of Stocks in Smallcap Index
| Ticker | Stock Name | Watchlist | Category | Recent Price | Smart Investing & Trading Score | Change % | YTD Change% |
| AIRS | AirSculpt |   | Health Care | 5.54 | 33 | -1.51% | -26.10% |
| JANX | Janux | | Health Care | 58.19 | 95 | 1.93% | 441.55% |
| EWTX | Edgewise | | Health Care | 19.00 | 95 | 5.94% | 67.44% |
| ANIP | ANI | | Health Care | 66.41 | 47 | 0.62% | 20.44% |
| BTAI | BioXcel | | Health Care | 2.56 | 20 | 1.39% | -13.39% |
| MORF | Morphic Holding | | Health Care | 27.99 | 10 | 2.64% | -3.08% |
| RCEL | Avita Medical | | Health Care | 8.66 | 17 | 3.10% | -36.88% |
| TRDA | Entrada | | Health Care | 13.23 | 42 | 11.65% | -19.38% |
| AVTE | Aerovate | | Health Care | 20.75 | 10 | 3.70% | -8.06% |
| RDNT | RadNet | | Health Care | 50.42 | 90 | 3.97% | 45.02% |
| PACB | Pacific Biosciences | | Health Care | 1.68 | 49 | 1.82% | -82.87% |
| AURA | Aura Biosciences | | Health Care | 7.65 | 67 | 3.38% | -13.56% |
| OSUR | OraSure | | Health Care | 5.34 | 23 | 0.95% | -34.88% |
| BTMD | biote | | Health Care | 5.64 | 35 | 2.36% | 13.71% |
| LNTH | Lantheus | | Health Care | 67.41 | 90 | 1.31% | 8.73% |
| VNDA | Vanda | | Health Care | 4.77 | 88 | 0.21% | 13.03% |
| BFLY | Butterfly | | Health Care | 0.79 | 39 | 1.40% | -30.35% |
| NAUT | Nautilus | | Health Care | 2.75 | 64 | 8.27% | -16.41% |
| WVE | Wave Life | | Health Care | 5.64 | 65 | 14.40% | 11.68% |
| PNTG | Pennant Group | | Health Care | 21.23 | 78 | 1.53% | 52.51% |
| QTRX | Quanterix | | Health Care | 16.50 | 42 | 2.36% | -39.65% |
| SRRK | Scholar Rock | | Health Care | 14.94 | 64 | 1.84% | -20.53% |
| ANIK | Anika | | Health Care | 26.47 | 95 | 2.24% | 16.81% |
| CGEM | Cullinan Oncology | | Health Care | 28.07 | 100 | 3.92% | 175.33% |
| SIGA | SIGA | | Health Care | 9.31 | 90 | 6.04% | 66.25% |
| For chart view version of above stock list: Chart View ➞ 0 - 25 , 25 - 50 , 50 - 75 , 75 - 100 , 100 - 125 , 125 - 150 , 150 - 175 , 175 - 200 , 200 - 225 , 225 - 250 , 250 - 275 , 275 - 300 , 300 - 325 , 325 - 350 | ||
 | Click To Change The Sort Order: By Market Cap or Company Size Performance: Year-to-date, Week and Day |  |
| Too many stocks? View smallcap stocks filtered by marketcap & sector |
| Marketcap: All SmallCap Stocks (default-no microcap), Large, Mid-Range, Small |
| Smallcap Sector: Tech, Finance, Energy, Staples, Retail, Industrial, Materials, & Medical |
|
Get the most comprehensive stock market coverage daily at 12Stocks.com ➞ Best Stocks Today ➞ Best Stocks Weekly ➞ Best Stocks Year-to-Date ➞ Best Stocks Trends ➞  Best Stocks Today 12Stocks.com Best Nasdaq Stocks ➞ Best S&P 500 Stocks ➞ Best Tech Stocks ➞ Best Biotech Stocks ➞ |
| Detailed Overview of SmallCap Stocks |
| SmallCap Technical Overview, Leaders & Laggards, Top SmallCap ETF Funds & Detailed SmallCap Stocks List, Charts, Trends & More |
| Smallcap: Technical Analysis, Trends & YTD Performance | |
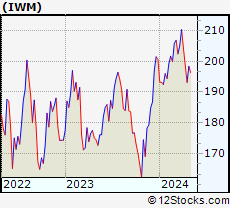
| SmallCap segment as represented by
IWM, an exchange-traded fund [ETF], holds basket of thousands of smallcap stocks from across all major sectors of the US stock market. The smallcap index (contains stocks like Riverbed & Sotheby's) is down by -2.19% and is currently underperforming the overall market by -6.73% year-to-date. Below is a quick view of technical charts and trends: | |
 IWM Weekly Chart |
|
| Long Term Trend: Not Good | |
| Medium Term Trend: Good | |
 IWM Daily Chart |
|
| Short Term Trend: Very Good | |
| Overall Trend Score: 39 | |
| YTD Performance: -2.19% | |
| **Trend Scores & Views Are Only For Educational Purposes And Not For Investing | |
| 12Stocks.com: Top Performing Small Cap Index Stocks | ||||||||||||||||||||||||||||||||||||||||||||||||
 The top performing Small Cap Index stocks year to date are
Now, more recently, over last week, the top performing Small Cap Index stocks on the move are


|
||||||||||||||||||||||||||||||||||||||||||||||||
| 12Stocks.com: Investing in Smallcap Index using Exchange Traded Funds | |
|
The following table shows list of key exchange traded funds (ETF) that
help investors track Smallcap index. The following list also includes leveraged ETF funds that track twice or thrice the daily returns of Smallcap indices. Short or inverse ETF funds move in the opposite direction to the index they track and are useful during market pullbacks or during bear markets. Quick View: Move mouse or cursor over ETF symbol (ticker) to view short-term technical chart and over ETF name to view long term chart. Click on ticker or stock name for detailed view. Click on to add stock symbol to your watchlist and to view watchlist. |
12Stocks.com List of ETFs that track Smallcap Index
| Ticker | ETF Name | Watchlist | Recent Price | Smart Investing & Trading Score | Change % | Week % | Year-to-date % |
| IWM | iShares Russell 2000 | | 196.31 | 39 | 0.21 | -1.05 | -2.19% |
| IJR | iShares Core S&P Small-Cap | | 104.75 | 22 | 0.34 | -0.85 | -3.23% |
| VTWO | Vanguard Russell 2000 ETF | | 79.37 | 14 | 0.27 | -1.06 | -2.13% |
| IWN | iShares Russell 2000 Value | | 149.91 | 22 | 0.58 | -0.81 | -3.49% |
| IJS | iShares S&P Small-Cap 600 Value | | 96.40 | 15 | 0.33 | -0.81 | -6.47% |
| IWO | iShares Russell 2000 Growth | | 249.70 | 7 | -0.25 | -1.34 | -1% |
| IJT | iShares S&P Small-Cap 600 Growth | | 124.90 | 15 | 0.24 | -0.94 | -0.19% |
| XSLV | PowerShares S&P SmallCap Low Volatil ETF | | 42.89 | 52 | 0.82 | 0.4 | -2.85% |
| SDD | ProShares UltraShort SmallCap600 | | 19.55 | 37 | -0.10 | 1.03 | 6.1% |
| SMLV | SPDR SSGA US Small Cap Low Volatil ETF | | 107.07 | 22 | 0.76 | -0.42 | -4.84% |
| SBB | ProShares Short SmallCap600 | | 16.50 | 20 | -0.30 | 0.7 | 3.58% |
| SAA | ProShares Ultra SmallCap600 | | 22.53 | 13 | -0.31 | -2.21 | -9.7% |
| 12Stocks.com: Charts, Trends, Fundamental Data and Performances of SmallCap Stocks | |
|
We now take in-depth look at all SmallCap stocks including charts, multi-period performances and overall trends (as measured by Smart Investing & Trading Score). One can sort SmallCap stocks (click link to choose) by Daily, Weekly and by Year-to-Date performances. Also, one can sort by size of the company or by market capitalization. |
| Select Your Default Chart Type: | |||||
| |||||
| Click on stock symbol or name for detailed view. Click on to add stock symbol to your watchlist and to view watchlist. Quick View: Move mouse or cursor over "Daily" to quickly view daily technical stock chart and over "Weekly" to view weekly technical stock chart. | |||||

 | AIRS AirSculpt Technologies, Inc. |
| Sector: Health Care | |
| SubSector: Medical Care Facilities | |
| MarketCap: 497 Millions | |
| Recent Price: 5.54 Smart Investing & Trading Score: 33 | |
| Day Percent Change: -1.51% Day Change: -0.08 | |
| Week Change: -1.34% Year-to-date Change: -26.1% | |
| AIRS Links: Profile News Message Board | |
| Charts:- Daily , Weekly | |
| Add AIRS to Watchlist: View: Get Complete AIRS Trend Analysis ➞ | |
 | JANX Janux Therapeutics, Inc. |
| Sector: Health Care | |
| SubSector: Biotechnology | |
| MarketCap: 496 Millions | |
| Recent Price: 58.19 Smart Investing & Trading Score: 95 | |
| Day Percent Change: 1.93% Day Change: 1.10 | |
| Week Change: 22.62% Year-to-date Change: 441.6% | |
| JANX Links: Profile News Message Board | |
| Charts:- Daily , Weekly | |
| Add JANX to Watchlist: View: Get Complete JANX Trend Analysis ➞ | |
 | EWTX Edgewise Therapeutics, Inc. |
| Sector: Health Care | |
| SubSector: Biotechnology | |
| MarketCap: 492 Millions | |
| Recent Price: 19.00 Smart Investing & Trading Score: 95 | |
| Day Percent Change: 5.94% Day Change: 1.06 | |
| Week Change: 17.5% Year-to-date Change: 67.4% | |
| EWTX Links: Profile News Message Board | |
| Charts:- Daily , Weekly | |
| Add EWTX to Watchlist: View: Get Complete EWTX Trend Analysis ➞ | |
 | ANIP ANI Pharmaceuticals, Inc. |
| Sector: Health Care | |
| SubSector: Biotechnology | |
| MarketCap: 489.285 Millions | |
| Recent Price: 66.41 Smart Investing & Trading Score: 47 | |
| Day Percent Change: 0.62% Day Change: 0.41 | |
| Week Change: 1.61% Year-to-date Change: 20.4% | |
| ANIP Links: Profile News Message Board | |
| Charts:- Daily , Weekly | |
| Add ANIP to Watchlist: View: Get Complete ANIP Trend Analysis ➞ | |
 | BTAI BioXcel Therapeutics, Inc. |
| Sector: Health Care | |
| SubSector: Biotechnology | |
| MarketCap: 487.485 Millions | |
| Recent Price: 2.56 Smart Investing & Trading Score: 20 | |
| Day Percent Change: 1.39% Day Change: 0.04 | |
| Week Change: -2.85% Year-to-date Change: -13.4% | |
| BTAI Links: Profile News Message Board | |
| Charts:- Daily , Weekly | |
| Add BTAI to Watchlist: View: Get Complete BTAI Trend Analysis ➞ | |
 | MORF Morphic Holding, Inc. |
| Sector: Health Care | |
| SubSector: Biotechnology | |
| MarketCap: 484.885 Millions | |
| Recent Price: 27.99 Smart Investing & Trading Score: 10 | |
| Day Percent Change: 2.64% Day Change: 0.72 | |
| Week Change: -0.29% Year-to-date Change: -3.1% | |
| MORF Links: Profile News Message Board | |
| Charts:- Daily , Weekly | |
| Add MORF to Watchlist: View: Get Complete MORF Trend Analysis ➞ | |
 | RCEL Avita Medical Limited |
| Sector: Health Care | |
| SubSector: Medical Appliances & Equipment | |
| MarketCap: 481.18 Millions | |
| Recent Price: 8.66 Smart Investing & Trading Score: 17 | |
| Day Percent Change: 3.10% Day Change: 0.26 | |
| Week Change: 1.64% Year-to-date Change: -36.9% | |
| RCEL Links: Profile News Message Board | |
| Charts:- Daily , Weekly | |
| Add RCEL to Watchlist: View: Get Complete RCEL Trend Analysis ➞ | |
 | TRDA Entrada Therapeutics, Inc. |
| Sector: Health Care | |
| SubSector: Biotechnology | |
| MarketCap: 481 Millions | |
| Recent Price: 13.23 Smart Investing & Trading Score: 42 | |
| Day Percent Change: 11.65% Day Change: 1.38 | |
| Week Change: 6.27% Year-to-date Change: -19.4% | |
| TRDA Links: Profile News Message Board | |
| Charts:- Daily , Weekly | |
| Add TRDA to Watchlist: View: Get Complete TRDA Trend Analysis ➞ | |
 | AVTE Aerovate Therapeutics, Inc. |
| Sector: Health Care | |
| SubSector: Biotechnology | |
| MarketCap: 478 Millions | |
| Recent Price: 20.75 Smart Investing & Trading Score: 10 | |
| Day Percent Change: 3.70% Day Change: 0.74 | |
| Week Change: -4.6% Year-to-date Change: -8.1% | |
| AVTE Links: Profile News Message Board | |
| Charts:- Daily , Weekly | |
| Add AVTE to Watchlist: View: Get Complete AVTE Trend Analysis ➞ | |
 | RDNT RadNet, Inc. |
| Sector: Health Care | |
| SubSector: Medical Laboratories & Research | |
| MarketCap: 473.2 Millions | |
| Recent Price: 50.42 Smart Investing & Trading Score: 90 | |
| Day Percent Change: 3.97% Day Change: 1.92 | |
| Week Change: 4.18% Year-to-date Change: 45.0% | |
| RDNT Links: Profile News Message Board | |
| Charts:- Daily , Weekly | |
| Add RDNT to Watchlist: View: Get Complete RDNT Trend Analysis ➞ | |
 | PACB Pacific Biosciences of California, Inc. |
| Sector: Health Care | |
| SubSector: Biotechnology | |
| MarketCap: 470.685 Millions | |
| Recent Price: 1.68 Smart Investing & Trading Score: 49 | |
| Day Percent Change: 1.82% Day Change: 0.03 | |
| Week Change: 14.29% Year-to-date Change: -82.9% | |
| PACB Links: Profile News Message Board | |
| Charts:- Daily , Weekly | |
| Add PACB to Watchlist: View: Get Complete PACB Trend Analysis ➞ | |
 | AURA Aura Biosciences, Inc. |
| Sector: Health Care | |
| SubSector: Biotechnology | |
| MarketCap: 469 Millions | |
| Recent Price: 7.65 Smart Investing & Trading Score: 67 | |
| Day Percent Change: 3.38% Day Change: 0.25 | |
| Week Change: 5.96% Year-to-date Change: -13.6% | |
| AURA Links: Profile News Message Board | |
| Charts:- Daily , Weekly | |
| Add AURA to Watchlist: View: Get Complete AURA Trend Analysis ➞ | |
 | OSUR OraSure Technologies, Inc. |
| Sector: Health Care | |
| SubSector: Medical Instruments & Supplies | |
| MarketCap: 468.26 Millions | |
| Recent Price: 5.34 Smart Investing & Trading Score: 23 | |
| Day Percent Change: 0.95% Day Change: 0.05 | |
| Week Change: 0.38% Year-to-date Change: -34.9% | |
| OSUR Links: Profile News Message Board | |
| Charts:- Daily , Weekly | |
| Add OSUR to Watchlist: View: Get Complete OSUR Trend Analysis ➞ | |
 | BTMD biote Corp. |
| Sector: Health Care | |
| SubSector: Medical Care Facilities | |
| MarketCap: 468 Millions | |
| Recent Price: 5.64 Smart Investing & Trading Score: 35 | |
| Day Percent Change: 2.36% Day Change: 0.13 | |
| Week Change: 2.17% Year-to-date Change: 13.7% | |
| BTMD Links: Profile News Message Board | |
| Charts:- Daily , Weekly | |
| Add BTMD to Watchlist: View: Get Complete BTMD Trend Analysis ➞ | |
 | LNTH Lantheus Holdings, Inc. |
| Sector: Health Care | |
| SubSector: Medical Appliances & Equipment | |
| MarketCap: 467.18 Millions | |
| Recent Price: 67.41 Smart Investing & Trading Score: 90 | |
| Day Percent Change: 1.31% Day Change: 0.87 | |
| Week Change: 2.82% Year-to-date Change: 8.7% | |
| LNTH Links: Profile News Message Board | |
| Charts:- Daily , Weekly | |
| Add LNTH to Watchlist: View: Get Complete LNTH Trend Analysis ➞ | |
 | VNDA Vanda Pharmaceuticals Inc. |
| Sector: Health Care | |
| SubSector: Biotechnology | |
| MarketCap: 464.585 Millions | |
| Recent Price: 4.77 Smart Investing & Trading Score: 88 | |
| Day Percent Change: 0.21% Day Change: 0.01 | |
| Week Change: 3.25% Year-to-date Change: 13.0% | |
| VNDA Links: Profile News Message Board | |
| Charts:- Daily , Weekly | |
| Add VNDA to Watchlist: View: Get Complete VNDA Trend Analysis ➞ | |
 | BFLY Butterfly Network, Inc. |
| Sector: Health Care | |
| SubSector: Medical Devices | |
| MarketCap: 461 Millions | |
| Recent Price: 0.79 Smart Investing & Trading Score: 39 | |
| Day Percent Change: 1.40% Day Change: 0.01 | |
| Week Change: 1.05% Year-to-date Change: -30.4% | |
| BFLY Links: Profile News Message Board | |
| Charts:- Daily , Weekly | |
| Add BFLY to Watchlist: View: Get Complete BFLY Trend Analysis ➞ | |
 | NAUT Nautilus Biotechnology, Inc. |
| Sector: Health Care | |
| SubSector: Biotechnology | |
| MarketCap: 458 Millions | |
| Recent Price: 2.75 Smart Investing & Trading Score: 64 | |
| Day Percent Change: 8.27% Day Change: 0.21 | |
| Week Change: 10.44% Year-to-date Change: -16.4% | |
| NAUT Links: Profile News Message Board | |
| Charts:- Daily , Weekly | |
| Add NAUT to Watchlist: View: Get Complete NAUT Trend Analysis ➞ | |
 | WVE Wave Life Sciences Ltd. |
| Sector: Health Care | |
| SubSector: Biotechnology | |
| MarketCap: 452.785 Millions | |
| Recent Price: 5.64 Smart Investing & Trading Score: 65 | |
| Day Percent Change: 14.40% Day Change: 0.71 | |
| Week Change: 21.03% Year-to-date Change: 11.7% | |
| WVE Links: Profile News Message Board | |
| Charts:- Daily , Weekly | |
| Add WVE to Watchlist: View: Get Complete WVE Trend Analysis ➞ | |
 | PNTG The Pennant Group, Inc. |
| Sector: Health Care | |
| SubSector: Long-Term Care Facilities | |
| MarketCap: 451.786 Millions | |
| Recent Price: 21.23 Smart Investing & Trading Score: 78 | |
| Day Percent Change: 1.53% Day Change: 0.32 | |
| Week Change: 2.17% Year-to-date Change: 52.5% | |
| PNTG Links: Profile News Message Board | |
| Charts:- Daily , Weekly | |
| Add PNTG to Watchlist: View: Get Complete PNTG Trend Analysis ➞ | |
 | QTRX Quanterix Corporation |
| Sector: Health Care | |
| SubSector: Biotechnology | |
| MarketCap: 448.685 Millions | |
| Recent Price: 16.50 Smart Investing & Trading Score: 42 | |
| Day Percent Change: 2.36% Day Change: 0.38 | |
| Week Change: 6.04% Year-to-date Change: -39.7% | |
| QTRX Links: Profile News Message Board | |
| Charts:- Daily , Weekly | |
| Add QTRX to Watchlist: View: Get Complete QTRX Trend Analysis ➞ | |
 | SRRK Scholar Rock Holding Corporation |
| Sector: Health Care | |
| SubSector: Biotechnology | |
| MarketCap: 441.385 Millions | |
| Recent Price: 14.94 Smart Investing & Trading Score: 64 | |
| Day Percent Change: 1.84% Day Change: 0.27 | |
| Week Change: 2.82% Year-to-date Change: -20.5% | |
| SRRK Links: Profile News Message Board | |
| Charts:- Daily , Weekly | |
| Add SRRK to Watchlist: View: Get Complete SRRK Trend Analysis ➞ | |
 | ANIK Anika Therapeutics, Inc. |
| Sector: Health Care | |
| SubSector: Biotechnology | |
| MarketCap: 438.385 Millions | |
| Recent Price: 26.47 Smart Investing & Trading Score: 95 | |
| Day Percent Change: 2.24% Day Change: 0.58 | |
| Week Change: 3.52% Year-to-date Change: 16.8% | |
| ANIK Links: Profile News Message Board | |
| Charts:- Daily , Weekly | |
| Add ANIK to Watchlist: View: Get Complete ANIK Trend Analysis ➞ | |
 | CGEM Cullinan Oncology, Inc. |
| Sector: Health Care | |
| SubSector: Biotechnology | |
| MarketCap: 433 Millions | |
| Recent Price: 28.07 Smart Investing & Trading Score: 100 | |
| Day Percent Change: 3.92% Day Change: 1.06 | |
| Week Change: 10.95% Year-to-date Change: 175.3% | |
| CGEM Links: Profile News Message Board | |
| Charts:- Daily , Weekly | |
| Add CGEM to Watchlist: View: Get Complete CGEM Trend Analysis ➞ | |
 | SIGA SIGA Technologies, Inc. |
| Sector: Health Care | |
| SubSector: Biotechnology | |
| MarketCap: 424.285 Millions | |
| Recent Price: 9.31 Smart Investing & Trading Score: 90 | |
| Day Percent Change: 6.04% Day Change: 0.53 | |
| Week Change: 5.92% Year-to-date Change: 66.3% | |
| SIGA Links: Profile News Message Board | |
| Charts:- Daily , Weekly | |
| Add SIGA to Watchlist: View: Get Complete SIGA Trend Analysis ➞ | |
| For tabular summary view of above stock list: Summary View ➞ 0 - 25 , 25 - 50 , 50 - 75 , 75 - 100 , 100 - 125 , 125 - 150 , 150 - 175 , 175 - 200 , 200 - 225 , 225 - 250 , 250 - 275 , 275 - 300 , 300 - 325 , 325 - 350 | ||
| Click To Change The Sort Order: By Market Cap or Company Size Performance: Year-to-date, Week and Day | |
| Select Chart Type: | ||
| Too many stocks? View smallcap stocks filtered by marketcap & sector |
| Marketcap: All SmallCap Stocks (default-no microcap), Large, Mid-Range, Small & MicroCap |
| Sector: Tech, Finance, Energy, Staples, Retail, Industrial, Materials, Utilities & Medical |
|
Best Stocks Today 12Stocks.com |
© 2024 12Stocks.com Terms & Conditions Privacy Contact Us
All Information Provided Only For Education And Not To Be Used For Investing or Trading. See Terms & Conditions


One More Thing ... Get Best Stocks Delivered Daily!
Never Ever Miss A Move With Our Top Ten Stocks Lists
Find Best Stocks In Any Market - Bull or Bear Market
Take A Peek At Our Top Ten Stocks Lists: Daily, Weekly, Year-to-Date & Top Trends
Find Best Stocks In Any Market - Bull or Bear Market
Take A Peek At Our Top Ten Stocks Lists: Daily, Weekly, Year-to-Date & Top Trends
Smallcap Stocks With Best Up Trends [0-bearish to 100-bullish]: Surmodics [100], Rocky Brands[100], TransMedics Group[100], LendingClub [100], A10 s[100], Carpenter [100], UFP [100], PROCEPT BioRobotics[100], Xencor [100], Trinity Industries[100], TPG RE[100]
Best Smallcap Stocks Year-to-Date:
Janux [441.55%], Viking [310.45%], Longboard [259.25%], Alpine Immune[239.26%], Avidity Biosciences[185.4%], Bakkt [182.96%], Cullinan Oncology[175.33%], Vera [173.32%], Arcutis Bio[173.07%], Super Micro[159.62%], Y-mAbs [141.35%] Best Smallcap Stocks This Week:
Deciphera [73.07%], Eyenovia [44.86%], Cue Biopharma[39.93%], Poseida [30.52%], Seres [30.3%], P3 Health[29.62%], Phibro Animal[28.75%], TransMedics Group[27.69%], Surmodics [27.24%], LendingTree [26.12%], Rocky Brands[24.58%] Best Smallcap Stocks Daily:
Surmodics [29.62%], Rocky Brands[28.06%], TransMedics Group[24.91%], Ventyx Biosciences[24.63%], Eyenovia [21.17%], LendingClub [19.68%], Summit [19.08%], Powell Industries[18.74%], MiMedx Group[18.34%], CareDx [18.04%], A10 s[17.69%]