
 Login Sign Up


| |||||
 |  | ||||

| 12Stocks.com Market Intelligence |
Best SmallCap Stocks
|
| In a hurry? Small Cap Stock Lists: Performance Trends Table, Stock Charts
Sort Small Cap stocks: Daily, Weekly, Year-to-Date, Market Cap & Trends. Filter Small Cap stocks list by sector: Show all, Tech, Finance, Energy, Staples, Retail, Industrial, Materials, Utilities and HealthCare Filter Small Cap stocks list by size: All Large Medium Small and MicroCap |
| 12Stocks.com Small Cap Stocks Performances & Trends Daily | |||||||||
|
|  The overall Smart Investing & Trading Score is 69 (0-bearish to 100-bullish) which puts Small Cap index in short term neutral to bullish trend. The Smart Investing & Trading Score from previous trading session is 49 and hence an improvement of trend.
| ||||||||
Here are the Smart Investing & Trading Scores of the most requested small cap stocks at 12Stocks.com (click stock name for detailed review):
|


| 12Stocks.com: Investing in Smallcap Index with Stocks | |
|
The following table helps investors and traders sort through current performance and trends (as measured by Smart Investing & Trading Score) of various
stocks in the Smallcap Index. Quick View: Move mouse or cursor over stock symbol (ticker) to view short-term technical chart and over stock name to view long term chart. Click on  to add stock symbol to your watchlist and to add stock symbol to your watchlist and  to view watchlist. Click on any ticker or stock name for detailed market intelligence report for that stock. to view watchlist. Click on any ticker or stock name for detailed market intelligence report for that stock. |
12Stocks.com Performance of Stocks in Smallcap Index
| Ticker | Stock Name | Watchlist | Category | Recent Price | Smart Investing & Trading Score | Change % | YTD Change% |
| FN | Fabrinet |   | Technology | 176.64 | 64 | 1.41% | -7.19% |
| UIS | Unisys | | Technology | 5.21 | 22 | -0.57% | -7.30% |
| PRGS | Progress | | Technology | 50.31 | 42 | -0.26% | -7.35% |
| RXT | Rackspace | | Technology | 1.86 | 69 | 6.61% | -7.48% |
| SWI | SolarWinds | | Technology | 11.55 | 64 | -0.26% | -7.53% |
| PLAB | Photronics | | Technology | 28.91 | 77 | 2.74% | -7.84% |
| KN | Knowles | | Technology | 16.41 | 87 | 1.26% | -8.35% |
| LASR | nLIGHT | | Technology | 12.31 | 64 | 6.44% | -8.85% |
| DIOD | Diodes | | Technology | 73.36 | 88 | 0.60% | -8.90% |
| SEMR | Semrush | | Technology | 12.63 | 95 | -0.08% | -9.07% |
| BLKB | Blackbaud | | Technology | 78.73 | 88 | 0.38% | -9.19% |
| CEVA | CEVA | | Technology | 20.59 | 59 | 2.29% | -9.34% |
| ROG | Rogers | | Technology | 119.36 | 83 | -0.53% | -9.62% |
| COMP | Compass | | Technology | 3.37 | 37 | 7.00% | -9.66% |
| ESE | ESCO | | Technology | 105.57 | 90 | 0.08% | -9.80% |
| GOGO | Gogo | | Technology | 9.13 | 83 | 0.27% | -9.82% |
| EVTC | EVERTEC | | Technology | 36.52 | 26 | 2.17% | -10.81% |
| CNXN | PC Connection | | Technology | 59.92 | 0 | 1.06% | -10.85% |
| AEIS | Advanced Energy | | Technology | 97.09 | 57 | 1.53% | -10.86% |
| AMSWA | American | | Technology | 10.03 | 18 | -0.30% | -11.24% |
| CRDO | Credo | | Technology | 17.32 | 24 | 0.38% | -11.45% |
| PD | PagerDuty | | Technology | 20.48 | 32 | 0.20% | -11.53% |
| UPWK | Upwork | | Technology | 13.14 | 82 | 1.15% | -11.63% |
| RDVT | Red Violet | | Technology | 17.56 | 42 | 0.72% | -12.09% |
| ITI | Iteris | | Technology | 4.53 | 35 | -0.33% | -12.98% |
| For chart view version of above stock list: Chart View ➞ 0 - 25 , 25 - 50 , 50 - 75 , 75 - 100 , 100 - 125 , 125 - 150 , 150 - 175 , 175 - 200 , 200 - 225 , 225 - 250 , 250 - 275 | ||
 | Click To Change The Sort Order: By Market Cap or Company Size Performance: Year-to-date, Week and Day |  |
| Too many stocks? View smallcap stocks filtered by marketcap & sector |
| Marketcap: All SmallCap Stocks (default-no microcap), Large, Mid-Range, Small |
| Smallcap Sector: Tech, Finance, Energy, Staples, Retail, Industrial, Materials, & Medical |
|
Get the most comprehensive stock market coverage daily at 12Stocks.com ➞ Best Stocks Today ➞ Best Stocks Weekly ➞ Best Stocks Year-to-Date ➞ Best Stocks Trends ➞  Best Stocks Today 12Stocks.com Best Nasdaq Stocks ➞ Best S&P 500 Stocks ➞ Best Tech Stocks ➞ Best Biotech Stocks ➞ |
| Detailed Overview of SmallCap Stocks |
| SmallCap Technical Overview, Leaders & Laggards, Top SmallCap ETF Funds & Detailed SmallCap Stocks List, Charts, Trends & More |
| Smallcap: Technical Analysis, Trends & YTD Performance | |
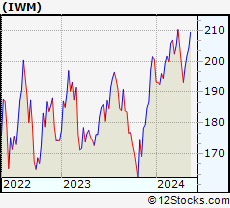
| SmallCap segment as represented by
IWM, an exchange-traded fund [ETF], holds basket of thousands of smallcap stocks from across all major sectors of the US stock market. The smallcap index (contains stocks like Riverbed & Sotheby's) is up by 0.22% and is currently underperforming the overall market by -6.27% year-to-date. Below is a quick view of technical charts and trends: | |
 IWM Weekly Chart |
|
| Long Term Trend: Not Good | |
| Medium Term Trend: Very Good | |
 IWM Daily Chart |
|
| Short Term Trend: Very Good | |
| Overall Trend Score: 69 | |
| YTD Performance: 0.22% | |
| **Trend Scores & Views Are Only For Educational Purposes And Not For Investing | |
| 12Stocks.com: Top Performing Small Cap Index Stocks | ||||||||||||||||||||||||||||||||||||||||||||||||
 The top performing Small Cap Index stocks year to date are
Now, more recently, over last week, the top performing Small Cap Index stocks on the move are


|
||||||||||||||||||||||||||||||||||||||||||||||||
| 12Stocks.com: Investing in Smallcap Index using Exchange Traded Funds | |
|
The following table shows list of key exchange traded funds (ETF) that
help investors track Smallcap index. The following list also includes leveraged ETF funds that track twice or thrice the daily returns of Smallcap indices. Short or inverse ETF funds move in the opposite direction to the index they track and are useful during market pullbacks or during bear markets. Quick View: Move mouse or cursor over ETF symbol (ticker) to view short-term technical chart and over ETF name to view long term chart. Click on ticker or stock name for detailed view. Click on to add stock symbol to your watchlist and to view watchlist. |
12Stocks.com List of ETFs that track Smallcap Index
| Ticker | ETF Name | Watchlist | Recent Price | Smart Investing & Trading Score | Change % | Week % | Year-to-date % |
| IWM | iShares Russell 2000 | | 201.15 | 69 | 0.61 | 1.39 | 0.22% |
| IJR | iShares Core S&P Small-Cap | | 106.83 | 82 | 0.47 | 1.12 | -1.31% |
| SDD | ProShares UltraShort SmallCap600 | | 18.35 | 10 | -4.97 | -5.17 | -0.42% |
| SBB | ProShares Short SmallCap600 | | 16.33 | 41 | -0.25 | -0.34 | 2.51% |
| SAA | ProShares Ultra SmallCap600 | | 23.93 | 82 | 4.36 | 3.88 | -4.07% |
| 12Stocks.com: Charts, Trends, Fundamental Data and Performances of SmallCap Stocks | |
|
We now take in-depth look at all SmallCap stocks including charts, multi-period performances and overall trends (as measured by Smart Investing & Trading Score). One can sort SmallCap stocks (click link to choose) by Daily, Weekly and by Year-to-Date performances. Also, one can sort by size of the company or by market capitalization. |
| Select Your Default Chart Type: | |||||
| |||||
| Click on stock symbol or name for detailed view. Click on to add stock symbol to your watchlist and to view watchlist. Quick View: Move mouse or cursor over "Daily" to quickly view daily technical stock chart and over "Weekly" to view weekly technical stock chart. | |||||

 | FN Fabrinet |
| Sector: Technology | |
| SubSector: Electronic Equipment | |
| MarketCap: 1876 Millions | |
| Recent Price: 176.64 Smart Investing & Trading Score: 64 | |
| Day Percent Change: 1.41% Day Change: 2.45 | |
| Week Change: 0.68% Year-to-date Change: -7.2% | |
| FN Links: Profile News Message Board | |
| Charts:- Daily , Weekly | |
| Add FN to Watchlist: View: Get Complete FN Trend Analysis ➞ | |
 | UIS Unisys Corporation |
| Sector: Technology | |
| SubSector: Information Technology Services | |
| MarketCap: 803.868 Millions | |
| Recent Price: 5.21 Smart Investing & Trading Score: 22 | |
| Day Percent Change: -0.57% Day Change: -0.03 | |
| Week Change: -4.58% Year-to-date Change: -7.3% | |
| UIS Links: Profile News Message Board | |
| Charts:- Daily , Weekly | |
| Add UIS to Watchlist: View: Get Complete UIS Trend Analysis ➞ | |
 | PRGS Progress Software Corporation |
| Sector: Technology | |
| SubSector: Application Software | |
| MarketCap: 1407.22 Millions | |
| Recent Price: 50.31 Smart Investing & Trading Score: 42 | |
| Day Percent Change: -0.26% Day Change: -0.13 | |
| Week Change: -0.06% Year-to-date Change: -7.4% | |
| PRGS Links: Profile News Message Board | |
| Charts:- Daily , Weekly | |
| Add PRGS to Watchlist: View: Get Complete PRGS Trend Analysis ➞ | |
 | RXT Rackspace Technology, Inc. |
| Sector: Technology | |
| SubSector: Software Infrastructure | |
| MarketCap: 40287 Millions | |
| Recent Price: 1.86 Smart Investing & Trading Score: 69 | |
| Day Percent Change: 6.61% Day Change: 0.11 | |
| Week Change: 6% Year-to-date Change: -7.5% | |
| RXT Links: Profile News Message Board | |
| Charts:- Daily , Weekly | |
| Add RXT to Watchlist: View: Get Complete RXT Trend Analysis ➞ | |
 | SWI SolarWinds Corporation |
| Sector: Technology | |
| SubSector: Application Software | |
| MarketCap: 4524.62 Millions | |
| Recent Price: 11.55 Smart Investing & Trading Score: 64 | |
| Day Percent Change: -0.26% Day Change: -0.03 | |
| Week Change: 3.87% Year-to-date Change: -7.5% | |
| SWI Links: Profile News Message Board | |
| Charts:- Daily , Weekly | |
| Add SWI to Watchlist: View: Get Complete SWI Trend Analysis ➞ | |
 | PLAB Photronics, Inc. |
| Sector: Technology | |
| SubSector: Semiconductor Equipment & Materials | |
| MarketCap: 709.018 Millions | |
| Recent Price: 28.91 Smart Investing & Trading Score: 77 | |
| Day Percent Change: 2.74% Day Change: 0.77 | |
| Week Change: 2.23% Year-to-date Change: -7.8% | |
| PLAB Links: Profile News Message Board | |
| Charts:- Daily , Weekly | |
| Add PLAB to Watchlist: View: Get Complete PLAB Trend Analysis ➞ | |
 | KN Knowles Corporation |
| Sector: Technology | |
| SubSector: Communication Equipment | |
| MarketCap: 1231.39 Millions | |
| Recent Price: 16.41 Smart Investing & Trading Score: 87 | |
| Day Percent Change: 1.26% Day Change: 0.20 | |
| Week Change: 2.4% Year-to-date Change: -8.4% | |
| KN Links: Profile News Message Board | |
| Charts:- Daily , Weekly | |
| Add KN to Watchlist: View: Get Complete KN Trend Analysis ➞ | |
 | LASR nLIGHT, Inc. |
| Sector: Technology | |
| SubSector: Semiconductor - Broad Line | |
| MarketCap: 445.642 Millions | |
| Recent Price: 12.31 Smart Investing & Trading Score: 64 | |
| Day Percent Change: 6.44% Day Change: 0.74 | |
| Week Change: 6.49% Year-to-date Change: -8.9% | |
| LASR Links: Profile News Message Board | |
| Charts:- Daily , Weekly | |
| Add LASR to Watchlist: View: Get Complete LASR Trend Analysis ➞ | |
 | DIOD Diodes Incorporated |
| Sector: Technology | |
| SubSector: Semiconductor - Integrated Circuits | |
| MarketCap: 1967.6 Millions | |
| Recent Price: 73.36 Smart Investing & Trading Score: 88 | |
| Day Percent Change: 0.60% Day Change: 0.44 | |
| Week Change: 0.93% Year-to-date Change: -8.9% | |
| DIOD Links: Profile News Message Board | |
| Charts:- Daily , Weekly | |
| Add DIOD to Watchlist: View: Get Complete DIOD Trend Analysis ➞ | |
 | SEMR Semrush Holdings, Inc. |
| Sector: Technology | |
| SubSector: Software - Application | |
| MarketCap: 1330 Millions | |
| Recent Price: 12.63 Smart Investing & Trading Score: 95 | |
| Day Percent Change: -0.08% Day Change: -0.01 | |
| Week Change: 5.07% Year-to-date Change: -9.1% | |
| SEMR Links: Profile News Message Board | |
| Charts:- Daily , Weekly | |
| Add SEMR to Watchlist: View: Get Complete SEMR Trend Analysis ➞ | |
 | BLKB Blackbaud, Inc. |
| Sector: Technology | |
| SubSector: Business Software & Services | |
| MarketCap: 2838.48 Millions | |
| Recent Price: 78.73 Smart Investing & Trading Score: 88 | |
| Day Percent Change: 0.38% Day Change: 0.30 | |
| Week Change: 1% Year-to-date Change: -9.2% | |
| BLKB Links: Profile News Message Board | |
| Charts:- Daily , Weekly | |
| Add BLKB to Watchlist: View: Get Complete BLKB Trend Analysis ➞ | |
 | CEVA CEVA, Inc. |
| Sector: Technology | |
| SubSector: Semiconductor - Specialized | |
| MarketCap: 587.06 Millions | |
| Recent Price: 20.59 Smart Investing & Trading Score: 59 | |
| Day Percent Change: 2.29% Day Change: 0.46 | |
| Week Change: 3.05% Year-to-date Change: -9.3% | |
| CEVA Links: Profile News Message Board | |
| Charts:- Daily , Weekly | |
| Add CEVA to Watchlist: View: Get Complete CEVA Trend Analysis ➞ | |
 | ROG Rogers Corporation |
| Sector: Technology | |
| SubSector: Diversified Electronics | |
| MarketCap: 1756.36 Millions | |
| Recent Price: 119.36 Smart Investing & Trading Score: 83 | |
| Day Percent Change: -0.53% Day Change: -0.64 | |
| Week Change: -1.38% Year-to-date Change: -9.6% | |
| ROG Links: Profile News Message Board | |
| Charts:- Daily , Weekly | |
| Add ROG to Watchlist: View: Get Complete ROG Trend Analysis ➞ | |
 | COMP Compass, Inc. |
| Sector: Technology | |
| SubSector: Software - Application | |
| MarketCap: 1580 Millions | |
| Recent Price: 3.37 Smart Investing & Trading Score: 37 | |
| Day Percent Change: 7.00% Day Change: 0.22 | |
| Week Change: 1.97% Year-to-date Change: -9.7% | |
| COMP Links: Profile News Message Board | |
| Charts:- Daily , Weekly | |
| Add COMP to Watchlist: View: Get Complete COMP Trend Analysis ➞ | |
 | ESE ESCO Technologies Inc. |
| Sector: Technology | |
| SubSector: Scientific & Technical Instruments | |
| MarketCap: 1968.03 Millions | |
| Recent Price: 105.57 Smart Investing & Trading Score: 90 | |
| Day Percent Change: 0.08% Day Change: 0.08 | |
| Week Change: 0.21% Year-to-date Change: -9.8% | |
| ESE Links: Profile News Message Board | |
| Charts:- Daily , Weekly | |
| Add ESE to Watchlist: View: Get Complete ESE Trend Analysis ➞ | |
 | GOGO Gogo Inc. |
| Sector: Technology | |
| SubSector: Diversified Communication Services | |
| MarketCap: 307.064 Millions | |
| Recent Price: 9.13 Smart Investing & Trading Score: 83 | |
| Day Percent Change: 0.27% Day Change: 0.03 | |
| Week Change: -0.05% Year-to-date Change: -9.8% | |
| GOGO Links: Profile News Message Board | |
| Charts:- Daily , Weekly | |
| Add GOGO to Watchlist: View: Get Complete GOGO Trend Analysis ➞ | |
 | EVTC EVERTEC, Inc. |
| Sector: Technology | |
| SubSector: Business Software & Services | |
| MarketCap: 1646.08 Millions | |
| Recent Price: 36.52 Smart Investing & Trading Score: 26 | |
| Day Percent Change: 2.17% Day Change: 0.77 | |
| Week Change: -4.98% Year-to-date Change: -10.8% | |
| EVTC Links: Profile News Message Board | |
| Charts:- Daily , Weekly | |
| Add EVTC to Watchlist: View: Get Complete EVTC Trend Analysis ➞ | |
 | CNXN PC Connection, Inc. |
| Sector: Technology | |
| SubSector: Computers Wholesale | |
| MarketCap: 1020.19 Millions | |
| Recent Price: 59.92 Smart Investing & Trading Score: 0 | |
| Day Percent Change: 1.06% Day Change: 0.63 | |
| Week Change: -5.92% Year-to-date Change: -10.9% | |
| CNXN Links: Profile News Message Board | |
| Charts:- Daily , Weekly | |
| Add CNXN to Watchlist: View: Get Complete CNXN Trend Analysis ➞ | |
 | AEIS Advanced Energy Industries, Inc. |
| Sector: Technology | |
| SubSector: Diversified Electronics | |
| MarketCap: 1641.86 Millions | |
| Recent Price: 97.09 Smart Investing & Trading Score: 57 | |
| Day Percent Change: 1.53% Day Change: 1.47 | |
| Week Change: 1.18% Year-to-date Change: -10.9% | |
| AEIS Links: Profile News Message Board | |
| Charts:- Daily , Weekly | |
| Add AEIS to Watchlist: View: Get Complete AEIS Trend Analysis ➞ | |
 | AMSWA American Software, Inc. |
| Sector: Technology | |
| SubSector: Application Software | |
| MarketCap: 389.862 Millions | |
| Recent Price: 10.03 Smart Investing & Trading Score: 18 | |
| Day Percent Change: -0.30% Day Change: -0.03 | |
| Week Change: -1.86% Year-to-date Change: -11.2% | |
| AMSWA Links: Profile News Message Board | |
| Charts:- Daily , Weekly | |
| Add AMSWA to Watchlist: View: Get Complete AMSWA Trend Analysis ➞ | |
 | CRDO Credo Technology Group Holding Ltd |
| Sector: Technology | |
| SubSector: Communication Equipment | |
| MarketCap: 2590 Millions | |
| Recent Price: 17.32 Smart Investing & Trading Score: 24 | |
| Day Percent Change: 0.38% Day Change: 0.07 | |
| Week Change: -6.66% Year-to-date Change: -11.5% | |
| CRDO Links: Profile News Message Board | |
| Charts:- Daily , Weekly | |
| Add CRDO to Watchlist: View: Get Complete CRDO Trend Analysis ➞ | |
 | PD PagerDuty, Inc. |
| Sector: Technology | |
| SubSector: Application Software | |
| MarketCap: 1690.32 Millions | |
| Recent Price: 20.48 Smart Investing & Trading Score: 32 | |
| Day Percent Change: 0.20% Day Change: 0.04 | |
| Week Change: -1.68% Year-to-date Change: -11.5% | |
| PD Links: Profile News Message Board | |
| Charts:- Daily , Weekly | |
| Add PD to Watchlist: View: Get Complete PD Trend Analysis ➞ | |
 | UPWK Upwork Inc. |
| Sector: Technology | |
| SubSector: Internet Information Providers | |
| MarketCap: 815.98 Millions | |
| Recent Price: 13.14 Smart Investing & Trading Score: 82 | |
| Day Percent Change: 1.15% Day Change: 0.15 | |
| Week Change: 13.67% Year-to-date Change: -11.6% | |
| UPWK Links: Profile News Message Board | |
| Charts:- Daily , Weekly | |
| Add UPWK to Watchlist: View: Get Complete UPWK Trend Analysis ➞ | |
 | RDVT Red Violet, Inc. |
| Sector: Technology | |
| SubSector: Application Software | |
| MarketCap: 215.162 Millions | |
| Recent Price: 17.56 Smart Investing & Trading Score: 42 | |
| Day Percent Change: 0.72% Day Change: 0.13 | |
| Week Change: 3.33% Year-to-date Change: -12.1% | |
| RDVT Links: Profile News Message Board | |
| Charts:- Daily , Weekly | |
| Add RDVT to Watchlist: View: Get Complete RDVT Trend Analysis ➞ | |
 | ITI Iteris, Inc. |
| Sector: Technology | |
| SubSector: Communication Equipment | |
| MarketCap: 129.939 Millions | |
| Recent Price: 4.53 Smart Investing & Trading Score: 35 | |
| Day Percent Change: -0.33% Day Change: -0.01 | |
| Week Change: 1% Year-to-date Change: -13.0% | |
| ITI Links: Profile News Message Board | |
| Charts:- Daily , Weekly | |
| Add ITI to Watchlist: View: Get Complete ITI Trend Analysis ➞ | |
| For tabular summary view of above stock list: Summary View ➞ 0 - 25 , 25 - 50 , 50 - 75 , 75 - 100 , 100 - 125 , 125 - 150 , 150 - 175 , 175 - 200 , 200 - 225 , 225 - 250 , 250 - 275 | ||
| Click To Change The Sort Order: By Market Cap or Company Size Performance: Year-to-date, Week and Day | |
| Select Chart Type: | ||
| Too many stocks? View smallcap stocks filtered by marketcap & sector |
| Marketcap: All SmallCap Stocks (default-no microcap), Large, Mid-Range, Small & MicroCap |
| Sector: Tech, Finance, Energy, Staples, Retail, Industrial, Materials, Utilities & Medical |
|
Best Stocks Today 12Stocks.com |
© 2024 12Stocks.com Terms & Conditions Privacy Contact Us
All Information Provided Only For Education And Not To Be Used For Investing or Trading. See Terms & Conditions


One More Thing ... Get Best Stocks Delivered Daily!
Never Ever Miss A Move With Our Top Ten Stocks Lists
Find Best Stocks In Any Market - Bull or Bear Market
Take A Peek At Our Top Ten Stocks Lists: Daily, Weekly, Year-to-Date & Top Trends
Find Best Stocks In Any Market - Bull or Bear Market
Take A Peek At Our Top Ten Stocks Lists: Daily, Weekly, Year-to-Date & Top Trends
Smallcap Stocks With Best Up Trends [0-bearish to 100-bullish]: WideOpenWest [100], FTC Solar[100], IES [100], Origin Materials[100], Alignment Healthcare[100], Joint [100], Emergent BioSolutions[100], Adtalem Global[100], El Pollo[100], Enovix [100], Clearfield [100]
Best Smallcap Stocks Year-to-Date:
Janux [482.74%], Viking [306.72%], Longboard [272.5%], Alpine Immune[239.34%], Bakkt [199.55%], Avidity Biosciences[195.24%], Vera [189.47%], Cullinan Oncology[176.9%], Super Micro[173.85%], Arcutis Bio[169.66%], Y-mAbs [154.69%] Best Smallcap Stocks This Week:
Emergent BioSolutions[102.34%], Deciphera [73.28%], Eyenovia [68.74%], Origin Materials[66.52%], Aspen Aerogels[54.66%], Enovix [51.85%], TPI Composites[41.91%], Codexis [41.73%], Cue Biopharma[41.39%], WideOpenWest [41.07%], Carvana Co[39.19%] Best Smallcap Stocks Daily:
WideOpenWest [29.16%], Ardelyx [28.65%], FTC Solar[25.09%], IES [23.96%], Twist Bioscience[23.18%], Origin Materials[22.23%], Alignment Healthcare[21.97%], Joint [18.43%], Emergent BioSolutions[17.73%], Butterfly [17.42%], Vaxxinity [17.27%]