
 Login Sign Up


| |||||
 |  | ||||

| 12Stocks.com Market Intelligence |
Best SmallCap Stocks
|
| In a hurry? Small Cap Stock Lists: Performance Trends Table, Stock Charts
Sort Small Cap stocks: Daily, Weekly, Year-to-Date, Market Cap & Trends. Filter Small Cap stocks list by sector: Show all, Tech, Finance, Energy, Staples, Retail, Industrial, Materials, Utilities and HealthCare Filter Small Cap stocks list by size: All Large Medium Small and MicroCap |
| 12Stocks.com Small Cap Stocks Performances & Trends Daily | |||||||||
|
|  The overall Smart Investing & Trading Score is 82 (0-bearish to 100-bullish) which puts Small Cap index in short term bullish trend. The Smart Investing & Trading Score from previous trading session is 69 and hence an improvement of trend.
| ||||||||
Here are the Smart Investing & Trading Scores of the most requested small cap stocks at 12Stocks.com (click stock name for detailed review):
|


| 12Stocks.com: Investing in Smallcap Index with Stocks | |
|
The following table helps investors and traders sort through current performance and trends (as measured by Smart Investing & Trading Score) of various
stocks in the Smallcap Index. Quick View: Move mouse or cursor over stock symbol (ticker) to view short-term technical chart and over stock name to view long term chart. Click on  to add stock symbol to your watchlist and to add stock symbol to your watchlist and  to view watchlist. Click on any ticker or stock name for detailed market intelligence report for that stock. to view watchlist. Click on any ticker or stock name for detailed market intelligence report for that stock. |
12Stocks.com Performance of Stocks in Smallcap Index
| Ticker | Stock Name | Watchlist | Category | Recent Price | Smart Investing & Trading Score | Change % | YTD Change% |
| NDLS | Noodles & |   | Services & Goods | 1.76 | 39 | 11.39 | -44.13% |
| LINC | Loln Educational | | Services & Goods | 12.25 | 60 | 10.46 | 22.01% |
| TDUP | ThredUp | | Services & Goods | 1.86 | 69 | 8.45 | -17.70% |
| NL | NL Industries | | Services & Goods | 8.82 | 90 | 7.04 | 57.22% |
| NSSC | Napco Security | | Services & Goods | 45.28 | 74 | 6.62 | 32.20% |
| CIX | CompX | | Services & Goods | 34.67 | 60 | 6.15 | 37.14% |
| UTI | Universal Technical | | Services & Goods | 16.52 | 55 | 5.83 | 31.95% |
| GCO | Genesco | | Services & Goods | 25.81 | 30 | 5.65 | -26.70% |
| AMCX | AMC s | | Services & Goods | 12.51 | 74 | 5.57 | -33.42% |
| OMI | Owens & Minor | | Services & Goods | 19.22 | 0 | 5.55 | -0.26% |
| RVLV | Revolve Group | | Services & Goods | 20.73 | 64 | 5.39 | 25.03% |
| RRGB | Red Robin | | Services & Goods | 7.70 | 53 | 5.19 | -38.25% |
| LTH | Life Time | | Services & Goods | 14.81 | 100 | 5.11 | -2.28% |
| WLDN | Willdan Group | | Services & Goods | 32.84 | 100 | 4.97 | 52.77% |
| ATGE | Adtalem Global | | Services & Goods | 63.04 | 100 | 4.93 | 6.94% |
| CRAI | CRA | | Services & Goods | 161.18 | 95 | 4.78 | 63.05% |
| CDNA | CareDx | | Services & Goods | 10.18 | 25 | 4.68 | -15.21% |
| IHRT | iHeartMedia | | Services & Goods | 2.36 | 74 | 4.67 | -11.80% |
| EAT | Brinker | | Services & Goods | 57.53 | 100 | 4.64 | 33.23% |
| BARK | BARK | | Services & Goods | 1.21 | 64 | 4.31 | 51.21% |
| HQI | HireQuest | | Services & Goods | 12.98 | 67 | 4.01 | -15.44% |
| SSP | E.W. Scripps | | Services & Goods | 4.44 | 100 | 3.98 | -44.43% |
| TGNA | TEGNA | | Services & Goods | 14.71 | 100 | 3.81 | -3.86% |
| KAR | KAR Auction | | Services & Goods | 18.35 | 95 | 3.73 | 23.90% |
| CRMT | America s | | Services & Goods | 61.20 | 74 | 3.73 | -19.23% |
| For chart view version of above stock list: Chart View ➞ 0 - 25 , 25 - 50 , 50 - 75 , 75 - 100 , 100 - 125 , 125 - 150 , 150 - 175 , 175 - 200 , 200 - 225 | ||
 | Click To Change The Sort Order: By Market Cap or Company Size Performance: Year-to-date, Week and Day |  |
| Too many stocks? View smallcap stocks filtered by marketcap & sector |
| Marketcap: All SmallCap Stocks (default-no microcap), Large, Mid-Range, Small |
| Smallcap Sector: Tech, Finance, Energy, Staples, Retail, Industrial, Materials, & Medical |
|
Get the most comprehensive stock market coverage daily at 12Stocks.com ➞ Best Stocks Today ➞ Best Stocks Weekly ➞ Best Stocks Year-to-Date ➞ Best Stocks Trends ➞  Best Stocks Today 12Stocks.com Best Nasdaq Stocks ➞ Best S&P 500 Stocks ➞ Best Tech Stocks ➞ Best Biotech Stocks ➞ |
| Detailed Overview of SmallCap Stocks |
| SmallCap Technical Overview, Leaders & Laggards, Top SmallCap ETF Funds & Detailed SmallCap Stocks List, Charts, Trends & More |
| Smallcap: Technical Analysis, Trends & YTD Performance | |
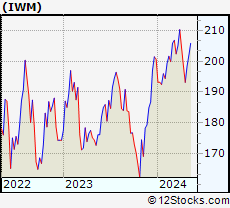
| SmallCap segment as represented by
IWM, an exchange-traded fund [ETF], holds basket of thousands of smallcap stocks from across all major sectors of the US stock market. The smallcap index (contains stocks like Riverbed & Sotheby's) is up by 1.89% and is currently underperforming the overall market by -6.13% year-to-date. Below is a quick view of technical charts and trends: | |
 IWM Weekly Chart |
|
| Long Term Trend: Very Good | |
| Medium Term Trend: Very Good | |
 IWM Daily Chart |
|
| Short Term Trend: Very Good | |
| Overall Trend Score: 82 | |
| YTD Performance: 1.89% | |
| **Trend Scores & Views Are Only For Educational Purposes And Not For Investing | |
| 12Stocks.com: Top Performing Small Cap Index Stocks | ||||||||||||||||||||||||||||||||||||||||||||||||
 The top performing Small Cap Index stocks year to date are
Now, more recently, over last week, the top performing Small Cap Index stocks on the move are


|
||||||||||||||||||||||||||||||||||||||||||||||||
| 12Stocks.com: Investing in Smallcap Index using Exchange Traded Funds | |
|
The following table shows list of key exchange traded funds (ETF) that
help investors track Smallcap index. The following list also includes leveraged ETF funds that track twice or thrice the daily returns of Smallcap indices. Short or inverse ETF funds move in the opposite direction to the index they track and are useful during market pullbacks or during bear markets. Quick View: Move mouse or cursor over ETF symbol (ticker) to view short-term technical chart and over ETF name to view long term chart. Click on ticker or stock name for detailed view. Click on to add stock symbol to your watchlist and to view watchlist. |
12Stocks.com List of ETFs that track Smallcap Index
| Ticker | ETF Name | Watchlist | Recent Price | Smart Investing & Trading Score | Change % | Week % | Year-to-date % |
| IWM | iShares Russell 2000 | | 204.51 | 82 | 1.29 | 1.29 | 1.89% |
| IJR | iShares Core S&P Small-Cap | | 108.26 | 47 | 1.05 | 1.05 | 0.01% |
| VTWO | Vanguard Russell 2000 ETF | | 82.59 | 82 | 1.20 | 1.2 | 1.84% |
| IWN | iShares Russell 2000 Value | | 155.65 | 65 | 0.93 | 0.93 | 0.21% |
| IWO | iShares Russell 2000 Growth | | 261.01 | 29 | 1.61 | 1.61 | 3.49% |
| IJS | iShares S&P Small-Cap 600 Value | | 99.75 | 69 | 1.04 | 1.04 | -3.22% |
| IJT | iShares S&P Small-Cap 600 Growth | | 129.04 | 95 | 1.00 | 1 | 3.12% |
| XSLV | PowerShares S&P SmallCap Low Volatil ETF | | 43.52 | 87 | 0.69 | 0.69 | -1.43% |
| SAA | ProShares Ultra SmallCap600 | | 24.10 | 82 | 2.16 | 2.16 | -3.41% |
| SDD | ProShares UltraShort SmallCap600 | | 18.42 | 10 | -2.26 | -2.26 | -0.04% |
| SBB | ProShares Short SmallCap600 | | 16.05 | 13 | -0.67 | -0.67 | 0.76% |
| SMLV | SPDR SSGA US Small Cap Low Volatil ETF | | 110.59 | 87 | 0.83 | 0.83 | -1.72% |
| 12Stocks.com: Charts, Trends, Fundamental Data and Performances of SmallCap Stocks | |
|
We now take in-depth look at all SmallCap stocks including charts, multi-period performances and overall trends (as measured by Smart Investing & Trading Score). One can sort SmallCap stocks (click link to choose) by Daily, Weekly and by Year-to-Date performances. Also, one can sort by size of the company or by market capitalization. |
| Select Your Default Chart Type: | |||||
| |||||
| Click on stock symbol or name for detailed view. Click on to add stock symbol to your watchlist and to view watchlist. Quick View: Move mouse or cursor over "Daily" to quickly view daily technical stock chart and over "Weekly" to view weekly technical stock chart. | |||||

 | NDLS Noodles & Company |
| Sector: Services & Goods | |
| SubSector: Restaurants | |
| MarketCap: 188.77 Millions | |
| Recent Price: 1.76 Smart Investing & Trading Score: 39 | |
| Day Percent Change: 11.39% Day Change: 0.18 | |
| Week Change: 11.39% Year-to-date Change: -44.1% | |
| NDLS Links: Profile News Message Board | |
| Charts:- Daily , Weekly | |
| Add NDLS to Watchlist: View: Get Complete NDLS Trend Analysis ➞ | |
 | LINC Lincoln Educational Services Corporation |
| Sector: Services & Goods | |
| SubSector: Education & Training Services | |
| MarketCap: 59.5006 Millions | |
| Recent Price: 12.25 Smart Investing & Trading Score: 60 | |
| Day Percent Change: 10.46% Day Change: 1.16 | |
| Week Change: 10.46% Year-to-date Change: 22.0% | |
| LINC Links: Profile News Message Board | |
| Charts:- Daily , Weekly | |
| Add LINC to Watchlist: View: Get Complete LINC Trend Analysis ➞ | |
 | TDUP ThredUp Inc. |
| Sector: Services & Goods | |
| SubSector: Internet Retail | |
| MarketCap: 258 Millions | |
| Recent Price: 1.86 Smart Investing & Trading Score: 69 | |
| Day Percent Change: 8.45% Day Change: 0.15 | |
| Week Change: 8.45% Year-to-date Change: -17.7% | |
| TDUP Links: Profile News Message Board | |
| Charts:- Daily , Weekly | |
| Add TDUP to Watchlist: View: Get Complete TDUP Trend Analysis ➞ | |
 | NL NL Industries, Inc. |
| Sector: Services & Goods | |
| SubSector: Industrial Equipment Wholesale | |
| MarketCap: 126.258 Millions | |
| Recent Price: 8.82 Smart Investing & Trading Score: 90 | |
| Day Percent Change: 7.04% Day Change: 0.58 | |
| Week Change: 7.04% Year-to-date Change: 57.2% | |
| NL Links: Profile News Message Board | |
| Charts:- Daily , Weekly | |
| Add NL to Watchlist: View: Get Complete NL Trend Analysis ➞ | |
 | NSSC Napco Security Technologies, Inc. |
| Sector: Services & Goods | |
| SubSector: Security & Protection Services | |
| MarketCap: 339.103 Millions | |
| Recent Price: 45.28 Smart Investing & Trading Score: 74 | |
| Day Percent Change: 6.62% Day Change: 2.81 | |
| Week Change: 6.62% Year-to-date Change: 32.2% | |
| NSSC Links: Profile News Message Board | |
| Charts:- Daily , Weekly | |
| Add NSSC to Watchlist: View: Get Complete NSSC Trend Analysis ➞ | |
 | CIX CompX International Inc. |
| Sector: Services & Goods | |
| SubSector: Security & Protection Services | |
| MarketCap: 189.603 Millions | |
| Recent Price: 34.67 Smart Investing & Trading Score: 60 | |
| Day Percent Change: 6.15% Day Change: 2.01 | |
| Week Change: 6.15% Year-to-date Change: 37.1% | |
| CIX Links: Profile News Message Board | |
| Charts:- Daily , Weekly | |
| Add CIX to Watchlist: View: Get Complete CIX Trend Analysis ➞ | |
 | UTI Universal Technical Institute, Inc. |
| Sector: Services & Goods | |
| SubSector: Education & Training Services | |
| MarketCap: 163.506 Millions | |
| Recent Price: 16.52 Smart Investing & Trading Score: 55 | |
| Day Percent Change: 5.83% Day Change: 0.91 | |
| Week Change: 5.83% Year-to-date Change: 32.0% | |
| UTI Links: Profile News Message Board | |
| Charts:- Daily , Weekly | |
| Add UTI to Watchlist: View: Get Complete UTI Trend Analysis ➞ | |
 | GCO Genesco Inc. |
| Sector: Services & Goods | |
| SubSector: Apparel Stores | |
| MarketCap: 187.508 Millions | |
| Recent Price: 25.81 Smart Investing & Trading Score: 30 | |
| Day Percent Change: 5.65% Day Change: 1.38 | |
| Week Change: 5.65% Year-to-date Change: -26.7% | |
| GCO Links: Profile News Message Board | |
| Charts:- Daily , Weekly | |
| Add GCO to Watchlist: View: Get Complete GCO Trend Analysis ➞ | |
 | AMCX AMC Networks Inc. |
| Sector: Services & Goods | |
| SubSector: Entertainment - Diversified | |
| MarketCap: 1477.37 Millions | |
| Recent Price: 12.51 Smart Investing & Trading Score: 74 | |
| Day Percent Change: 5.57% Day Change: 0.66 | |
| Week Change: 5.57% Year-to-date Change: -33.4% | |
| AMCX Links: Profile News Message Board | |
| Charts:- Daily , Weekly | |
| Add AMCX to Watchlist: View: Get Complete AMCX Trend Analysis ➞ | |
 | OMI Owens & Minor, Inc. |
| Sector: Services & Goods | |
| SubSector: Medical Equipment Wholesale | |
| MarketCap: 403.92 Millions | |
| Recent Price: 19.22 Smart Investing & Trading Score: 0 | |
| Day Percent Change: 5.55% Day Change: 1.01 | |
| Week Change: 5.55% Year-to-date Change: -0.3% | |
| OMI Links: Profile News Message Board | |
| Charts:- Daily , Weekly | |
| Add OMI to Watchlist: View: Get Complete OMI Trend Analysis ➞ | |
 | RVLV Revolve Group, Inc. |
| Sector: Services & Goods | |
| SubSector: Specialty Retail, Other | |
| MarketCap: 652.244 Millions | |
| Recent Price: 20.73 Smart Investing & Trading Score: 64 | |
| Day Percent Change: 5.39% Day Change: 1.06 | |
| Week Change: 5.39% Year-to-date Change: 25.0% | |
| RVLV Links: Profile News Message Board | |
| Charts:- Daily , Weekly | |
| Add RVLV to Watchlist: View: Get Complete RVLV Trend Analysis ➞ | |
 | RRGB Red Robin Gourmet Burgers, Inc. |
| Sector: Services & Goods | |
| SubSector: Restaurants | |
| MarketCap: 121.57 Millions | |
| Recent Price: 7.70 Smart Investing & Trading Score: 53 | |
| Day Percent Change: 5.19% Day Change: 0.38 | |
| Week Change: 5.19% Year-to-date Change: -38.3% | |
| RRGB Links: Profile News Message Board | |
| Charts:- Daily , Weekly | |
| Add RRGB to Watchlist: View: Get Complete RRGB Trend Analysis ➞ | |
 | LTH Life Time Group Holdings, Inc. |
| Sector: Services & Goods | |
| SubSector: Leisure | |
| MarketCap: 3740 Millions | |
| Recent Price: 14.81 Smart Investing & Trading Score: 100 | |
| Day Percent Change: 5.11% Day Change: 0.72 | |
| Week Change: 5.11% Year-to-date Change: -2.3% | |
| LTH Links: Profile News Message Board | |
| Charts:- Daily , Weekly | |
| Add LTH to Watchlist: View: Get Complete LTH Trend Analysis ➞ | |
 | WLDN Willdan Group, Inc. |
| Sector: Services & Goods | |
| SubSector: Technical Services | |
| MarketCap: 235.61 Millions | |
| Recent Price: 32.84 Smart Investing & Trading Score: 100 | |
| Day Percent Change: 4.97% Day Change: 1.55 | |
| Week Change: 4.97% Year-to-date Change: 52.8% | |
| WLDN Links: Profile News Message Board | |
| Charts:- Daily , Weekly | |
| Add WLDN to Watchlist: View: Get Complete WLDN Trend Analysis ➞ | |
 | ATGE Adtalem Global Education Inc. |
| Sector: Services & Goods | |
| SubSector: Education & Training Services | |
| MarketCap: 1273.86 Millions | |
| Recent Price: 63.04 Smart Investing & Trading Score: 100 | |
| Day Percent Change: 4.93% Day Change: 2.96 | |
| Week Change: 4.93% Year-to-date Change: 6.9% | |
| ATGE Links: Profile News Message Board | |
| Charts:- Daily , Weekly | |
| Add ATGE to Watchlist: View: Get Complete ATGE Trend Analysis ➞ | |
 | CRAI CRA International, Inc. |
| Sector: Services & Goods | |
| SubSector: Management Services | |
| MarketCap: 209.645 Millions | |
| Recent Price: 161.18 Smart Investing & Trading Score: 95 | |
| Day Percent Change: 4.78% Day Change: 7.36 | |
| Week Change: 4.78% Year-to-date Change: 63.1% | |
| CRAI Links: Profile News Message Board | |
| Charts:- Daily , Weekly | |
| Add CRAI to Watchlist: View: Get Complete CRAI Trend Analysis ➞ | |
 | CDNA CareDx, Inc |
| Sector: Services & Goods | |
| SubSector: Research Services | |
| MarketCap: 828.194 Millions | |
| Recent Price: 10.18 Smart Investing & Trading Score: 25 | |
| Day Percent Change: 4.68% Day Change: 0.46 | |
| Week Change: 4.68% Year-to-date Change: -15.2% | |
| CDNA Links: Profile News Message Board | |
| Charts:- Daily , Weekly | |
| Add CDNA to Watchlist: View: Get Complete CDNA Trend Analysis ➞ | |
 | IHRT iHeartMedia, Inc. |
| Sector: Services & Goods | |
| SubSector: Broadcasting - Radio | |
| MarketCap: 694 Millions | |
| Recent Price: 2.36 Smart Investing & Trading Score: 74 | |
| Day Percent Change: 4.67% Day Change: 0.10 | |
| Week Change: 4.67% Year-to-date Change: -11.8% | |
| IHRT Links: Profile News Message Board | |
| Charts:- Daily , Weekly | |
| Add IHRT to Watchlist: View: Get Complete IHRT Trend Analysis ➞ | |
 | EAT Brinker International, Inc. |
| Sector: Services & Goods | |
| SubSector: Restaurants | |
| MarketCap: 435.97 Millions | |
| Recent Price: 57.53 Smart Investing & Trading Score: 100 | |
| Day Percent Change: 4.64% Day Change: 2.55 | |
| Week Change: 4.64% Year-to-date Change: 33.2% | |
| EAT Links: Profile News Message Board | |
| Charts:- Daily , Weekly | |
| Add EAT to Watchlist: View: Get Complete EAT Trend Analysis ➞ | |
 | BARK BARK, Inc. |
| Sector: Services & Goods | |
| SubSector: Specialty Retail | |
| MarketCap: 234 Millions | |
| Recent Price: 1.21 Smart Investing & Trading Score: 64 | |
| Day Percent Change: 4.31% Day Change: 0.05 | |
| Week Change: 4.31% Year-to-date Change: 51.2% | |
| BARK Links: Profile News Message Board | |
| Charts:- Daily , Weekly | |
| Add BARK to Watchlist: View: Get Complete BARK Trend Analysis ➞ | |
 | HQI HireQuest, Inc. |
| Sector: Services & Goods | |
| SubSector: Staffing & Outsourcing Services | |
| MarketCap: 77 Millions | |
| Recent Price: 12.98 Smart Investing & Trading Score: 67 | |
| Day Percent Change: 4.01% Day Change: 0.50 | |
| Week Change: 4.01% Year-to-date Change: -15.4% | |
| HQI Links: Profile News Message Board | |
| Charts:- Daily , Weekly | |
| Add HQI to Watchlist: View: Get Complete HQI Trend Analysis ➞ | |
 | SSP The E.W. Scripps Company |
| Sector: Services & Goods | |
| SubSector: Broadcasting - TV | |
| MarketCap: 766.163 Millions | |
| Recent Price: 4.44 Smart Investing & Trading Score: 100 | |
| Day Percent Change: 3.98% Day Change: 0.17 | |
| Week Change: 3.98% Year-to-date Change: -44.4% | |
| SSP Links: Profile News Message Board | |
| Charts:- Daily , Weekly | |
| Add SSP to Watchlist: View: Get Complete SSP Trend Analysis ➞ | |
 | TGNA TEGNA Inc. |
| Sector: Services & Goods | |
| SubSector: Broadcasting - TV | |
| MarketCap: 2791.83 Millions | |
| Recent Price: 14.71 Smart Investing & Trading Score: 100 | |
| Day Percent Change: 3.81% Day Change: 0.54 | |
| Week Change: 3.81% Year-to-date Change: -3.9% | |
| TGNA Links: Profile News Message Board | |
| Charts:- Daily , Weekly | |
| Add TGNA to Watchlist: View: Get Complete TGNA Trend Analysis ➞ | |
 | KAR KAR Auction Services, Inc. |
| Sector: Services & Goods | |
| SubSector: Specialty Retail, Other | |
| MarketCap: 1709.54 Millions | |
| Recent Price: 18.35 Smart Investing & Trading Score: 95 | |
| Day Percent Change: 3.73% Day Change: 0.66 | |
| Week Change: 3.73% Year-to-date Change: 23.9% | |
| KAR Links: Profile News Message Board | |
| Charts:- Daily , Weekly | |
| Add KAR to Watchlist: View: Get Complete KAR Trend Analysis ➞ | |
 | CRMT America s Car-Mart, Inc. |
| Sector: Services & Goods | |
| SubSector: Auto Dealerships | |
| MarketCap: 329.921 Millions | |
| Recent Price: 61.20 Smart Investing & Trading Score: 74 | |
| Day Percent Change: 3.73% Day Change: 2.20 | |
| Week Change: 3.73% Year-to-date Change: -19.2% | |
| CRMT Links: Profile News Message Board | |
| Charts:- Daily , Weekly | |
| Add CRMT to Watchlist: View: Get Complete CRMT Trend Analysis ➞ | |
| For tabular summary view of above stock list: Summary View ➞ 0 - 25 , 25 - 50 , 50 - 75 , 75 - 100 , 100 - 125 , 125 - 150 , 150 - 175 , 175 - 200 , 200 - 225 | ||
| Click To Change The Sort Order: By Market Cap or Company Size Performance: Year-to-date, Week and Day | |
| Select Chart Type: | ||
| Too many stocks? View smallcap stocks filtered by marketcap & sector |
| Marketcap: All SmallCap Stocks (default-no microcap), Large, Mid-Range, Small & MicroCap |
| Sector: Tech, Finance, Energy, Staples, Retail, Industrial, Materials, Utilities & Medical |
|
Best Stocks Today 12Stocks.com |
© 2024 12Stocks.com Terms & Conditions Privacy Contact Us
All Information Provided Only For Education And Not To Be Used For Investing or Trading. See Terms & Conditions


One More Thing ... Get Best Stocks Delivered Daily!
Never Ever Miss A Move With Our Top Ten Stocks Lists
Find Best Stocks In Any Market - Bull or Bear Market
Take A Peek At Our Top Ten Stocks Lists: Daily, Weekly, Year-to-Date & Top Trends
Find Best Stocks In Any Market - Bull or Bear Market
Take A Peek At Our Top Ten Stocks Lists: Daily, Weekly, Year-to-Date & Top Trends
Smallcap Stocks With Best Up Trends [0-bearish to 100-bullish]: Perficient [100], Outset Medical[100], Dakota Gold[100], PMV [100], Twist Bioscience[100], SilverBow Resources[100], Regional Management[100], TPI Composites[100], AeroVironment [100], Solid Power[100], Wolverine World[100]
Best Smallcap Stocks Year-to-Date:
CareMax [511.34%], Janux [479.25%], Viking [320.15%], Alpine Immune[239.29%], Longboard [237.32%], Bakkt [197.53%], Vera [194.15%], Super Micro[192.28%], Avidity Biosciences[189.6%], Cullinan Oncology[178.76%], Y-mAbs [153.23%] Best Smallcap Stocks This Week:
Perficient [52.24%], P3 Health[25.16%], Outset Medical[23%], Lineage Cell[22.64%], SoundHound AI[19.54%], DASAN Zhone[19.25%], Workhorse Group[19.13%], BioCryst [18.65%], Marathon Patent[18.09%], Aceto [17.24%], Assertio [16.99%] Best Smallcap Stocks Daily:
Perficient [52.24%], P3 Health[25.16%], Outset Medical[23.00%], Lineage Cell[22.64%], SoundHound AI[19.54%], DASAN Zhone[19.25%], Workhorse Group[19.13%], BioCryst [18.65%], Marathon Patent[18.09%], Aceto [17.24%], Assertio [16.99%]