
 Login Sign Up


| |||||
 |  | ||||

| 12Stocks.com Market Intelligence |
Best SmallCap Stocks
|
| In a hurry? Small Cap Stock Lists: Performance Trends Table, Stock Charts
Sort Small Cap stocks: Daily, Weekly, Year-to-Date, Market Cap & Trends. Filter Small Cap stocks list by sector: Show all, Tech, Finance, Energy, Staples, Retail, Industrial, Materials, Utilities and HealthCare Filter Small Cap stocks list by size: All Large Medium Small and MicroCap |
| 12Stocks.com Small Cap Stocks Performances & Trends Daily | |||||||||
|
|  The overall Smart Investing & Trading Score is 76 (0-bearish to 100-bullish) which puts Small Cap index in short term neutral to bullish trend. The Smart Investing & Trading Score from previous trading session is 90 and hence a deterioration of trend.
| ||||||||
Here are the Smart Investing & Trading Scores of the most requested small cap stocks at 12Stocks.com (click stock name for detailed review):
|


| 12Stocks.com: Investing in Smallcap Index with Stocks | |
|
The following table helps investors and traders sort through current performance and trends (as measured by Smart Investing & Trading Score) of various
stocks in the Smallcap Index. Quick View: Move mouse or cursor over stock symbol (ticker) to view short-term technical chart and over stock name to view long term chart. Click on  to add stock symbol to your watchlist and to add stock symbol to your watchlist and  to view watchlist. Click on any ticker or stock name for detailed market intelligence report for that stock. to view watchlist. Click on any ticker or stock name for detailed market intelligence report for that stock. |
12Stocks.com Performance of Stocks in Smallcap Index
| Ticker | Stock Name | Watchlist | Category | Recent Price | Smart Investing & Trading Score | Change % | YTD Change% |
| ARCH | Arch Coal |   | Materials | 161.28 | 42 | 1.17 | -2.81% |
| TROX | Tronox | | Materials | 19.39 | 83 | 0.99 | 36.94% |
| CBT | Cabot | | Materials | 102.40 | 83 | 0.83 | 22.63% |
| SXT | Sensient | | Materials | 75.98 | 85 | 0.64 | 15.12% |
| SCL | Stepan | | Materials | 88.06 | 57 | 0.46 | -6.86% |
| GPRE | Green Plains | | Materials | 19.16 | 27 | 0.42 | -24.03% |
| CENTA | Central Garden | | Materials | 39.73 | 76 | 0.33 | -9.79% |
| ASIX | AdvanSix | | Materials | 24.85 | 44 | 0.12 | -17.06% |
| SLVM | Sylvamo | | Materials | 70.30 | 90 | 0.10 | 43.15% |
| SLCA | U.S. Silica | | Materials | 15.52 | 43 | 0.06 | 37.22% |
| FF | FutureFuel | | Materials | 5.00 | 25 | 0.00 | -17.76% |
| WDFC | WD-40 | | Materials | 238.67 | 40 | -0.05 | -0.17% |
| BTU | Peabody Energy | | Materials | 22.53 | 35 | -0.13 | -7.36% |
| OEC | Orion Engineered | | Materials | 25.69 | 95 | -0.16 | -7.36% |
| FUL | H.B. Fuller | | Materials | 81.15 | 90 | -0.25 | -0.32% |
| DC | Dakota Gold | | Materials | 3.00 | 100 | -0.33 | 15.38% |
| SXC | SunCoke Energy | | Materials | 10.52 | 57 | -0.38 | -2.05% |
| CMC | Commercial Metals | | Materials | 57.60 | 76 | -0.47 | 15.11% |
| BCPC | Balchem | | Materials | 155.83 | 57 | -0.51 | 4.76% |
| IIIN | Insteel Industries | | Materials | 32.66 | 15 | -0.64 | -14.70% |
| IOSP | Innospec | | Materials | 129.50 | 68 | -0.64 | 5.08% |
| CSTM | Constellium SE | | Materials | 20.70 | 65 | -0.67 | 3.71% |
| BHIL | Benson Hill | | Materials | 0.23 | 52 | -0.70 | 28.57% |
| IPI | Intrepid Potash | | Materials | 24.88 | 75 | -0.76 | 4.14% |
| KRO | Kronos Worldwide | | Materials | 13.11 | 95 | -0.83 | 31.89% |
| For chart view version of above stock list: Chart View ➞ 0 - 25 , 25 - 50 , 50 - 75 | ||
 | Click To Change The Sort Order: By Market Cap or Company Size Performance: Year-to-date, Week and Day |  |
| Too many stocks? View smallcap stocks filtered by marketcap & sector |
| Marketcap: All SmallCap Stocks (default-no microcap), Large, Mid-Range, Small |
| Smallcap Sector: Tech, Finance, Energy, Staples, Retail, Industrial, Materials, & Medical |
|
Get the most comprehensive stock market coverage daily at 12Stocks.com ➞ Best Stocks Today ➞ Best Stocks Weekly ➞ Best Stocks Year-to-Date ➞ Best Stocks Trends ➞  Best Stocks Today 12Stocks.com Best Nasdaq Stocks ➞ Best S&P 500 Stocks ➞ Best Tech Stocks ➞ Best Biotech Stocks ➞ |
| Detailed Overview of SmallCap Stocks |
| SmallCap Technical Overview, Leaders & Laggards, Top SmallCap ETF Funds & Detailed SmallCap Stocks List, Charts, Trends & More |
| Smallcap: Technical Analysis, Trends & YTD Performance | |
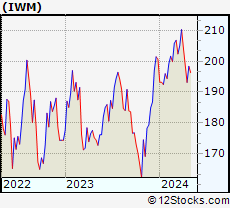
| SmallCap segment as represented by
IWM, an exchange-traded fund [ETF], holds basket of thousands of smallcap stocks from across all major sectors of the US stock market. The smallcap index (contains stocks like Riverbed & Sotheby's) is up by 3.67% and is currently underperforming the overall market by -6.9% year-to-date. Below is a quick view of technical charts and trends: | |
 IWM Weekly Chart |
|
| Long Term Trend: Very Good | |
| Medium Term Trend: Very Good | |
 IWM Daily Chart |
|
| Short Term Trend: Good | |
| Overall Trend Score: 76 | |
| YTD Performance: 3.67% | |
| **Trend Scores & Views Are Only For Educational Purposes And Not For Investing | |
| 12Stocks.com: Top Performing Small Cap Index Stocks | ||||||||||||||||||||||||||||||||||||||||||||||||
 The top performing Small Cap Index stocks year to date are
Now, more recently, over last week, the top performing Small Cap Index stocks on the move are


|
||||||||||||||||||||||||||||||||||||||||||||||||
| 12Stocks.com: Investing in Smallcap Index using Exchange Traded Funds | |
|
The following table shows list of key exchange traded funds (ETF) that
help investors track Smallcap index. The following list also includes leveraged ETF funds that track twice or thrice the daily returns of Smallcap indices. Short or inverse ETF funds move in the opposite direction to the index they track and are useful during market pullbacks or during bear markets. Quick View: Move mouse or cursor over ETF symbol (ticker) to view short-term technical chart and over ETF name to view long term chart. Click on ticker or stock name for detailed view. Click on to add stock symbol to your watchlist and to view watchlist. |
12Stocks.com List of ETFs that track Smallcap Index
| Ticker | ETF Name | Watchlist | Recent Price | Smart Investing & Trading Score | Change % | Week % | Year-to-date % |
| IWM | iShares Russell 2000 | | 208.08 | 76 | 0.07 | 1.85 | 3.67% |
| VTWO | Vanguard Russell 2000 ETF | | 84.11 | 71 | 0.00 | 1.8 | 3.71% |
| IJR | iShares Core S&P Small-Cap | | 110.39 | 68 | -0.22 | 1.29 | 1.98% |
| IWN | iShares Russell 2000 Value | | 158.71 | 76 | -0.07 | 1.61 | 2.18% |
| IWO | iShares Russell 2000 Growth | | 265.15 | 63 | -0.75 | 2.01 | 5.13% |
| IJS | iShares S&P Small-Cap 600 Value | | 101.87 | 76 | -0.15 | 1.34 | -1.16% |
| IJT | iShares S&P Small-Cap 600 Growth | | 131.34 | 71 | 0.04 | 1.14 | 4.95% |
| XSLV | PowerShares S&P SmallCap Low Volatil ETF | | 44.48 | 83 | -0.01 | 0.55 | 0.74% |
| SAA | ProShares Ultra SmallCap600 | | 24.90 | 71 | 0.50 | 2.28 | -0.18% |
| SMLV | SPDR SSGA US Small Cap Low Volatil ETF | | 113.28 | 95 | 0.43 | 1.85 | 0.68% |
| SDD | ProShares UltraShort SmallCap600 | | 17.84 | 35 | 0.96 | -2.41 | -3.19% |
| SBB | ProShares Short SmallCap600 | | 15.77 | 25 | 0.41 | -1.14 | -0.98% |
| 12Stocks.com: Charts, Trends, Fundamental Data and Performances of SmallCap Stocks | |
|
We now take in-depth look at all SmallCap stocks including charts, multi-period performances and overall trends (as measured by Smart Investing & Trading Score). One can sort SmallCap stocks (click link to choose) by Daily, Weekly and by Year-to-Date performances. Also, one can sort by size of the company or by market capitalization. |
| Select Your Default Chart Type: | |||||
| |||||
| Click on stock symbol or name for detailed view. Click on to add stock symbol to your watchlist and to view watchlist. Quick View: Move mouse or cursor over "Daily" to quickly view daily technical stock chart and over "Weekly" to view weekly technical stock chart. | |||||

 | ARCH Arch Coal, Inc. |
| Sector: Materials | |
| SubSector: Industrial Metals & Minerals | |
| MarketCap: 547.21 Millions | |
| Recent Price: 161.28 Smart Investing & Trading Score: 42 | |
| Day Percent Change: 1.17% Day Change: 1.86 | |
| Week Change: 0.24% Year-to-date Change: -2.8% | |
| ARCH Links: Profile News Message Board | |
| Charts:- Daily , Weekly | |
| Add ARCH to Watchlist: View: Get Complete ARCH Trend Analysis ➞ | |
 | TROX Tronox Holdings plc |
| Sector: Materials | |
| SubSector: Chemicals - Major Diversified | |
| MarketCap: 807 Millions | |
| Recent Price: 19.39 Smart Investing & Trading Score: 83 | |
| Day Percent Change: 0.99% Day Change: 0.19 | |
| Week Change: 1.47% Year-to-date Change: 36.9% | |
| TROX Links: Profile News Message Board | |
| Charts:- Daily , Weekly | |
| Add TROX to Watchlist: View: Get Complete TROX Trend Analysis ➞ | |
 | CBT Cabot Corporation |
| Sector: Materials | |
| SubSector: Specialty Chemicals | |
| MarketCap: 1261.47 Millions | |
| Recent Price: 102.40 Smart Investing & Trading Score: 83 | |
| Day Percent Change: 0.83% Day Change: 0.84 | |
| Week Change: 0.48% Year-to-date Change: 22.6% | |
| CBT Links: Profile News Message Board | |
| Charts:- Daily , Weekly | |
| Add CBT to Watchlist: View: Get Complete CBT Trend Analysis ➞ | |
 | SXT Sensient Technologies Corporation |
| Sector: Materials | |
| SubSector: Specialty Chemicals | |
| MarketCap: 1961.37 Millions | |
| Recent Price: 75.98 Smart Investing & Trading Score: 85 | |
| Day Percent Change: 0.64% Day Change: 0.48 | |
| Week Change: -0.54% Year-to-date Change: 15.1% | |
| SXT Links: Profile News Message Board | |
| Charts:- Daily , Weekly | |
| Add SXT to Watchlist: View: Get Complete SXT Trend Analysis ➞ | |
 | SCL Stepan Company |
| Sector: Materials | |
| SubSector: Specialty Chemicals | |
| MarketCap: 1812.97 Millions | |
| Recent Price: 88.06 Smart Investing & Trading Score: 57 | |
| Day Percent Change: 0.46% Day Change: 0.40 | |
| Week Change: -1.11% Year-to-date Change: -6.9% | |
| SCL Links: Profile News Message Board | |
| Charts:- Daily , Weekly | |
| Add SCL to Watchlist: View: Get Complete SCL Trend Analysis ➞ | |
 | GPRE Green Plains Inc. |
| Sector: Materials | |
| SubSector: Specialty Chemicals | |
| MarketCap: 196.357 Millions | |
| Recent Price: 19.16 Smart Investing & Trading Score: 27 | |
| Day Percent Change: 0.42% Day Change: 0.08 | |
| Week Change: -4.1% Year-to-date Change: -24.0% | |
| GPRE Links: Profile News Message Board | |
| Charts:- Daily , Weekly | |
| Add GPRE to Watchlist: View: Get Complete GPRE Trend Analysis ➞ | |
 | CENTA Central Garden & Pet Company |
| Sector: Materials | |
| SubSector: Agricultural Chemicals | |
| MarketCap: 953 Millions | |
| Recent Price: 39.73 Smart Investing & Trading Score: 76 | |
| Day Percent Change: 0.33% Day Change: 0.13 | |
| Week Change: -1.24% Year-to-date Change: -9.8% | |
| CENTA Links: Profile News Message Board | |
| Charts:- Daily , Weekly | |
| Add CENTA to Watchlist: View: Get Complete CENTA Trend Analysis ➞ | |
 | ASIX AdvanSix Inc. |
| Sector: Materials | |
| SubSector: Chemicals - Major Diversified | |
| MarketCap: 394.136 Millions | |
| Recent Price: 24.85 Smart Investing & Trading Score: 44 | |
| Day Percent Change: 0.12% Day Change: 0.03 | |
| Week Change: -0.12% Year-to-date Change: -17.1% | |
| ASIX Links: Profile News Message Board | |
| Charts:- Daily , Weekly | |
| Add ASIX to Watchlist: View: Get Complete ASIX Trend Analysis ➞ | |
 | SLVM Sylvamo Corporation |
| Sector: Materials | |
| SubSector: Paper & Paper Products | |
| MarketCap: 1710 Millions | |
| Recent Price: 70.30 Smart Investing & Trading Score: 90 | |
| Day Percent Change: 0.10% Day Change: 0.07 | |
| Week Change: 9.13% Year-to-date Change: 43.2% | |
| SLVM Links: Profile News Message Board | |
| Charts:- Daily , Weekly | |
| Add SLVM to Watchlist: View: Get Complete SLVM Trend Analysis ➞ | |
 | SLCA U.S. Silica Holdings, Inc. |
| Sector: Materials | |
| SubSector: Industrial Metals & Minerals | |
| MarketCap: 93 Millions | |
| Recent Price: 15.52 Smart Investing & Trading Score: 43 | |
| Day Percent Change: 0.06% Day Change: 0.01 | |
| Week Change: 0% Year-to-date Change: 37.2% | |
| SLCA Links: Profile News Message Board | |
| Charts:- Daily , Weekly | |
| Add SLCA to Watchlist: View: Get Complete SLCA Trend Analysis ➞ | |
 | FF FutureFuel Corp. |
| Sector: Materials | |
| SubSector: Chemicals - Major Diversified | |
| MarketCap: 450.736 Millions | |
| Recent Price: 5.00 Smart Investing & Trading Score: 25 | |
| Day Percent Change: 0.00% Day Change: 0.00 | |
| Week Change: -9.09% Year-to-date Change: -17.8% | |
| FF Links: Profile News Message Board | |
| Charts:- Daily , Weekly | |
| Add FF to Watchlist: View: Get Complete FF Trend Analysis ➞ | |
 | WDFC WD-40 Company |
| Sector: Materials | |
| SubSector: Specialty Chemicals | |
| MarketCap: 2900.57 Millions | |
| Recent Price: 238.67 Smart Investing & Trading Score: 40 | |
| Day Percent Change: -0.05% Day Change: -0.13 | |
| Week Change: 2.84% Year-to-date Change: -0.2% | |
| WDFC Links: Profile News Message Board | |
| Charts:- Daily , Weekly | |
| Add WDFC to Watchlist: View: Get Complete WDFC Trend Analysis ➞ | |
 | BTU Peabody Energy Corporation |
| Sector: Materials | |
| SubSector: Industrial Metals & Minerals | |
| MarketCap: 355.11 Millions | |
| Recent Price: 22.53 Smart Investing & Trading Score: 35 | |
| Day Percent Change: -0.13% Day Change: -0.03 | |
| Week Change: 2.97% Year-to-date Change: -7.4% | |
| BTU Links: Profile News Message Board | |
| Charts:- Daily , Weekly | |
| Add BTU to Watchlist: View: Get Complete BTU Trend Analysis ➞ | |
 | OEC Orion Engineered Carbons S.A. |
| Sector: Materials | |
| SubSector: Specialty Chemicals | |
| MarketCap: 493.457 Millions | |
| Recent Price: 25.69 Smart Investing & Trading Score: 95 | |
| Day Percent Change: -0.16% Day Change: -0.04 | |
| Week Change: 2.47% Year-to-date Change: -7.4% | |
| OEC Links: Profile News Message Board | |
| Charts:- Daily , Weekly | |
| Add OEC to Watchlist: View: Get Complete OEC Trend Analysis ➞ | |
 | FUL H.B. Fuller Company |
| Sector: Materials | |
| SubSector: Specialty Chemicals | |
| MarketCap: 1655.67 Millions | |
| Recent Price: 81.15 Smart Investing & Trading Score: 90 | |
| Day Percent Change: -0.25% Day Change: -0.20 | |
| Week Change: 1.92% Year-to-date Change: -0.3% | |
| FUL Links: Profile News Message Board | |
| Charts:- Daily , Weekly | |
| Add FUL to Watchlist: View: Get Complete FUL Trend Analysis ➞ | |
 | DC Dakota Gold Corp. |
| Sector: Materials | |
| SubSector: Gold | |
| MarketCap: 218 Millions | |
| Recent Price: 3.00 Smart Investing & Trading Score: 100 | |
| Day Percent Change: -0.33% Day Change: -0.01 | |
| Week Change: 14.07% Year-to-date Change: 15.4% | |
| DC Links: Profile News Message Board | |
| Charts:- Daily , Weekly | |
| Add DC to Watchlist: View: Get Complete DC Trend Analysis ➞ | |
 | SXC SunCoke Energy, Inc. |
| Sector: Materials | |
| SubSector: Nonmetallic Mineral Mining | |
| MarketCap: 306.5 Millions | |
| Recent Price: 10.52 Smart Investing & Trading Score: 57 | |
| Day Percent Change: -0.38% Day Change: -0.04 | |
| Week Change: 2.04% Year-to-date Change: -2.1% | |
| SXC Links: Profile News Message Board | |
| Charts:- Daily , Weekly | |
| Add SXC to Watchlist: View: Get Complete SXC Trend Analysis ➞ | |
 | CMC Commercial Metals Company |
| Sector: Materials | |
| SubSector: Steel & Iron | |
| MarketCap: 1724.78 Millions | |
| Recent Price: 57.60 Smart Investing & Trading Score: 76 | |
| Day Percent Change: -0.47% Day Change: -0.27 | |
| Week Change: 0.54% Year-to-date Change: 15.1% | |
| CMC Links: Profile News Message Board | |
| Charts:- Daily , Weekly | |
| Add CMC to Watchlist: View: Get Complete CMC Trend Analysis ➞ | |
 | BCPC Balchem Corporation |
| Sector: Materials | |
| SubSector: Specialty Chemicals | |
| MarketCap: 3330.17 Millions | |
| Recent Price: 155.83 Smart Investing & Trading Score: 57 | |
| Day Percent Change: -0.51% Day Change: -0.80 | |
| Week Change: -0.38% Year-to-date Change: 4.8% | |
| BCPC Links: Profile News Message Board | |
| Charts:- Daily , Weekly | |
| Add BCPC to Watchlist: View: Get Complete BCPC Trend Analysis ➞ | |
 | IIIN Insteel Industries, Inc. |
| Sector: Materials | |
| SubSector: Steel & Iron | |
| MarketCap: 269.488 Millions | |
| Recent Price: 32.66 Smart Investing & Trading Score: 15 | |
| Day Percent Change: -0.64% Day Change: -0.21 | |
| Week Change: -3.88% Year-to-date Change: -14.7% | |
| IIIN Links: Profile News Message Board | |
| Charts:- Daily , Weekly | |
| Add IIIN to Watchlist: View: Get Complete IIIN Trend Analysis ➞ | |
 | IOSP Innospec Inc. |
| Sector: Materials | |
| SubSector: Specialty Chemicals | |
| MarketCap: 1665.57 Millions | |
| Recent Price: 129.50 Smart Investing & Trading Score: 68 | |
| Day Percent Change: -0.64% Day Change: -0.83 | |
| Week Change: -1.31% Year-to-date Change: 5.1% | |
| IOSP Links: Profile News Message Board | |
| Charts:- Daily , Weekly | |
| Add IOSP to Watchlist: View: Get Complete IOSP Trend Analysis ➞ | |
 | CSTM Constellium SE |
| Sector: Materials | |
| SubSector: Aluminum | |
| MarketCap: 646.608 Millions | |
| Recent Price: 20.70 Smart Investing & Trading Score: 65 | |
| Day Percent Change: -0.67% Day Change: -0.14 | |
| Week Change: 2.27% Year-to-date Change: 3.7% | |
| CSTM Links: Profile News Message Board | |
| Charts:- Daily , Weekly | |
| Add CSTM to Watchlist: View: Get Complete CSTM Trend Analysis ➞ | |
 | BHIL Benson Hill, Inc. |
| Sector: Materials | |
| SubSector: Agricultural Inputs | |
| MarketCap: 236 Millions | |
| Recent Price: 0.23 Smart Investing & Trading Score: 52 | |
| Day Percent Change: -0.70% Day Change: 0.00 | |
| Week Change: 12.5% Year-to-date Change: 28.6% | |
| BHIL Links: Profile News Message Board | |
| Charts:- Daily , Weekly | |
| Add BHIL to Watchlist: View: Get Complete BHIL Trend Analysis ➞ | |
 | IPI Intrepid Potash, Inc. |
| Sector: Materials | |
| SubSector: Agricultural Chemicals | |
| MarketCap: 160.329 Millions | |
| Recent Price: 24.88 Smart Investing & Trading Score: 75 | |
| Day Percent Change: -0.76% Day Change: -0.19 | |
| Week Change: 0.81% Year-to-date Change: 4.1% | |
| IPI Links: Profile News Message Board | |
| Charts:- Daily , Weekly | |
| Add IPI to Watchlist: View: Get Complete IPI Trend Analysis ➞ | |
 | KRO Kronos Worldwide, Inc. |
| Sector: Materials | |
| SubSector: Specialty Chemicals | |
| MarketCap: 1046.57 Millions | |
| Recent Price: 13.11 Smart Investing & Trading Score: 95 | |
| Day Percent Change: -0.83% Day Change: -0.11 | |
| Week Change: 1.55% Year-to-date Change: 31.9% | |
| KRO Links: Profile News Message Board | |
| Charts:- Daily , Weekly | |
| Add KRO to Watchlist: View: Get Complete KRO Trend Analysis ➞ | |
| For tabular summary view of above stock list: Summary View ➞ 0 - 25 , 25 - 50 , 50 - 75 | ||
| Click To Change The Sort Order: By Market Cap or Company Size Performance: Year-to-date, Week and Day | |
| Select Chart Type: | ||
| Too many stocks? View smallcap stocks filtered by marketcap & sector |
| Marketcap: All SmallCap Stocks (default-no microcap), Large, Mid-Range, Small & MicroCap |
| Sector: Tech, Finance, Energy, Staples, Retail, Industrial, Materials, Utilities & Medical |
|
Best Stocks Today 12Stocks.com |
© 2024 12Stocks.com Terms & Conditions Privacy Contact Us
All Information Provided Only For Education And Not To Be Used For Investing or Trading. See Terms & Conditions


One More Thing ... Get Best Stocks Delivered Daily!
Never Ever Miss A Move With Our Top Ten Stocks Lists
Find Best Stocks In Any Market - Bull or Bear Market
Take A Peek At Our Top Ten Stocks Lists: Daily, Weekly, Year-to-Date & Top Trends
Find Best Stocks In Any Market - Bull or Bear Market
Take A Peek At Our Top Ten Stocks Lists: Daily, Weekly, Year-to-Date & Top Trends
Smallcap Stocks With Best Up Trends [0-bearish to 100-bullish]: CommScope Holding[100], Coeur Mining[100], Hecla Mining[100], MicroStrategy [100], Enovix [100], Rayonier Advanced[100], Nurix [100], Energy Fuels[100], NovaGold Resources[100], Piedmont Lithium[100], Wave Life[100]
Best Smallcap Stocks Year-to-Date:
CareMax [495.88%], Bakkt [413.9%], Janux [338.34%], Viking [260.02%], Alpine Immune[241.23%], Longboard [238.63%], Avidity Biosciences[226.33%], Super Micro[212.35%], Arcutis Bio[184.83%], Sweetgreen [180.97%], Novavax [171.04%] Best Smallcap Stocks This Week:
Vaxxinity [58.82%], Novavax [46.51%], Vicarious Surgical[45.62%], Harrow Health[44.48%], ProKidney [44.31%], Workhorse Group[36.06%], Maxeon Solar[35.94%], Fossil Group[35.44%], Humacyte [34.68%], MicroStrategy [34.23%], Cadiz [33.48%] Best Smallcap Stocks Daily:
Vaxxinity [45.95%], Presto Automation[31.90%], Vicarious Surgical[27.93%], Orchestra BioMed[12.77%], CommScope Holding[11.86%], Coeur Mining[11.57%], Hecla Mining[11.11%], MicroStrategy [10.04%], Tenaya [9.65%], Bakkt [9.25%], Enovix [9.25%]