
 Login Sign Up


| |||||
 |  | ||||

| 12Stocks.com Market Intelligence |
Best SmallCap Stocks
|
| In a hurry? Small Cap Stock Lists: Performance Trends Table, Stock Charts
Sort Small Cap stocks: Daily, Weekly, Year-to-Date, Market Cap & Trends. Filter Small Cap stocks list by sector: Show all, Tech, Finance, Energy, Staples, Retail, Industrial, Materials, Utilities and HealthCare Filter Small Cap stocks list by size: All Large Medium Small and MicroCap |
| 12Stocks.com Small Cap Stocks Performances & Trends Daily | |||||||||
|
|  The overall Smart Investing & Trading Score is 49 (0-bearish to 100-bullish) which puts Small Cap index in short term neutral trend. The Smart Investing & Trading Score from previous trading session is 14 and hence an improvement of trend.
| ||||||||
Here are the Smart Investing & Trading Scores of the most requested small cap stocks at 12Stocks.com (click stock name for detailed review):
|


| 12Stocks.com: Investing in Smallcap Index with Stocks | |
|
The following table helps investors and traders sort through current performance and trends (as measured by Smart Investing & Trading Score) of various
stocks in the Smallcap Index. Quick View: Move mouse or cursor over stock symbol (ticker) to view short-term technical chart and over stock name to view long term chart. Click on  to add stock symbol to your watchlist and to add stock symbol to your watchlist and  to view watchlist. Click on any ticker or stock name for detailed market intelligence report for that stock. to view watchlist. Click on any ticker or stock name for detailed market intelligence report for that stock. |
12Stocks.com Performance of Stocks in Smallcap Index
| Ticker | Stock Name | Watchlist | Category | Recent Price | Smart Investing & Trading Score | Change % | YTD Change% |
| AIV | Apartment |   | Financials | 8.11 | 66 | 2.53 | 3.58% |
| GDOT | Green Dot | | Financials | 9.32 | 100 | 2.53 | -5.86% |
| OCFC | OceanFirst Financial | | Financials | 15.48 | 93 | 2.52 | -10.83% |
| VBTX | Veritex | | Financials | 20.50 | 93 | 2.50 | -11.90% |
| BUSE | First Busey | | Financials | 23.46 | 95 | 2.49 | -5.48% |
| WSFS | WSFS Financial | | Financials | 44.87 | 93 | 2.49 | -2.31% |
| FCBC | First Community | | Financials | 34.94 | 100 | 2.48 | -5.82% |
| HLNE | Hamilton Lane | | Financials | 115.33 | 77 | 2.48 | 1.67% |
| TMP | Tompkins Financial | | Financials | 46.83 | 67 | 2.47 | -22.25% |
| PWOD | Penns Woods | | Financials | 18.75 | 74 | 2.46 | -16.70% |
| PIPR | Piper Sandler | | Financials | 203.16 | 95 | 2.45 | 16.18% |
| NWBI | Northwest Bancshares | | Financials | 10.93 | 57 | 2.44 | -12.42% |
| PPBI | Pacific Premier | | Financials | 22.76 | 80 | 2.43 | -21.81% |
| NWFL | Norwood Financial | | Financials | 25.28 | 64 | 2.43 | -23.18% |
| WSBF | Waterstone Financial | | Financials | 12.07 | 67 | 2.37 | -15.00% |
| ONL | Orion Office | | Financials | 3.29 | 60 | 2.33 | -42.40% |
| LMND | Lemonade | | Financials | 17.74 | 75 | 2.31 | 9.98% |
| ALTI | AlTi Global | | Financials | 4.90 | 42 | 2.30 | -45.98% |
| AFCG | AFC Gamma | | Financials | 12.22 | 100 | 2.30 | 1.41% |
| FISI | Financial Institutions | | Financials | 17.83 | 74 | 2.29 | -16.29% |
| FCPT | Four Corners | | Financials | 24.09 | 87 | 2.25 | -4.78% |
| OSBC | Old Second | | Financials | 14.15 | 100 | 2.24 | -8.35% |
| ESGR | Enstar Group | | Financials | 299.51 | 64 | 2.24 | 1.75% |
| FSBW | FS Bancorp | | Financials | 32.46 | 64 | 2.24 | -12.18% |
| DEI | Douglas Emmett | | Financials | 13.74 | 81 | 2.23 | -5.24% |
| For chart view version of above stock list: Chart View ➞ 0 - 25 , 25 - 50 , 50 - 75 , 75 - 100 , 100 - 125 , 125 - 150 , 150 - 175 , 175 - 200 , 200 - 225 , 225 - 250 , 250 - 275 , 275 - 300 , 300 - 325 , 325 - 350 , 350 - 375 , 375 - 400 | ||
 | Click To Change The Sort Order: By Market Cap or Company Size Performance: Year-to-date, Week and Day |  |
| Too many stocks? View smallcap stocks filtered by marketcap & sector |
| Marketcap: All SmallCap Stocks (default-no microcap), Large, Mid-Range, Small |
| Smallcap Sector: Tech, Finance, Energy, Staples, Retail, Industrial, Materials, & Medical |
|
Get the most comprehensive stock market coverage daily at 12Stocks.com ➞ Best Stocks Today ➞ Best Stocks Weekly ➞ Best Stocks Year-to-Date ➞ Best Stocks Trends ➞  Best Stocks Today 12Stocks.com Best Nasdaq Stocks ➞ Best S&P 500 Stocks ➞ Best Tech Stocks ➞ Best Biotech Stocks ➞ |
| Detailed Overview of SmallCap Stocks |
| SmallCap Technical Overview, Leaders & Laggards, Top SmallCap ETF Funds & Detailed SmallCap Stocks List, Charts, Trends & More |
| Smallcap: Technical Analysis, Trends & YTD Performance | |
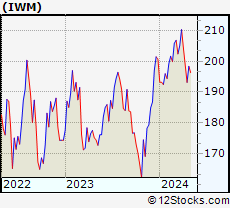
| SmallCap segment as represented by
IWM, an exchange-traded fund [ETF], holds basket of thousands of smallcap stocks from across all major sectors of the US stock market. The smallcap index (contains stocks like Riverbed & Sotheby's) is down by -0.39% and is currently underperforming the overall market by -6.01% year-to-date. Below is a quick view of technical charts and trends: | |
 IWM Weekly Chart |
|
| Long Term Trend: Not Good | |
| Medium Term Trend: Good | |
 IWM Daily Chart |
|
| Short Term Trend: Deteriorating | |
| Overall Trend Score: 49 | |
| YTD Performance: -0.39% | |
| **Trend Scores & Views Are Only For Educational Purposes And Not For Investing | |
| 12Stocks.com: Top Performing Small Cap Index Stocks | ||||||||||||||||||||||||||||||||||||||||||||||||
 The top performing Small Cap Index stocks year to date are
Now, more recently, over last week, the top performing Small Cap Index stocks on the move are


|
||||||||||||||||||||||||||||||||||||||||||||||||
| 12Stocks.com: Investing in Smallcap Index using Exchange Traded Funds | |
|
The following table shows list of key exchange traded funds (ETF) that
help investors track Smallcap index. The following list also includes leveraged ETF funds that track twice or thrice the daily returns of Smallcap indices. Short or inverse ETF funds move in the opposite direction to the index they track and are useful during market pullbacks or during bear markets. Quick View: Move mouse or cursor over ETF symbol (ticker) to view short-term technical chart and over ETF name to view long term chart. Click on ticker or stock name for detailed view. Click on to add stock symbol to your watchlist and to view watchlist. |
12Stocks.com List of ETFs that track Smallcap Index
| Ticker | ETF Name | Watchlist | Recent Price | Smart Investing & Trading Score | Change % | Week % | Year-to-date % |
| IWM | iShares Russell 2000 | | 199.92 | 49 | 1.84 | 0.77 | -0.39% |
| IJR | iShares Core S&P Small-Cap | | 106.33 | 50 | 1.52 | 0.64 | -1.77% |
| VTWO | Vanguard Russell 2000 ETF | | 80.85 | 42 | 1.88 | 0.79 | -0.31% |
| IWN | iShares Russell 2000 Value | | 152.88 | 75 | 2.04 | 1.15 | -1.58% |
| IWO | iShares Russell 2000 Growth | | 254.34 | 32 | 1.91 | 0.49 | 0.84% |
| IJS | iShares S&P Small-Cap 600 Value | | 98.02 | 43 | 1.68 | 0.85 | -4.9% |
| IJT | iShares S&P Small-Cap 600 Growth | | 126.72 | 63 | 1.42 | 0.5 | 1.26% |
| XSLV | PowerShares S&P SmallCap Low Volatil ETF | | 43.14 | 73 | 0.72 | 0.98 | -2.29% |
| SDD | ProShares UltraShort SmallCap600 | | 19.31 | 56 | -2.02 | -0.21 | 4.79% |
| SMLV | SPDR SSGA US Small Cap Low Volatil ETF | | 108.83 | 87 | 1.30 | 1.22 | -3.27% |
| SAA | ProShares Ultra SmallCap600 | | 22.93 | 42 | 1.56 | -0.46 | -8.08% |
| SBB | ProShares Short SmallCap600 | | 16.37 | 49 | -1.14 | -0.09 | 2.76% |
| 12Stocks.com: Charts, Trends, Fundamental Data and Performances of SmallCap Stocks | |
|
We now take in-depth look at all SmallCap stocks including charts, multi-period performances and overall trends (as measured by Smart Investing & Trading Score). One can sort SmallCap stocks (click link to choose) by Daily, Weekly and by Year-to-Date performances. Also, one can sort by size of the company or by market capitalization. |
| Select Your Default Chart Type: | |||||
| |||||
| Click on stock symbol or name for detailed view. Click on to add stock symbol to your watchlist and to view watchlist. Quick View: Move mouse or cursor over "Daily" to quickly view daily technical stock chart and over "Weekly" to view weekly technical stock chart. | |||||

 | AIV Apartment Investment and Management Company |
| Sector: Financials | |
| SubSector: REIT - Residential | |
| MarketCap: 4485.11 Millions | |
| Recent Price: 8.11 Smart Investing & Trading Score: 66 | |
| Day Percent Change: 2.53% Day Change: 0.20 | |
| Week Change: 0.75% Year-to-date Change: 3.6% | |
| AIV Links: Profile News Message Board | |
| Charts:- Daily , Weekly | |
| Add AIV to Watchlist: View: Get Complete AIV Trend Analysis ➞ | |
 | GDOT Green Dot Corporation |
| Sector: Financials | |
| SubSector: Credit Services | |
| MarketCap: 1320.08 Millions | |
| Recent Price: 9.32 Smart Investing & Trading Score: 100 | |
| Day Percent Change: 2.53% Day Change: 0.23 | |
| Week Change: 3.1% Year-to-date Change: -5.9% | |
| GDOT Links: Profile News Message Board | |
| Charts:- Daily , Weekly | |
| Add GDOT to Watchlist: View: Get Complete GDOT Trend Analysis ➞ | |
 | OCFC OceanFirst Financial Corp. |
| Sector: Financials | |
| SubSector: Savings & Loans | |
| MarketCap: 867.43 Millions | |
| Recent Price: 15.48 Smart Investing & Trading Score: 93 | |
| Day Percent Change: 2.52% Day Change: 0.38 | |
| Week Change: 0.72% Year-to-date Change: -10.8% | |
| OCFC Links: Profile News Message Board | |
| Charts:- Daily , Weekly | |
| Add OCFC to Watchlist: View: Get Complete OCFC Trend Analysis ➞ | |
 | VBTX Veritex Holdings, Inc. |
| Sector: Financials | |
| SubSector: Regional - Southwest Banks | |
| MarketCap: 625.165 Millions | |
| Recent Price: 20.50 Smart Investing & Trading Score: 93 | |
| Day Percent Change: 2.50% Day Change: 0.50 | |
| Week Change: 1.64% Year-to-date Change: -11.9% | |
| VBTX Links: Profile News Message Board | |
| Charts:- Daily , Weekly | |
| Add VBTX to Watchlist: View: Get Complete VBTX Trend Analysis ➞ | |
 | BUSE First Busey Corporation |
| Sector: Financials | |
| SubSector: Regional - Midwest Banks | |
| MarketCap: 876.97 Millions | |
| Recent Price: 23.46 Smart Investing & Trading Score: 95 | |
| Day Percent Change: 2.49% Day Change: 0.57 | |
| Week Change: 2.89% Year-to-date Change: -5.5% | |
| BUSE Links: Profile News Message Board | |
| Charts:- Daily , Weekly | |
| Add BUSE to Watchlist: View: Get Complete BUSE Trend Analysis ➞ | |
 | WSFS WSFS Financial Corporation |
| Sector: Financials | |
| SubSector: Regional - Mid-Atlantic Banks | |
| MarketCap: 1191.29 Millions | |
| Recent Price: 44.87 Smart Investing & Trading Score: 93 | |
| Day Percent Change: 2.49% Day Change: 1.09 | |
| Week Change: 4.71% Year-to-date Change: -2.3% | |
| WSFS Links: Profile News Message Board | |
| Charts:- Daily , Weekly | |
| Add WSFS to Watchlist: View: Get Complete WSFS Trend Analysis ➞ | |
 | FCBC First Community Bankshares, Inc. |
| Sector: Financials | |
| SubSector: Regional - Mid-Atlantic Banks | |
| MarketCap: 393.459 Millions | |
| Recent Price: 34.94 Smart Investing & Trading Score: 100 | |
| Day Percent Change: 2.48% Day Change: 0.84 | |
| Week Change: 4.27% Year-to-date Change: -5.8% | |
| FCBC Links: Profile News Message Board | |
| Charts:- Daily , Weekly | |
| Add FCBC to Watchlist: View: Get Complete FCBC Trend Analysis ➞ | |
 | HLNE Hamilton Lane Incorporated |
| Sector: Financials | |
| SubSector: Asset Management | |
| MarketCap: 2484.13 Millions | |
| Recent Price: 115.33 Smart Investing & Trading Score: 77 | |
| Day Percent Change: 2.48% Day Change: 2.79 | |
| Week Change: 0.7% Year-to-date Change: 1.7% | |
| HLNE Links: Profile News Message Board | |
| Charts:- Daily , Weekly | |
| Add HLNE to Watchlist: View: Get Complete HLNE Trend Analysis ➞ | |
 | TMP Tompkins Financial Corporation |
| Sector: Financials | |
| SubSector: Regional - Northeast Banks | |
| MarketCap: 1144.79 Millions | |
| Recent Price: 46.83 Smart Investing & Trading Score: 67 | |
| Day Percent Change: 2.47% Day Change: 1.13 | |
| Week Change: 1.08% Year-to-date Change: -22.3% | |
| TMP Links: Profile News Message Board | |
| Charts:- Daily , Weekly | |
| Add TMP to Watchlist: View: Get Complete TMP Trend Analysis ➞ | |
 | PWOD Penns Woods Bancorp, Inc. |
| Sector: Financials | |
| SubSector: Regional - Mid-Atlantic Banks | |
| MarketCap: 152.559 Millions | |
| Recent Price: 18.75 Smart Investing & Trading Score: 74 | |
| Day Percent Change: 2.46% Day Change: 0.45 | |
| Week Change: 7.05% Year-to-date Change: -16.7% | |
| PWOD Links: Profile News Message Board | |
| Charts:- Daily , Weekly | |
| Add PWOD to Watchlist: View: Get Complete PWOD Trend Analysis ➞ | |
 | PIPR Piper Sandler Companies |
| Sector: Financials | |
| SubSector: Asset Management | |
| MarketCap: 759.603 Millions | |
| Recent Price: 203.16 Smart Investing & Trading Score: 95 | |
| Day Percent Change: 2.45% Day Change: 4.85 | |
| Week Change: 3.04% Year-to-date Change: 16.2% | |
| PIPR Links: Profile News Message Board | |
| Charts:- Daily , Weekly | |
| Add PIPR to Watchlist: View: Get Complete PIPR Trend Analysis ➞ | |
 | NWBI Northwest Bancshares, Inc. |
| Sector: Financials | |
| SubSector: Savings & Loans | |
| MarketCap: 1266.3 Millions | |
| Recent Price: 10.93 Smart Investing & Trading Score: 57 | |
| Day Percent Change: 2.44% Day Change: 0.26 | |
| Week Change: 1.02% Year-to-date Change: -12.4% | |
| NWBI Links: Profile News Message Board | |
| Charts:- Daily , Weekly | |
| Add NWBI to Watchlist: View: Get Complete NWBI Trend Analysis ➞ | |
 | PPBI Pacific Premier Bancorp, Inc. |
| Sector: Financials | |
| SubSector: Regional - Pacific Banks | |
| MarketCap: 978.029 Millions | |
| Recent Price: 22.76 Smart Investing & Trading Score: 80 | |
| Day Percent Change: 2.43% Day Change: 0.54 | |
| Week Change: 3.55% Year-to-date Change: -21.8% | |
| PPBI Links: Profile News Message Board | |
| Charts:- Daily , Weekly | |
| Add PPBI to Watchlist: View: Get Complete PPBI Trend Analysis ➞ | |
 | NWFL Norwood Financial Corp. |
| Sector: Financials | |
| SubSector: Regional - Northeast Banks | |
| MarketCap: 201.899 Millions | |
| Recent Price: 25.28 Smart Investing & Trading Score: 64 | |
| Day Percent Change: 2.43% Day Change: 0.60 | |
| Week Change: 3.73% Year-to-date Change: -23.2% | |
| NWFL Links: Profile News Message Board | |
| Charts:- Daily , Weekly | |
| Add NWFL to Watchlist: View: Get Complete NWFL Trend Analysis ➞ | |
 | WSBF Waterstone Financial, Inc. |
| Sector: Financials | |
| SubSector: Savings & Loans | |
| MarketCap: 371.93 Millions | |
| Recent Price: 12.07 Smart Investing & Trading Score: 67 | |
| Day Percent Change: 2.37% Day Change: 0.28 | |
| Week Change: 2.37% Year-to-date Change: -15.0% | |
| WSBF Links: Profile News Message Board | |
| Charts:- Daily , Weekly | |
| Add WSBF to Watchlist: View: Get Complete WSBF Trend Analysis ➞ | |
 | ONL Orion Office REIT Inc. |
| Sector: Financials | |
| SubSector: REIT - Office | |
| MarketCap: 375 Millions | |
| Recent Price: 3.29 Smart Investing & Trading Score: 60 | |
| Day Percent Change: 2.33% Day Change: 0.07 | |
| Week Change: 1.38% Year-to-date Change: -42.4% | |
| ONL Links: Profile News Message Board | |
| Charts:- Daily , Weekly | |
| Add ONL to Watchlist: View: Get Complete ONL Trend Analysis ➞ | |
 | LMND Lemonade, Inc. |
| Sector: Financials | |
| SubSector: Insurance Property & Casualty | |
| MarketCap: 56457 Millions | |
| Recent Price: 17.74 Smart Investing & Trading Score: 75 | |
| Day Percent Change: 2.31% Day Change: 0.40 | |
| Week Change: -1.17% Year-to-date Change: 10.0% | |
| LMND Links: Profile News Message Board | |
| Charts:- Daily , Weekly | |
| Add LMND to Watchlist: View: Get Complete LMND Trend Analysis ➞ | |
 | ALTI AlTi Global, Inc. |
| Sector: Financials | |
| SubSector: Asset Management | |
| MarketCap: 917 Millions | |
| Recent Price: 4.90 Smart Investing & Trading Score: 42 | |
| Day Percent Change: 2.30% Day Change: 0.11 | |
| Week Change: 3.38% Year-to-date Change: -46.0% | |
| ALTI Links: Profile News Message Board | |
| Charts:- Daily , Weekly | |
| Add ALTI to Watchlist: View: Get Complete ALTI Trend Analysis ➞ | |
 | AFCG AFC Gamma, Inc. |
| Sector: Financials | |
| SubSector: REIT - Specialty | |
| MarketCap: 269 Millions | |
| Recent Price: 12.22 Smart Investing & Trading Score: 100 | |
| Day Percent Change: 2.30% Day Change: 0.28 | |
| Week Change: 3.38% Year-to-date Change: 1.4% | |
| AFCG Links: Profile News Message Board | |
| Charts:- Daily , Weekly | |
| Add AFCG to Watchlist: View: Get Complete AFCG Trend Analysis ➞ | |
 | FISI Financial Institutions, Inc. |
| Sector: Financials | |
| SubSector: Regional - Mid-Atlantic Banks | |
| MarketCap: 253.459 Millions | |
| Recent Price: 17.83 Smart Investing & Trading Score: 74 | |
| Day Percent Change: 2.29% Day Change: 0.40 | |
| Week Change: 1.31% Year-to-date Change: -16.3% | |
| FISI Links: Profile News Message Board | |
| Charts:- Daily , Weekly | |
| Add FISI to Watchlist: View: Get Complete FISI Trend Analysis ➞ | |
 | FCPT Four Corners Property Trust, Inc. |
| Sector: Financials | |
| SubSector: REIT - Hotel/Motel | |
| MarketCap: 1218.94 Millions | |
| Recent Price: 24.09 Smart Investing & Trading Score: 87 | |
| Day Percent Change: 2.25% Day Change: 0.53 | |
| Week Change: 2.77% Year-to-date Change: -4.8% | |
| FCPT Links: Profile News Message Board | |
| Charts:- Daily , Weekly | |
| Add FCPT to Watchlist: View: Get Complete FCPT Trend Analysis ➞ | |
 | OSBC Old Second Bancorp, Inc. |
| Sector: Financials | |
| SubSector: Regional - Midwest Banks | |
| MarketCap: 237.17 Millions | |
| Recent Price: 14.15 Smart Investing & Trading Score: 100 | |
| Day Percent Change: 2.24% Day Change: 0.31 | |
| Week Change: 0.86% Year-to-date Change: -8.4% | |
| OSBC Links: Profile News Message Board | |
| Charts:- Daily , Weekly | |
| Add OSBC to Watchlist: View: Get Complete OSBC Trend Analysis ➞ | |
 | ESGR Enstar Group Limited |
| Sector: Financials | |
| SubSector: Property & Casualty Insurance | |
| MarketCap: 2886.02 Millions | |
| Recent Price: 299.51 Smart Investing & Trading Score: 64 | |
| Day Percent Change: 2.24% Day Change: 6.56 | |
| Week Change: 3.89% Year-to-date Change: 1.8% | |
| ESGR Links: Profile News Message Board | |
| Charts:- Daily , Weekly | |
| Add ESGR to Watchlist: View: Get Complete ESGR Trend Analysis ➞ | |
 | FSBW FS Bancorp, Inc. |
| Sector: Financials | |
| SubSector: Regional - Pacific Banks | |
| MarketCap: 140.429 Millions | |
| Recent Price: 32.46 Smart Investing & Trading Score: 64 | |
| Day Percent Change: 2.24% Day Change: 0.71 | |
| Week Change: 3.15% Year-to-date Change: -12.2% | |
| FSBW Links: Profile News Message Board | |
| Charts:- Daily , Weekly | |
| Add FSBW to Watchlist: View: Get Complete FSBW Trend Analysis ➞ | |
 | DEI Douglas Emmett, Inc. |
| Sector: Financials | |
| SubSector: REIT - Diversified | |
| MarketCap: 4917.83 Millions | |
| Recent Price: 13.74 Smart Investing & Trading Score: 81 | |
| Day Percent Change: 2.23% Day Change: 0.30 | |
| Week Change: 2.77% Year-to-date Change: -5.2% | |
| DEI Links: Profile News Message Board | |
| Charts:- Daily , Weekly | |
| Add DEI to Watchlist: View: Get Complete DEI Trend Analysis ➞ | |
| For tabular summary view of above stock list: Summary View ➞ 0 - 25 , 25 - 50 , 50 - 75 , 75 - 100 , 100 - 125 , 125 - 150 , 150 - 175 , 175 - 200 , 200 - 225 , 225 - 250 , 250 - 275 , 275 - 300 , 300 - 325 , 325 - 350 , 350 - 375 , 375 - 400 | ||
| Click To Change The Sort Order: By Market Cap or Company Size Performance: Year-to-date, Week and Day | |
| Select Chart Type: | ||
| Too many stocks? View smallcap stocks filtered by marketcap & sector |
| Marketcap: All SmallCap Stocks (default-no microcap), Large, Mid-Range, Small & MicroCap |
| Sector: Tech, Finance, Energy, Staples, Retail, Industrial, Materials, Utilities & Medical |
|
Best Stocks Today 12Stocks.com |
© 2024 12Stocks.com Terms & Conditions Privacy Contact Us
All Information Provided Only For Education And Not To Be Used For Investing or Trading. See Terms & Conditions


One More Thing ... Get Best Stocks Delivered Daily!
Never Ever Miss A Move With Our Top Ten Stocks Lists
Find Best Stocks In Any Market - Bull or Bear Market
Take A Peek At Our Top Ten Stocks Lists: Daily, Weekly, Year-to-Date & Top Trends
Find Best Stocks In Any Market - Bull or Bear Market
Take A Peek At Our Top Ten Stocks Lists: Daily, Weekly, Year-to-Date & Top Trends
Smallcap Stocks With Best Up Trends [0-bearish to 100-bullish]: Emergent BioSolutions[100], Aspen Aerogels[100], Carvana Co[100], Perdoceo Education[100], Gannett Co[100], Pitney Bowes[100], Benchmark Electronics[100], Origin Materials[100], FormFactor [100], Lantheus [100], Q2 [100]
Best Smallcap Stocks Year-to-Date:
Janux [440.16%], Viking [307.09%], Longboard [273.98%], Alpine Immune[239.29%], Bakkt [187.89%], Avidity Biosciences[182.96%], Vera [170.74%], Cullinan Oncology[169.74%], Super Micro[168.25%], Arcutis Bio[166.25%], Y-mAbs [152.93%] Best Smallcap Stocks This Week:
Deciphera [73.24%], Emergent BioSolutions[71.88%], Eyenovia [49.22%], Aspen Aerogels[48.14%], P3 Health[38.51%], Carvana Co[38.18%], Cue Biopharma[37.73%], Origin Materials[36.24%], TransMedics Group[35.14%], Seres [34.55%], Enovix [32.07%] Best Smallcap Stocks Daily:
Emergent BioSolutions[70.98%], Aspen Aerogels[56.70%], Carvana Co[33.77%], Perdoceo Education[31.46%], Enovix [31.06%], Office Properties[28.00%], Gannett Co[26.97%], Sunnova Energy[25.21%], Pitney Bowes[24.70%], Pulmonx [21.50%], CommScope Holding[20.95%]